. 2018 Dec 20;16(12):e2006776.
doi: 10.1371/journal.pbio.2006776. eCollection 2018 Dec.

Errors as a primary cause of late-life mortality deceleration and plateaus

Affiliations

Errors as a primary cause of late-life mortality deceleration and plateaus

Saul Justin Newman. PLoS Biol. .

Abstract

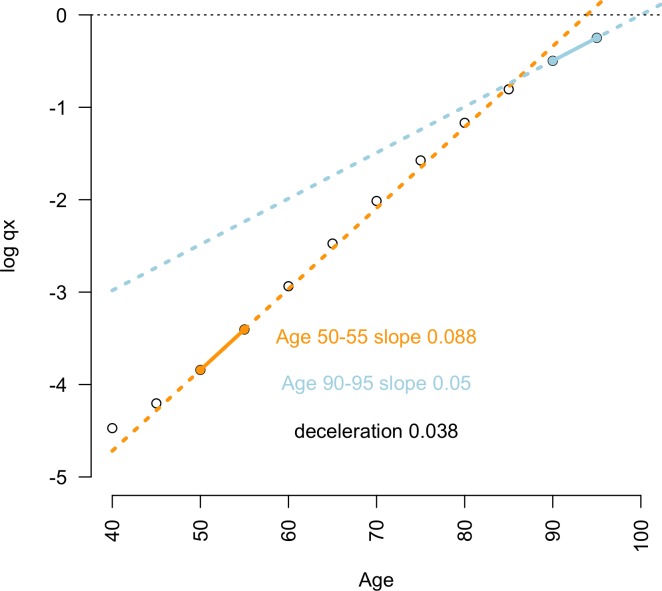
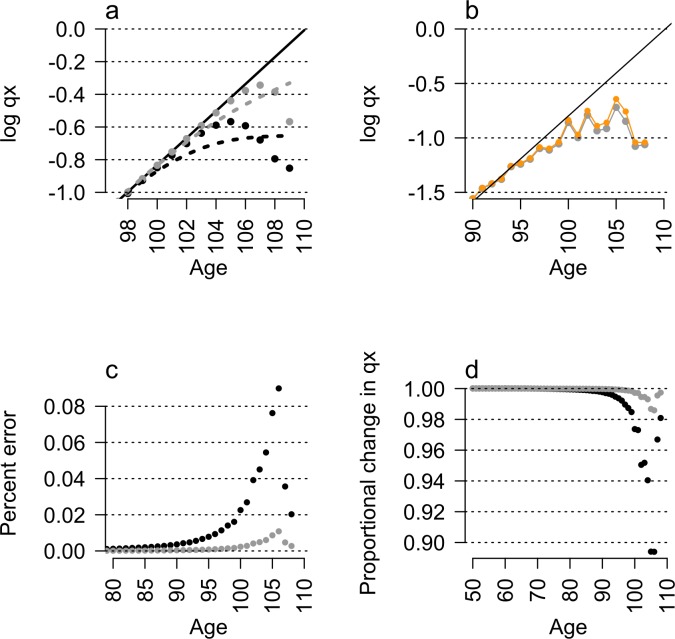
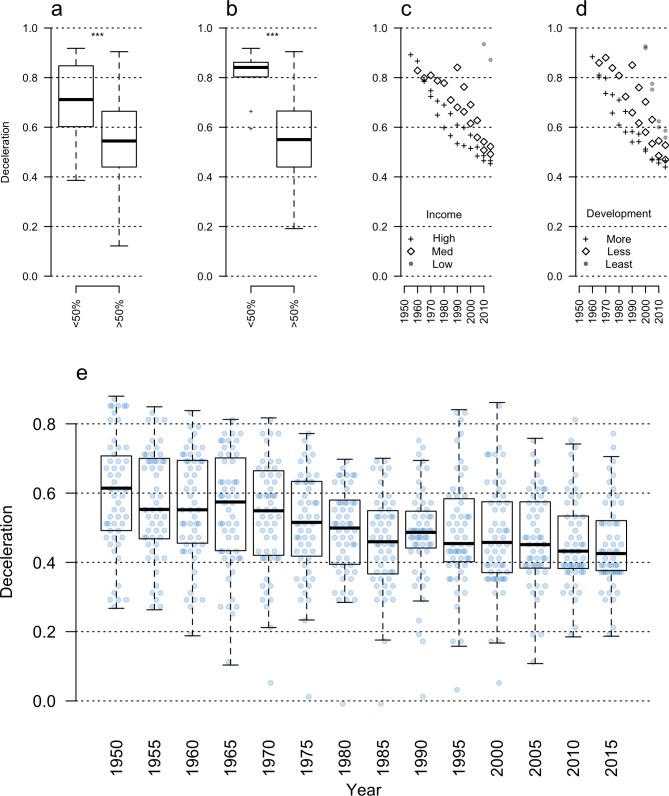
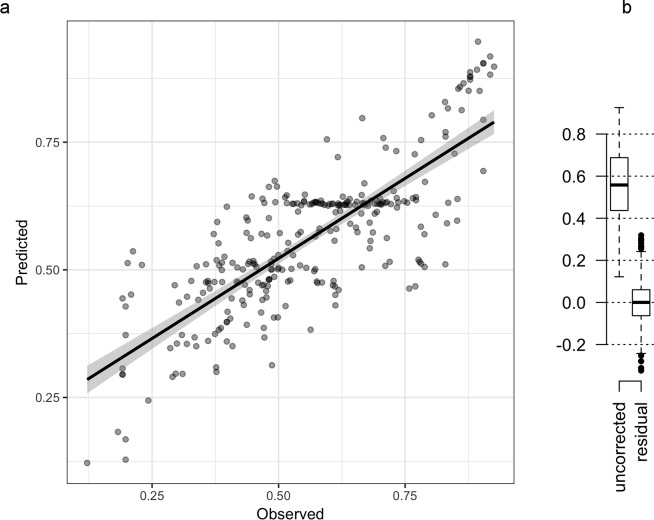
Several organisms, including humans, display a deceleration in mortality rates at advanced ages. This mortality deceleration is sufficiently rapid to allow late-life mortality to plateau in old age in several species, causing the apparent cessation of biological ageing. Here, it is shown that late-life mortality deceleration (LLMD) and late-life plateaus are caused by common demographic errors. Age estimation and cohort blending errors introduced at rates below 1 in 10,000 are sufficient to cause LLMD and plateaus. In humans, observed error rates of birth and death registration predict the magnitude of LLMD. Correction for these sources of demographic error using a mixed linear model eliminates LLMD and late-life mortality plateaus (LLMPs) without recourse to biological or evolutionary models. These results suggest models developed to explain LLMD have been fitted to an error distribution, that ageing does not slow or stop during old age in humans, and that there is a finite limit to human longevity.


Conflict of interest statement

The authors have declared that no competing interests exist.

Figures

Fig 1
Fig 1. LLMD measured by the gap between mid-life and late-life mortality rate increase.
Pooled global data on the age-specific probability of death qx (2015 data; female population) show the relatively slower rate of late-life mortality acceleration (ages 90–95; blue line) compared with mid-life mortality (ages 50–55; orange line) in humans. The difference between these slopes indicates the magnitude of LLMD. Underlying data can be found in S1 Data. LLMD, late-life mortality deceleration.
Fig 2
Fig 2. Random errors cause LLMDs and LLMPs.
(a) Introducing random age-reporting errors into a log-linear model of mortality (solid black line) artificially lowers the age-specific probability of death qx (points) in late life, causing LLMD and LLMPs (dotted lines). (b) These simulated effects often reflect late-life mortality patterns observed in real data, for example, shown here in Jeanne Calment’s birth cohort (orange). Introducing age-coding errors by randomly reassigning individuals between observed cohorts (b) further increases rates of mortality deceleration, (c) increases proportionally larger errors in the calculated probability of death, and (d) greatly reduces the probability of death at advanced ages. Exact effect of errors calculated at a probability p = 0.001 (grey) and p = 0.0001 (black), data in (a) fitted by locally smoothed splines (dashed lines). Underlying data can be found in S2 Data. LLMD, late-life mortality deceleration; LLMP, late-life mortality plateau.
Fig 3
Fig 3. Reduced LLMDs in populations with better population data and higher vital statistics coverage.
The rate of LLMD (y-axis) is linked to differences in (a) the fraction of the population with death certificates, (b) the fraction of the population with birth certificates, (c) per capita gross domestic product, and (d) levels of population development (Bonferroni-corrected pairwise t test; asterisks indicate p < 0.001). In populations with continuous records of late-life mortality (e), mortality deceleration rates have fallen by 25% since 1950, alongside gains in civil registration rates (N = 55). Underlying data can be found in S3 Data. LLMD, late-life mortality deceleration.
Fig 4
Fig 4. LLMD predicted by a mixed linear model.
A mixed linear mixed model (a) constructed using predictors of sampling error rates and continent of sampling explains the majority of human variation in LLMD (Pearson’s r = 0.82; adjusted R2 = 0.57; p < 10−6; N = 280 populations). (b) Correction for these factors eliminates LLMDs in humans. Underlying data can be found in S4 Data. LLMD, late-life mortality deceleration.

References

    1. Vaupel JW, Carey JR, Christensen K, Johnson TE, Yashin AI, Holm N V., et al. Biodemographic trajectories of longevity. Science. 1998;280(5365):855–860. 10.1126/science.280.5365.855 - DOI - PubMed
    1. Mueller LD, Rauser CL, Rose MR. Does Aging Stop? Oxford: Oxford University Press; 2011. 10.1093/acprof:oso/9780199754229.001.0001 - DOI
    1. Newman SJ, Easteal S. The dynamic upper limit of human lifespan. F1000Research. 2017;6:569 10.12688/f1000research.11438.2 - DOI - PMC - PubMed
    1. Barbi E, Lagona F, Marsili M, Vaupel JW, Wachter KW. The plateau of human mortality: Demography of longevity pioneers. Science (80-). 2018;360: 1459–1461. - PMC - PubMed
    1. Mueller LD, Rose MR. Evolutionary theory predicts late-life mortality plateaus. Proc Natl Acad Sci U S A. 1996;93: 15249–15253. 10.1073/pnas.93.26.15249 - DOI - PMC - PubMed