. 2018 Dec 20;13(12):e0209017.
doi: 10.1371/journal.pone.0209017. eCollection 2018.

Ambulatory assessment of phonotraumatic vocal hyperfunction using glottal airflow measures estimated from neck-surface acceleration

Affiliations

Ambulatory assessment of phonotraumatic vocal hyperfunction using glottal airflow measures estimated from neck-surface acceleration

Juan P Cortés et al. PLoS One. .

Abstract

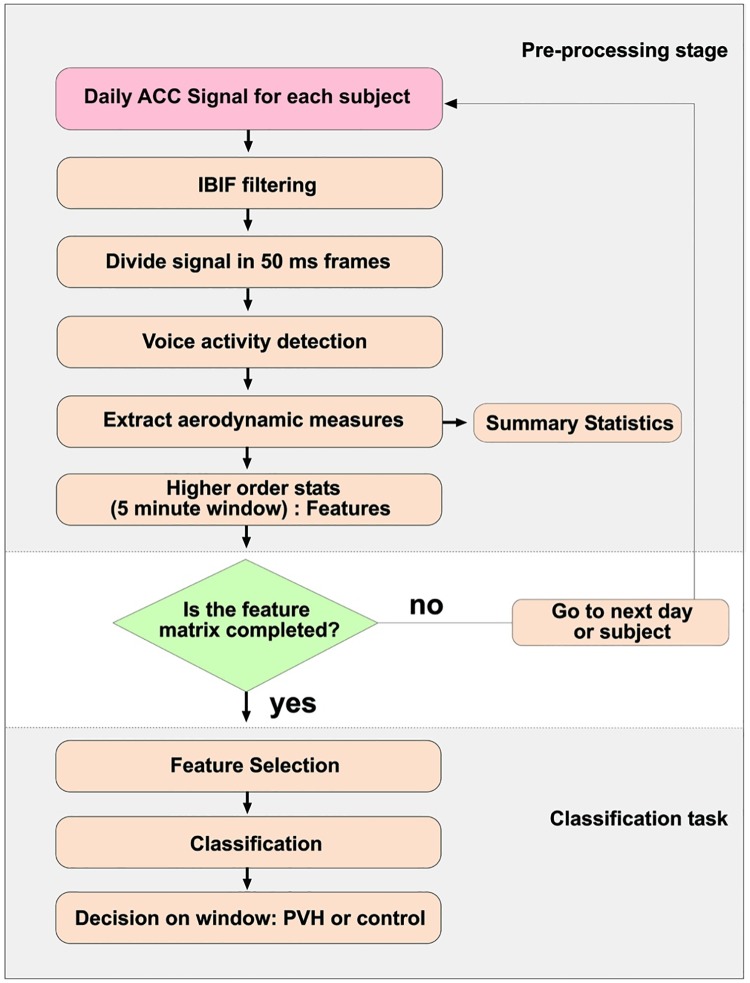
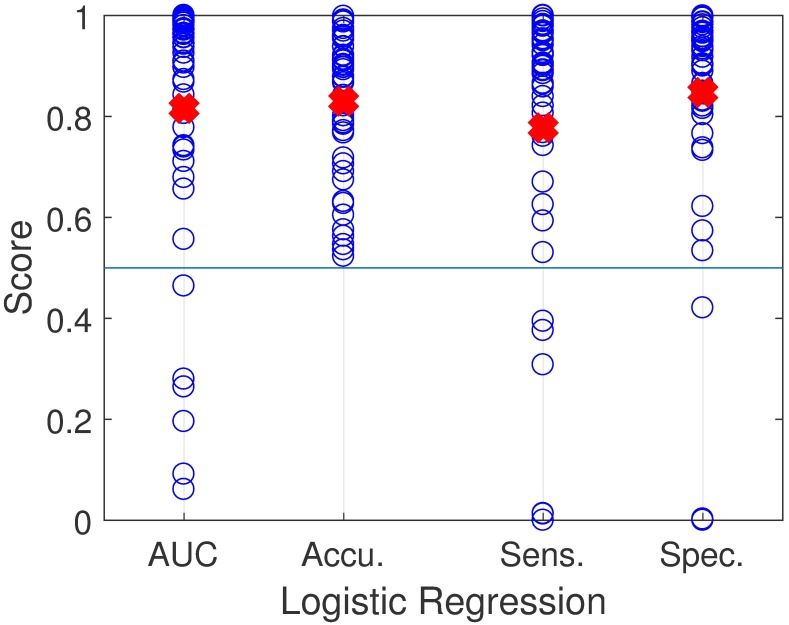
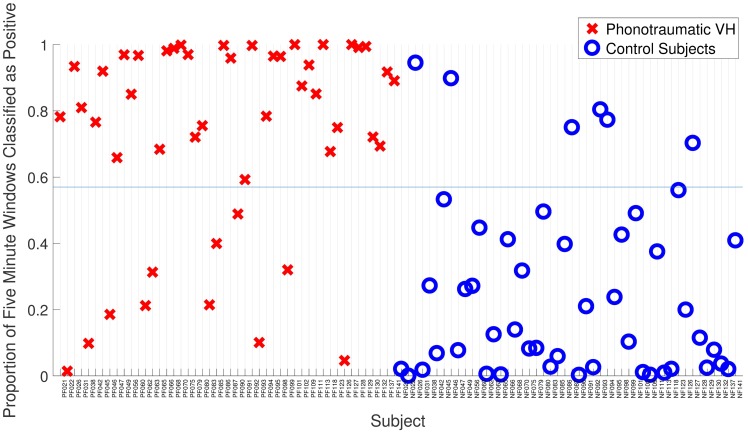
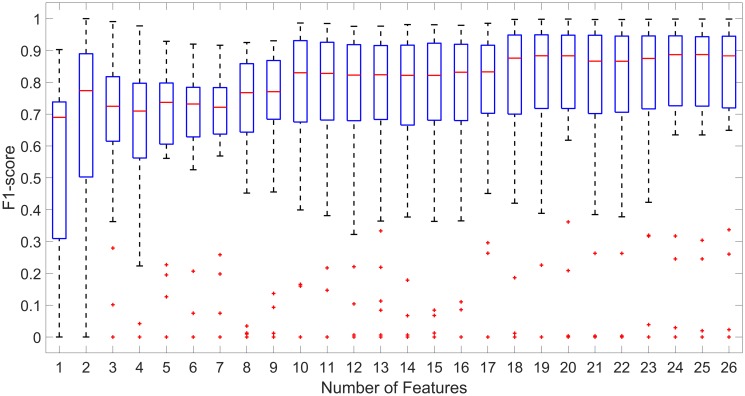
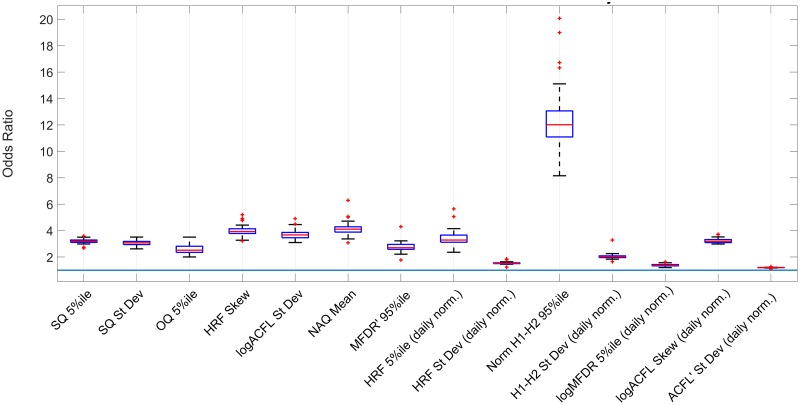
Phonotraumatic vocal hyperfunction (PVH) is associated with chronic misuse and/or abuse of voice that can result in lesions such as vocal fold nodules. The clinical aerodynamic assessment of vocal function has been recently shown to differentiate between patients with PVH and healthy controls to provide meaningful insight into pathophysiological mechanisms associated with these disorders. However, all current clinical assessment of PVH is incomplete because of its inability to objectively identify the type and extent of detrimental phonatory function that is associated with PVH during daily voice use. The current study sought to address this issue by incorporating, for the first time in a comprehensive ambulatory assessment, glottal airflow parameters estimated from a neck-mounted accelerometer and recorded to a smartphone-based voice monitor. We tested this approach on 48 patients with vocal fold nodules and 48 matched healthy-control subjects who each wore the voice monitor for a week. Seven glottal airflow features were estimated every 50 ms using an impedance-based inverse filtering scheme, and seven high-order summary statistics of each feature were computed every 5 minutes over voiced segments. Based on a univariate hypothesis testing, eight glottal airflow summary statistics were found to be statistically different between patient and healthy-control groups. L1-regularized logistic regression for a supervised classification task yielded a mean (standard deviation) area under the ROC curve of 0.82 (0.25) and an accuracy of 0.83 (0.14). These results outperform the state-of-the-art classification for the same classification task and provide a new avenue to improve the assessment and treatment of hyperfunctional voice disorders.


Conflict of interest statement

The authors have declared that no competing interests exist.

Figures

Fig 1
Fig 1. Example of VHM system.
Illustration of the smartphone-based ambulatory voice monitor that uses a neck-surface accelerometer attached to the skin halfway between the thyroid prominence and the suprasternal notch of a female subject.
Fig 2
Fig 2. Representation of the subglottal system.
(a) Accelerometer position and sub1 and sub2 system parts. (b) A mechano-acoustic analogy of the subglottal system including load impedance from skin. Reproduced with permission.
Fig 3
Fig 3. Example of ambulatory IBIF analysis.
(A) Estimated glottal airflow waveform and (B) its derivative, showing how time-domain measures were derived per glottal cycle. Measures were then averaged over all cycles to yield a single value per frame for each time-domain measure.
Fig 4
Fig 4. Spectrum of the frame in Fig 3(A).
Fig 5
Fig 5. Flowchart.
Feature extraction and classification process for 96 subjects.
Fig 6
Fig 6. Performance results across subject pairs with L1-logistic regression.
Area Under the ROC Curve (AUC), Accuracy, Sensitivity, Specificity. The red crosses indicates the average value for each performance metric.
Fig 7
Fig 7. Classification results from L1-logistic regression.
The threshold (blue line) at 0.57 classifies correctly 79 from 96 subjects (82.3%).
Fig 8
Fig 8. F-score distributions from Table 5.
From all 26 features (rightmost box plot) to only one feature (H1-H2 95th%, leftmost box plot).
Fig 9
Fig 9. Odds ratio association with phonotraumatic subjects.

References

    1. Roy N, Merrill RM, Gray SD, Smith EM. Voice Disorders in the General Population: Prevalence, Risk Factors, and Occupational Impact. The Laryngoscope. 2005;115(11):1988–1995. 10.1097/01.mlg.0000179174.32345.41 - DOI - PubMed
    1. Hillman RE, Holmberg EB, Perkell JS, Walsh M, Vaughan C. Objective Assessment of Vocal Hyperfunction: An Experimental Framework and Initial Results. J Speech Hear Res. 1989;32:373–392. 10.1044/jshr.3202.373 - DOI - PubMed
    1. Mehta DD, Van Stan JH, Zañartu M, Ghassemi M, Guttag JV, Espinoza VM, et al. Using ambulatory voice monitoring to investigate common voice disorders: research update. Front Bioeng Biotechnol 3:155 2015;. 10.3389/fbioe.2015.00155 - DOI - PMC - PubMed
    1. Espinoza VM, Zañartu M, Van Stan JH, Mehta DD, Hillman RE. Glottal Aerodynamic Measures in Women With Phonotraumatic and Nonphonotraumatic Vocal Hyperfunction. Journal of Speech, Language, and Hearing Research. 2017;60(8):2159–2169. 10.1044/2017_JSLHR-S-16-0337 - DOI - PMC - PubMed
    1. Rothenberg M. A new inverse filtering technique for deriving the glottal air flow waveform during voicing. The Journal of the Acoustical Society of America. 1973;53(6):1632–1645. 10.1121/1.1913513 - DOI - PubMed

Publication types