. 2018 Dec 20;13(12):e0209574.
doi: 10.1371/journal.pone.0209574. eCollection 2018.

Microfluidic device to attain high spatial and temporal control of oxygen

Affiliations

Microfluidic device to attain high spatial and temporal control of oxygen

Sandra F Lam et al. PLoS One. .

Abstract

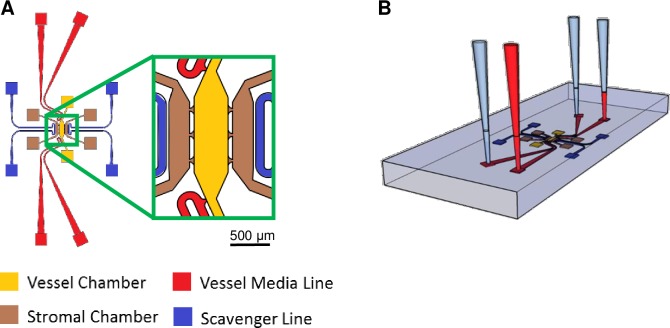
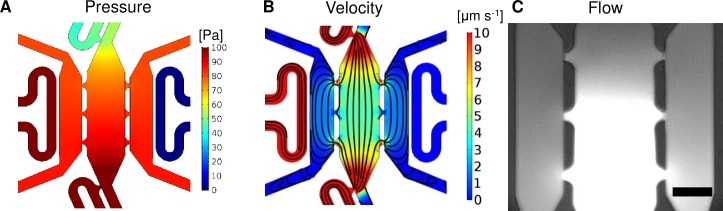
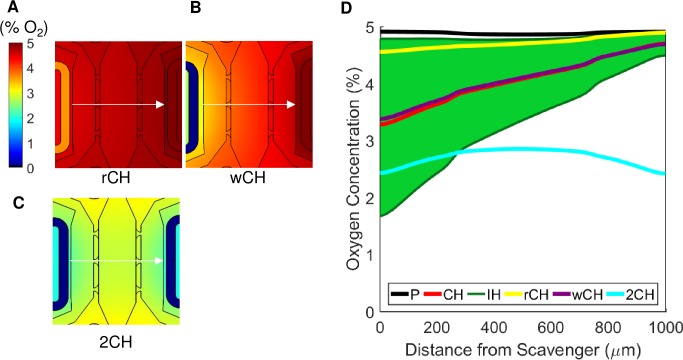
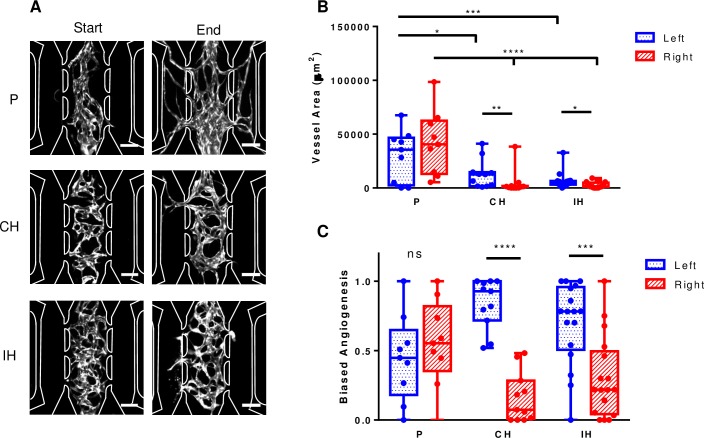
Microfluidic devices have been successfully used to recreate in vitro biological microenvironments, including disease states. However, one constant issue for replicating microenvironments is that atmospheric oxygen concentration (21% O2) does not mimic physiological values (often around 5% O2). We have created a microfluidic device that can control both the spatial and temporal variations in oxygen tensions that are characteristic of in vivo biology. Additionally, since the microcirculation is responsive to hypoxia, we used a 3D sprouting angiogenesis assay to confirm the biological relevance of the microfluidic platform. Our device consists of three parallel connected tissue chambers and an oxygen scavenger channel placed adjacent to these tissue chambers. Experimentally measured oxygen maps were constructed using phosphorescent lifetime imaging microscopy and compared with values from a computational model. The central chamber was loaded with endothelial and fibroblast cells to form a 3D vascular network. Four to six days later, fibroblasts were loaded into the side chambers, and a day later the oxygen scavenger (sodium sulfite) was flowed through the adjacent channel to induce a spatial and temporal oxygen gradient. Our results demonstrate that both constant chronic and intermittent hypoxia can bias vessel growth, with constant chronic hypoxia showing higher degrees of biased angiogenesis. Our simple design provides consistent control of spatial and temporal oxygen gradients in the tissue microenvironment and can be used to investigate important oxygen-dependent biological processes in conditions such as cancer and ischemic heart disease.


Conflict of interest statement

The authors have declared that no competing interests exist.

Figures

Fig 1
Fig 1. Microfluidic device schematic.
(A) The design of the microfluidic device with the central vascular chamber (yellow) and adjacent stromal chambers (brown). Scavenger channels (blue) are placed next to the stromal chambers and media lines (red) feed the vascular chamber. (B) Experimental setup for the microfluidic devices. A difference in hydrostatic pressure head between the inlet and outlet of each microfluidic line creates a drop in pressure between the two sides of the vascular chamber to induce convective interstitial flow throughout the device.
Fig 2
Fig 2. Microfluidic device characterization.
(A) Surface map of the steady pressure (Pa) distributions inside the microfluidic device. (B) Surface map of the fluid velocity (μm s-1) and streamlines. (C) FITC-dextran was introduced through the media lines to demonstrate the direction of flow through the device (bottom to top and central chamber to outside chambers). The image was taken 30 minutes after introducing the dye. Scale bar = 200 μm.
Fig 3
Fig 3. Finite element simulations and measurements of steady state oxygen tension.
(A-C, top row) Surface maps of theoretical oxygen tension in different conditions are shown. (A) Physioxia condition (P) with no oxygen scavenger, (B) constant chronic hypoxia condition (CH) with a constant flow of 0.35 M sodium sulfite flowing at 120 μl min-1, and (C) intermittent hypoxia (IH) condition of alternating 1 M sodium sulfite flowing at 120 μl min-1 for an hour (IHon, left panel) and no flow of oxygen scavenger for an hour (IHoff, right panel). (A-C, bottom) Experimental oxygen maps were constructed using a PhLIM technique for the P (A, bottom), CH (B, bottom), and IH (C, bottom) conditions. The IHon measurements were taken an hour after flowing sodium sulfite, and the IHoff measurements were taken an hour after stopping flow. (D) Temporal variations of the oxygen tension at a point in the left stromal chamber from the COMSOL model in (C, top). The asterisks (*) and circle (o) on the oxygen maps corresponds to the low and high points of the graph, respectively. (E) Comparing the oxygen profiles of all the varying conditions along the central line of the three chambers (arrow in A-C). The conditions are P (black), CH (red), IH (green). The IH case is represented by a green area to illustrate the range of oxygen profiles between the two extreme states of the condition. The solid lines are values from the COMSOL model, and the points are averages from the PhLIM measurements for the three conditions (n = 3 for each conditions).
Fig 4
Fig 4. Varying device parameters.
(A) Reduced mass flow rate condition (rCH) with 0.07 x 10⁻⁶ mol s-1 of sodium sulfite. (B) Increased wall distance (wCH) between the scavenger channel and stromal chamber to 60 μm. (C) Two active scavenger lines (2CH). (D) Comparing the oxygen profiles of all the varying conditions along the central line of the three chambers (arrow in A-C) with the experimental conditions from Fig 3. The conditions are P (black), CH (red), IH (green), rCH (yellow), wCH (purple), and 2CH (blue).
Fig 5
Fig 5. Biased angiogenesis due to hypoxia.
(A) Representative images from the P (top), CH (middle), and IH (bottom) conditions. In each category, images of the vascular network before (left) and after (right) the condition was applied is shown. (B) The total vessel area for each category in the left and right stromal chambers were measured and compared. For both hypoxic conditions, the vessel area in the left stromal chamber (closer to the scavenger channel) was significantly higher than the right chamber. (C) Biased angiogenesis was calculated for the left and right stromal chambers in each condition and compared to each other. Both hypoxic conditions had significantly more bias in the left stromal chamber. P, n = 8; CH, n = 11; IH, n = 17. Scale bar = 200μm * p < .05, ** p < .005, *** p < .0005, **** p < .0001.

References

    1. Carmeliet P, Jain RK. Angiogenesis in cancer and other diseases. Nature [Internet]. 2000. September 14;407(6801):249–57. Available from: http://www.nature.com/doifinder/10.1038/35025220 - DOI - PubMed
    1. Krock BL, Skuli N, Simon MC. Hypoxia-Induced Angiogenesis: Good and Evil. Genes Cancer [Internet]. 2011. December 1 [cited 2015 May 12];2(12):1117–33. Available from: http://www.ncbi.nlm.nih.gov/pmc/articles/PMC3411127/ 10.1177/1947601911423654 - DOI - PMC - PubMed
    1. Vaupel P, Mayer A, Höckel M. Tumor hypoxia and malignant progression. Semenza CK Sen L. G, editors. Methods Enzymol [Internet]. 2004. January [cited 2015 Jan 9];381:335–54. Available from: http://www.ncbi.nlm.nih.gov/pubmed/15063685 10.1016/S0076-6879(04)81023-1 - DOI - PubMed
    1. Goodall CM, Sanders AG, Shubik P. Studies of Vascular Patterns in Living Tumors With a Transparent Chamber Inserted in Hamster Cheek Pouch2. JNCI J Natl Cancer Inst [Internet]. 1965. September;35(3):497–521. Available from: https://academic.oup.com/jnci/article-lookup/doi/10.1093/jnci/35.3.497 - DOI - PubMed
    1. Semenza GL. Oxygen Sensing, Hypoxia-Inducible Factors, and Disease Pathophysiology. Annu Rev Pathol Mech Dis [Internet]. 2014. January 24;9(1):47–71. Available from: http://www.annualreviews.org/doi/10.1146/annurev-pathol-012513-104720 - DOI - PubMed

Publication types

MeSH terms