Differences in youngest-old, middle-old, and oldest-old patients who visit the emergency department
- PMID: 30571903
- PMCID: PMC6301865
- DOI: 10.15441/ceem.17.261
Differences in youngest-old, middle-old, and oldest-old patients who visit the emergency department
Abstract
Objective: As aging progresses, clinical characteristics of elderly patients in the emergency department (ED) vary by age. We aimed to study differences among elderly patients in the ED by age group.
Methods: For 2 years, patients aged 65 and older were enrolled in the study and classified into three groups: youngest-old, ages 65 to 74 years; middle-old, 75 to 84 years; and oldest-old, ≥85 years. Participants' sex, reason for ED visit, transfer from another hospital, results of treatment, type of admission, admission department and length of stay were recorded.
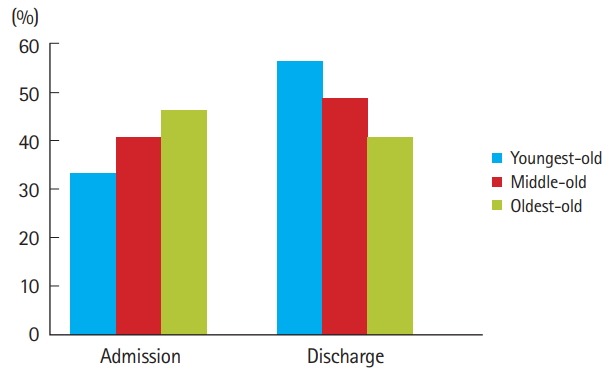
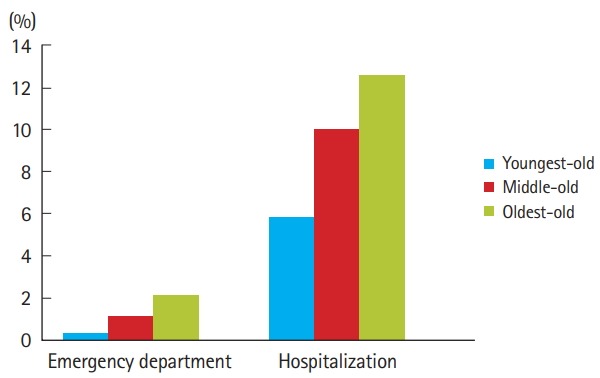
Results: During the study period, a total 64,287 patients visited the ED; 11,236 (17.5%) were aged 65 and older, of whom 14.4% were 85 and older. With increased age, the female ratio (51.5% vs. 54.9% vs. 69.1%, P<0.001), medical causes (79.5% vs. 81.3% vs. 81.7%, P=0.045), and admission rate (35.3% vs. 42.8% vs. 48.5%, P<0.001) increased. Admissions to internal medicine (57.5% vs. 59.3% vs. 64.7%, P<0.001) and orthopedic surgery (8.5% vs. 11.6% vs. 13.8%, P< 0.001) also increased. The ratio of admission to intensive care unit showed no statistical significance (P=0.545). Patients over age 85 years had longer stays in the ED (330.9 vs. 378.9 vs. 407.2 minutes, P<0.001), were discharged home less (84.4% vs. 78.9% vs. 71.5%, P<0.001), and died more frequently (6.3% vs. 10.4% vs. 13.0%, P<0.001).
Conclusion: With increased age, the proportion of female patients and medical causes increased. Rates of admission and death increased with age and older patients had longer ED and hospital stays.
Keywords: Admission; Aged; Emergency service, hospital; Outcome.
Conflict of interest statement
No potential conflict of interest relevant to this article was reported.
Figures
References
-
- Kim JJ, Kim J. A study of health care system housing and environment of the elderly. J Korea Inst Electron Commun Sci. 2012;7:925–30.
-
- Brocklehurst JC, Fillit HM, Rockwood K, Young J, Abdelhafiz AH. Brocklehurst’s textbook of geriatric medicine and gerontology. 8th ed. Philadelphia, PA: Elsevier; 2017.
-
- Korean Statistical Information Service . Annual report on age and gender population 2015 [Internet] Daejeon: Statistics Korea; [cited 2017 Jun 10]. Available from: http://kosis.kr/statisticsList.
-
- National Health Insurance Service . Symposium about elderly medical expenses 2016 [Internet] Wonju: National Health Insurance Service; 2015. [cited 2017 Jun 10]. Available from: http://www.nhis.or.kr/bbs7/boards/B0039/14883.
-
- Alterovitz SS, Mendelsohn GA. Relationship goals of middle-aged, young-old, and old-old Internet daters: an analysis of online personal ads. J Aging Stud. 2013;27:159–65. - PubMed
LinkOut - more resources
Full Text Sources
Research Materials