

Characterization of a Multiple-Scan-Rate Voltammetric Waveform for Real-Time Detection of Met-Enkephalin
- PMID: 30571911
- PMCID: PMC6473485
- DOI: 10.1021/acschemneuro.8b00351
Characterization of a Multiple-Scan-Rate Voltammetric Waveform for Real-Time Detection of Met-Enkephalin
Abstract
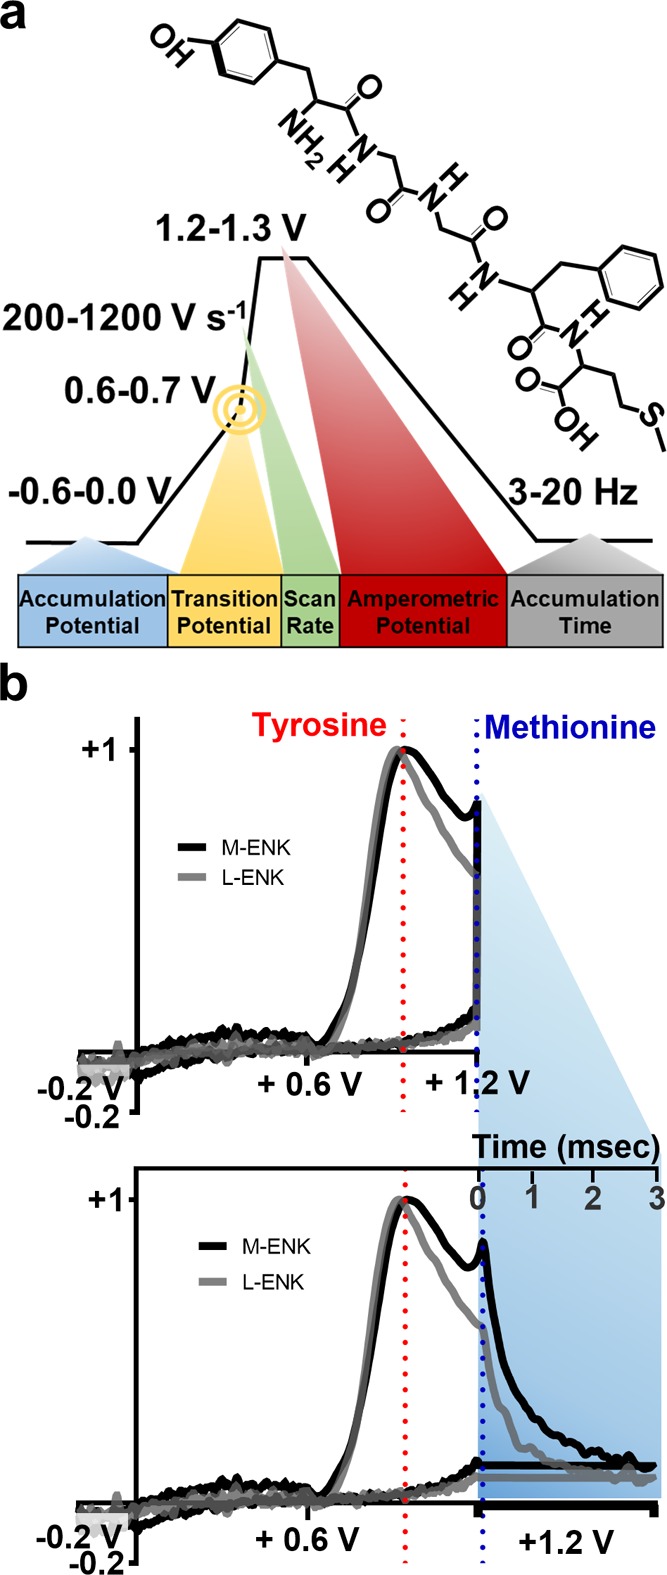
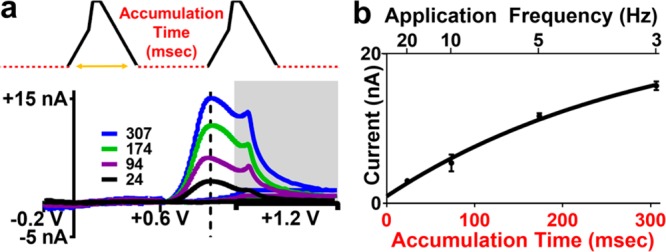
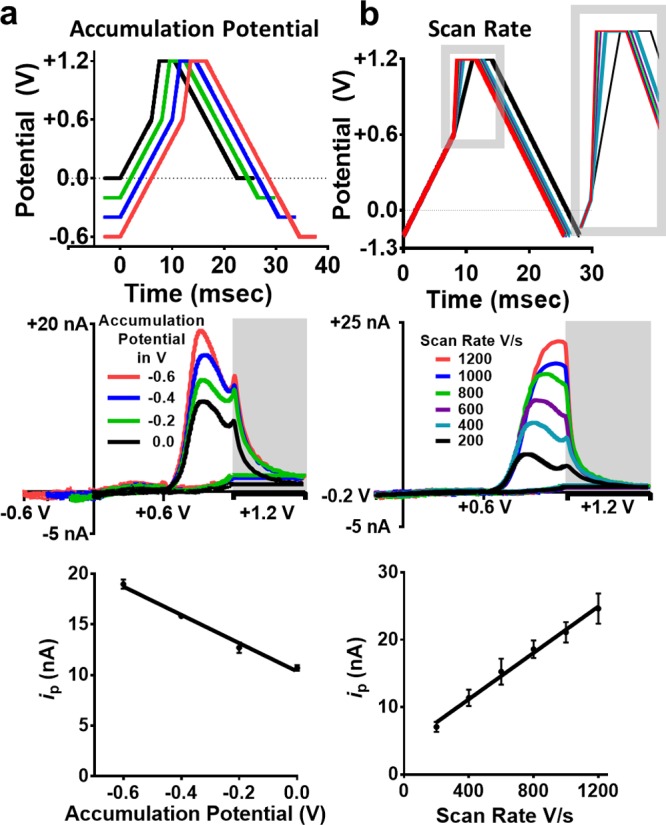
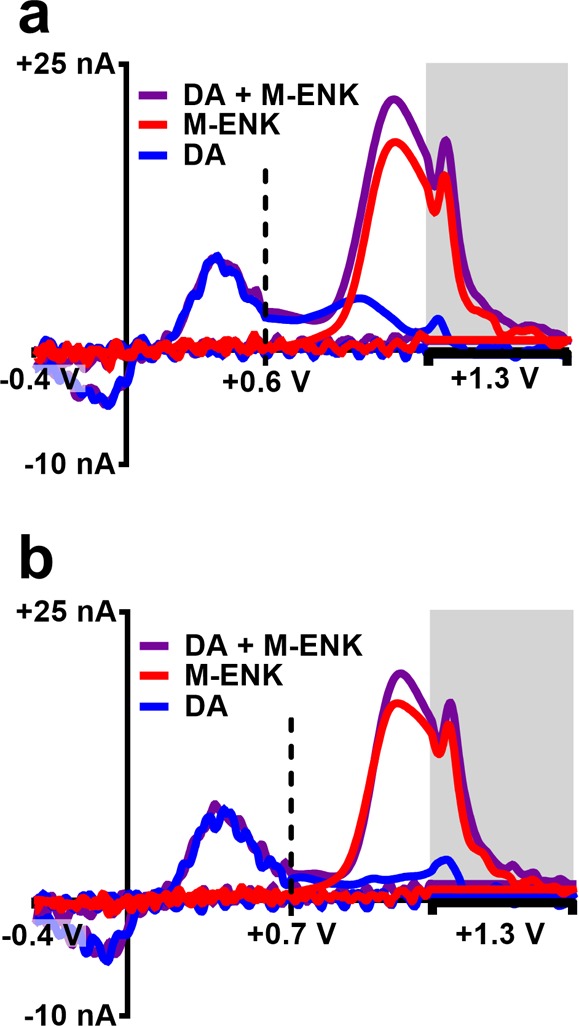
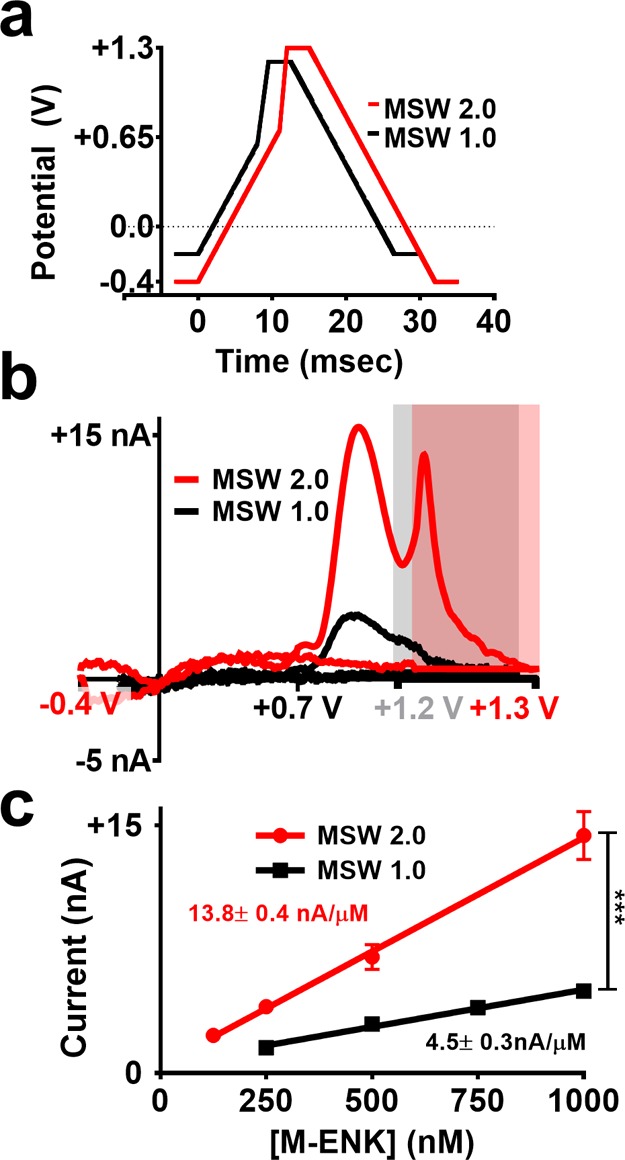
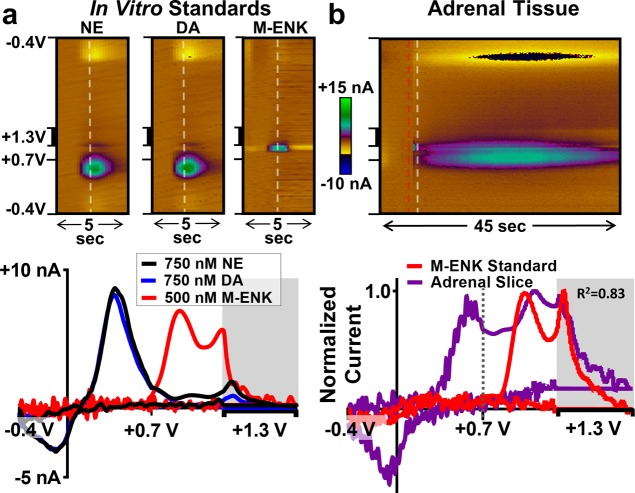
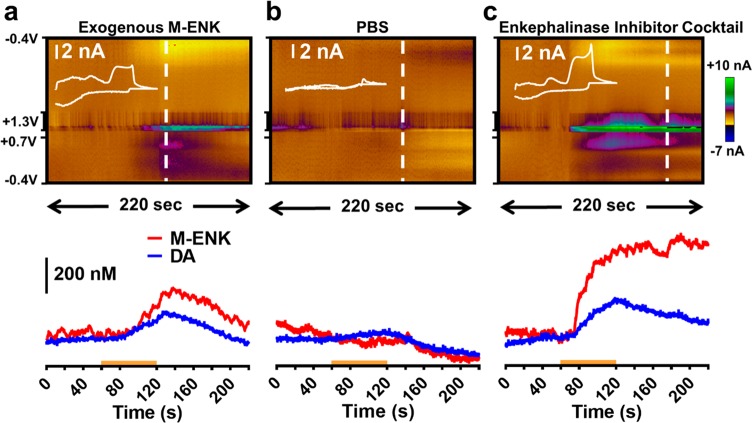
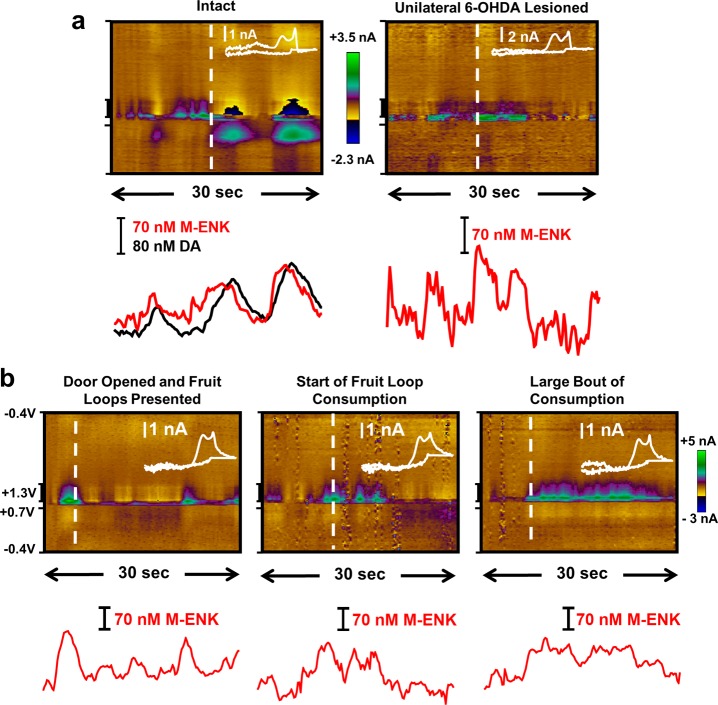
Opioid peptides are critically involved in a variety of physiological functions necessary for adaptation and survival, and as such, understanding the precise actions of endogenous opioid peptides will aid in identification of potential therapeutic strategies to treat a variety of disorders. However, few analytical tools are currently available that offer both the sensitivity and spatial resolution required to monitor peptidergic concentration fluctuations in situ on a time scale commensurate with that of neuronal communication. Our group has developed a multiple-scan-rate waveform to enable real-time voltammetric detection of tyrosine containing neuropeptides. Herein, we have evaluated the waveform parameters to increase sensitivity to methionine-enkephalin (M-ENK), an endogenous opioid neuropeptide implicated in pain, stress, and reward circuits. M-ENK dynamics were monitored in adrenal gland tissue, as well as in the dorsal striatum of anesthetized and freely behaving animals. The data reveal cofluctuations of catecholamine and M-ENK in both locations and provide measurements of M-ENK dynamics in the brain with subsecond temporal resolution. Importantly, this work also demonstrates how voltammetric waveforms can be customized to enhance detection of specific target analytes, broadly speaking.
Keywords: FSCV; carbon fiber; chromaffin cell; cyclic voltammetry; dopamine; microelectrode; opioid.
Conflict of interest statement
The authors declare no competing financial interest.
Figures

Similar articles
-
Multiple scan rate voltammetry for selective quantification of real-time enkephalin dynamics.Anal Chem. 2014 Aug 5;86(15):7806-12. doi: 10.1021/ac501725u. Epub 2014 Jul 17. Anal Chem. 2014. PMID: 24967837
-
Fabrication and Optimization of a Molecularly Imprinted Carbon Fiber Microelectrode for Selective Detection of Met-enkephalin Using Fast-Scan Cyclic Voltammetry.ACS Appl Mater Interfaces. 2024 Jun 12;16(23):29728-29736. doi: 10.1021/acsami.4c03093. Epub 2024 May 28. ACS Appl Mater Interfaces. 2024. PMID: 38804619
-
In vivo demonstration of a paracrine, inhibitory action of Met-enkephalin on adrenomedullary catecholamine release in the rat.Endocrinology. 1989 Aug;125(2):624-9. doi: 10.1210/endo-125-2-624. Endocrinology. 1989. PMID: 2752969
-
Morphologically heterogeneous met-enkephalin terminals form synapses with tyrosine hydroxylase-containing dendrites in the rat nucleus locus coeruleus.J Comp Neurol. 1995 Dec 18;363(3):423-38. doi: 10.1002/cne.903630307. J Comp Neurol. 1995. PMID: 8847409
-
Enkephalins, brain and immunity: modulation of immune responses by methionine-enkephalin injected into the cerebral cavity.Int J Neurosci. 1992 Nov-Dec;67(1-4):241-70. doi: 10.3109/00207459208994788. Int J Neurosci. 1992. PMID: 1305637 Review.
Cited by
-
Exploiting Microelectrode Geometry for Comprehensive Detection of Individual Exocytosis Events at Single Cells.ACS Sens. 2023 Aug 25;8(8):3187-3194. doi: 10.1021/acssensors.3c00884. Epub 2023 Aug 8. ACS Sens. 2023. PMID: 37552870 Free PMC article.
-
Tracking Carbon Microelectrode Impedance during Fast-Scan Cyclic Voltammetry.ACS Sens. 2025 May 23;10(5):3617-3627. doi: 10.1021/acssensors.5c00401. Epub 2025 May 9. ACS Sens. 2025. PMID: 40345216
-
Recent Advances in In Vivo Neurochemical Monitoring.Micromachines (Basel). 2021 Feb 18;12(2):208. doi: 10.3390/mi12020208. Micromachines (Basel). 2021. PMID: 33670703 Free PMC article. Review.
-
Modified Sawhorse Waveform for the Voltammetric Detection of Oxytocin.J Electrochem Soc. 2022 Jan;169:017512. doi: 10.1149/1945-7111/ac4aae. Epub 2022 Jan 21. J Electrochem Soc. 2022. PMID: 35185166 Free PMC article.
-
Fundamentals of fast-scan cyclic voltammetry for dopamine detection.Analyst. 2020 Feb 17;145(4):1158-1168. doi: 10.1039/c9an01586h. Analyst. 2020. PMID: 31922176 Free PMC article. Review.
References
Publication types
MeSH terms
Substances
Grants and funding
LinkOut - more resources
Full Text Sources
Miscellaneous
