. 2019 Apr;70(4):710-721.
doi: 10.1016/j.jhep.2018.11.034. Epub 2018 Dec 18.

Metformin modulates innate immune-mediated inflammation and early progression of NAFLD-associated hepatocellular carcinoma in zebrafish

Affiliations

Metformin modulates innate immune-mediated inflammation and early progression of NAFLD-associated hepatocellular carcinoma in zebrafish

Sofia de Oliveira et al. J Hepatol. 2019 Apr.

Abstract

Background & aims: Non-alcoholic fatty liver disease/non-alcoholic steatohepatitis (NAFLD/NASH) is an increasing clinical problem associated with progression to hepatocellular carcinoma (HCC). The effect of a high-fat diet on the early immune response in HCC is poorly understood, while the role of metformin in treating NAFLD and HCC remains controversial. Herein, we visualized the early immune responses in the liver and the effect of metformin on progression of HCC using optically transparent zebrafish.

Methods: We used live imaging to visualize liver inflammation and disease progression in a NAFLD/NASH-HCC zebrafish model. We combined a high-fat diet with a transgenic zebrafish HCC model induced by hepatocyte-specific activated beta-catenin and assessed liver size, angiogenesis, micronuclei formation and inflammation in the liver. In addition, we probed the effects of metformin on immune cell composition and early HCC progression.

Results: We found that a high-fat diet induced an increase in liver size, enhanced angiogenesis, micronuclei formation and neutrophil infiltration in the liver. Although macrophage number was not affected by diet, a high-fat diet induced changes in macrophage morphology and polarization with an increase in liver associated TNFα-positive macrophages. Treatment with metformin altered macrophage polarization, reduced liver size and reduced micronuclei formation in NAFLD/NASH-associated HCC larvae. Moreover, a high-fat diet reduced T cell density in the liver, which was reversed by treatment with metformin.

Conclusions: These findings suggest that diet alters macrophage polarization and exacerbates the liver inflammatory microenvironment and cancer progression in a zebrafish model of NAFLD/NASH-associated HCC. Metformin specifically affects the progression induced by diet and modulates the immune response by affecting macrophage polarization and T cell infiltration, suggesting possible effects of metformin on tumor surveillance.

Lay summary: This paper reports a new zebrafish model that can be used to study the effects of diet on liver cancer. We found that a high-fat diet promotes non-resolving inflammation in the liver and enhances cancer progression. In addition, we found that metformin, a drug used to treat diabetes, inhibits high-fat diet-induced cancer progression in this model, by reducing diet-induced non-resolving inflammation and potentially restoring tumor surveillance.

Keywords: High-fat diet; Liver cancer; Metformin; NAFLD-associated HCC; NAFLD/NASH; Zebrafish model.


Conflict of interest statement

Disclosures: The authors disclose no conflicts.

Figures

Figure 1:
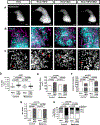
Figure 1:. Angiogenesis and changes in cell and nuclear morphology are induced by both high fat diet and HCC
(A, B) Representative 3D reconstructions of liver with blood vessels (A) or blood vessels alone (B) in control, HCC and HFD 13-day old larvae. (C) Graph showing liver volume in control, HCC and HFD larvae (Control= 15, HCC=27, HFD=26). (D) Graph showing vessel density index by liver volume in control, HCC and HFD larvae (Control= 15, HCC=27, HFD=26). Scale bar= 40μm. (E, F) Representative images of F-actin (E) and hepatocyte nuclei (F) in control, HCC and HFD larvae. In HCC: white arrow shows trinucleated cell; open arrowhead shows enlarged nuclei; white arrowhead shows nucleus with altered shape; red arrowhead shows micronuclei. In HFD: dashed arrowhead shows hepatocyte displaced nuclei toward the cell edge. (G-J) Graphs showing averages of cell and nuclear parameters in control, HCC and HFD 13-day old larvae. (G) Hepatocyte area. (H) Nuclear area. (I) Nuclear circularity. (J) Nuclear:Cytoplasm ratio. Measures were done in hepatocytes of control, HCC and HFD larvae (15–30 cells/ larvae; C N=8, HCC N= 8, HFD=11). (K) Chi-square graphs showing percentage of larvae with different scoring of Micronuclei and Nuclear herniation (C N=16, HCC N=23, HFD=23). Scale bar 5μm. All data are from at least three independent experimental replicates. LS-Means analysis in R, was performed in all data with exception of micronuclei scoring (K) that was analyzed with Chi-square test. Dot plots and Bar plots show mean ±SEM, significant p values are shown in each graph.
Figure 2:
Figure 2:. High fat diet and HCC alone induce innate immune cell recruitment to the liver
(A-C) Representative 3D reconstructions of liver and leukocyte recruitment to liver area of control, HCC and HFD 13-day old larvae. (D) Graphs showing macrophage density in liver area in control, HCC and and HFD larvae (C N=30, HCC N= 43, HFD=30). (E) Graph showing ratio of round macrophages over total macrophages at liver area (Control= 10, HCC N= 11, HFD N= 14). (F) Graph showing neutrophil density in liver area in control, HCC and HFD larvae (C N=28, HCC N= 30, HFD=31). Scale bar= 40μm. All data plotted comprise at least three independent experimental replicates. LS-Means analysis in R was performed in all data. Dot plots show mean ±SEM, significant p values are shown in each graph.
Figure 3:
Figure 3:. High fat diet enhances progression in HCC
(A, B) Representative 3D reconstructions of livers and vessels in liver of 13-day old HCC and HCC+HFD larvae. Scale bar= 40μm. (C, D) Graphs showing liver surface area (C) and liver volume (D). (E, F) Graphs showing vessel density index by liver area (E) and vessel density index by liver volume (F) in HCC and HCC+HFD larvae (HCC N=27, HCC+HFD N= 20). (G, H) Representative 3D reconstructions of F-actin and hepatocyte nuclei in liver of in HCC and HCC+HFD larvae. Scale bar 5μm. Open arrowheads show enlarged nuclei; white arrowheads show nucleus with altered shape; and red arrows show micronuclei and nuclear herniation. Scale bar 5μm. (I-L) Graphs showing averages of cell and nuclear parameters in HCC and HCC+HFD 13-day old larvae. (I) Hepatocytes area. (J) Nuclear circularity. (K) Nuclear:Cytoplasm ratio. Measures were done in hepatocytes of HCC and HCC+HFD larvae (15–30 cells/ larvae; HCC N= 19, HCC+HFD N= 30). (L) Chi-square graphs showing percentage of larvae with different scoring of Micronuclei and Nuclear herniation (HCC N=23, HCC+HFD N=37). (M) Representative 3D reconstructions of liver and Active Caspase 3 in HCC and HCC+HFD larvae. Scale bar= 40μm. (N) Graph showing active-caspase 3 positive cells density in liver in HCC and HCC+HFD larvae (HCC N=26, HCC+HFD N= 28). Scale bar= 40μm. (O) Representative 3D reconstructions of liver and EDU in HCC and HCC+HFD larvae. (P) Graph showing EDU positive cells density in liver in HCC and HCC+HFD larvae (HCC N=18, HCC+HFD N= 29). All data are from at least three independent experimental replicates. LS-Means analysis in R, was performed in all data with exception of micronuclei scoring (L) that was analyzed with Chi-square test. Dot plots and Bar plots show mean ±SEM, significant p values are shown in each graph.
Figure 4:
Figure 4:. HFD alters the innate and adaptive immune responses in zebrafish NASH-associated HCC
(A-C) Representative 3D reconstructions of livers and leukocyte recruitment to liver area in 13-day old HCC and HCC+HFD larvae. (D) Graph showing macrophage density in liver area in HCC and HCC+HFD larvae (HCC N=43, HCC+HFD N= 40). (E) Graph showing ratio of round macrophages over total macrophages at liver area (HCC N= 11, HCC+HFD N= 13). (F) Graph showing neutrophil density in HCC and HCC+HFD larvae (HCC N=28, HCC+HFD N= 28). (G) Representative 3D reconstructions of T cell recruitment to liver area in HCC and HCC+HFD larvae. (H) Graph showing T cell density in liver area in HCC and HCC+HFD larvae (HCC N=14, HCC+HFD N= 32). Scale bar= 40μm. All data plotted comprise at least three independent experimental replicates. LS-Means analysis in R was performed in all data. Dot plots show mean ±SEM, significant p values are shown in each graph.
Figure 5:
Figure 5:. HFD induces macrophage polarization in NASH-associated HCC zebrafish
(A-C) Representative 3D reconstructions of macrophages and TNFα expressing cells in liver area of 13-day old in HCC and HCC+HFD larvae. Yellow arrows show TNFα-positive macrophages. (D) Graph showing ratio of TNFα-positive macrophages over total macrophage number at liver area in HCC and HCC+HFD larvae (HCC N= 13, HCC+HFD N= 19). Scale bar= 40μm. (E) Representative images of livers of HCC and HCC+HFD larvae treated with DMSO or metronidazole (MTZ). Scale bar= 500μm. (F) Graph showing liver area in HCC and HCC+HFD larvae treated with DMSO or MTZ (HCC-DMSO N= 30, HCC+HFD-DMSO N= 41, HCC-MTZ N= 20, HCC+HFD-MTZ N= 23). All data plotted comprise at least three independent experimental replicates. LS-Means analysis in R was performed in all data, with Tukey method when comparing more than two conditions. Dot plots show mean ±SEM, significant p values are shown in each graph.
Figure 6:
Figure 6:. Metformin rescues the effect of HFD on HCC progression
(A) Representative 3D reconstructions of livers in HCC and HCC+HFD larvae with or without metformin treatment. Scale bar= 40μm. (B, C) Representative 3D reconstructions of F-actin and hepatocyte nuclei in liver of in HCC and HCC+HFD larvae. Scale bar 5μm. Open arrowheads show enlarged nuclei; white arrowheads show nucleus with altered shape; and red arrows show micronuclei and nuclear herniation. Scale bar 5μm. (D) Graph showing liver area of HCC and HCC+HFD larvae with or without metformin treatment (HCC N= 22, HCC+HFD N= 27, HCC-Met N= 36, HCC+HFD-Met N= 46). (E-F) Graphs showing averages of cell and nuclear parameters in HCC and HCC+HFD 13-day old larvae with or without metformin treatment. (E) Hepatocyte area. (F) Nuclear circularity. (G) Nuclear:Cytoplasm ratio. Measures were done in hepatocytes of HCC and HCC+HFD larvae (15–30 cells/ larvae; HCC N= 12, HCC+HFD N= 19, HCC-Met N= 12, HCC+HFD-Met N= 12). (L) Chi-square graph showing percentage of larvae with different scoring of Micronuclei and Nuclear herniation (HCC N= 18, HCC+HFD N= 34, HCC-Met N= 25, HCC+HFD-Met N= 29). All data plotted comprise at least three independent experimental replicates. LS-Means analysis with Tukey method in R was performed in all data, with exception of micronuclei scoring (L) analyzed with a Chi-square test. Plots show mean ±SEM, significant p values are shown in each graph.
Figure 7:
Figure 7:. Metformin rescues diet enhanced angiogenesis, steatosis, apoptosis and proliferation in NASH-associated HCC larvae
(A) Representative 3D reconstructions of livers in HCC and HCC+HFD larvae treated with metformin or control. (B) Graph showing vessel density index by liver volume in HCC and HCC+HFD larvae with metformin or control (HCC N=12, HCC+HFD N=20, HCC+HFD+Met=20). (C) Representative images of livers stained with Oil Red; HCC and HCC+HFD larvae treated with metformin or control. (D) Chi-square graph showing percentage of larvae with different scoring of liver steatosis (HCC N= 30, HCC+HFD N= 38, HCC+HFD-Met N= 30). (E) Representative 3D reconstructions of liver and Active Caspase 3 in HCC and HCC+HFD larvae treated with metformin or control. (F) Graph showing active-caspase 3 positive cells density in liver in HCC and HCC+HFD larvae treated with metformin or control (HCC N=28, HCC+HFD N= 28, HCC+HFD+Met=33). (G) Representative 3D reconstructions of liver and EDU in HCC and HCC+HFD larvae treated with metformin or control. (H) Graph showing EDU positive cells density in liver in HCC and HCC+HFD larvae treated with metformin or control (HCC N=18, HCC+HFD N= 29, HCC+HFD+Met=22). Scale bar= 40μm. All data are from at least three independent experimental replicates. LS-Means analysis with Tukey method in R was performed in all data, with exception of steatosis scoring (D) analyzed with a Chi-square test. Dot plots show mean ±SEM, significant p values are shown in each graph.
Figure 8:
Figure 8:. Metformin reduces diet-enhanced inflammation and rescues T Cell infiltration in HCC larvae.
(A) Representative 3D reconstructions of TNFα cells in livers from HCC and HCC+HFD larvae larvae treated with metformin or control. (B) Graph showing TNFα positive cell density in livers of HCC and HCC+HFD larvae treated with metformin or control (HCC N= 25, HCC+HFD N= 20, HCC+HFD-Met N= 30). (C) Representative 3D reconstructions of neuthrophil recruitment in livers from HCC and HCC+HFD larvae larvae treated with metformin or control. (D) Graph showing neutrophil density in livers of HCC and HCC+HFD larvae treated with metformin or control (HCC N= 23, HCC+HFD N= 37, HCC+HFD-Met N= 28). (E) Representative 3D reconstructions of T cell recruitment in livers from HCC and HCC+HFD larvae treated with metformin or control. (F) Graph showing T cell density in livers of HCC and HCC+HFD larvae treated with metformin or control (HCC N= 23, HCC+HFD N= 51, HCC+HFD-Met N= 34). Scale bar= 40μm. All data plotted comprise at least three independent experimental replicates. LS-Means analysis with Tukey method in R was performed in all data. Dot plots show mean ±SEM, significant p values are shown in each graph.

Similar articles

Cited by

References

    1. Estes C, Razavi H, Loomba R, et al. Modeling the epidemic of nonalcoholic fatty liver disease demonstrates an exponential increase in burden of disease. Hepatology 2018;67:123–133. - PMC - PubMed
    1. El-Serag HB. Hepatocellular carcinoma. N Engl J Med 2011;365:1118–27. - PubMed
    1. El-Serag HB, Kanwal F. Epidemiology of hepatocellular carcinoma in the United States: where are we? Where do we go? Hepatology 2014;60:1767–75. - PMC - PubMed
    1. Pocha C, Kolly P, Dufour JF. Nonalcoholic Fatty Liver Disease-Related Hepatocellular Carcinoma: A Problem of Growing Magnitude. Semin Liver Dis 2015;35:304–17. - PubMed
    1. Mantovani A, Targher G. Type 2 diabetes mellitus and risk of hepatocellular carcinoma: spotlight on nonalcoholic fatty liver disease. Ann Transl Med 2017;5:270. - PMC - PubMed

Publication types

MeSH terms

LinkOut - more resources