Review
. 2019 Mar:188:539-556.
doi: 10.1016/j.neuroimage.2018.12.022. Epub 2018 Dec 17.

Toward a comprehensive understanding of the neural mechanisms of decoded neurofeedback

Affiliations
Review

Toward a comprehensive understanding of the neural mechanisms of decoded neurofeedback

Kazuhisa Shibata et al. Neuroimage. 2019 Mar.

Abstract

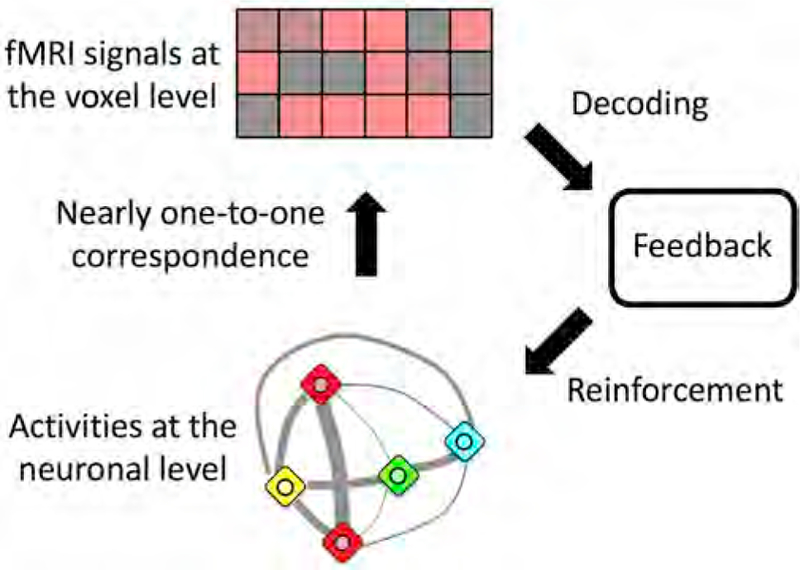
Real-time functional magnetic resonance imaging (fMRI) neurofeedback is an experimental framework in which fMRI signals are presented to participants in a real-time manner to change their behaviors. Changes in behaviors after real-time fMRI neurofeedback are postulated to be caused by neural plasticity driven by the induction of specific targeted activities at the neuronal level (targeted neural plasticity model). However, some research groups argued that behavioral changes in conventional real-time fMRI neurofeedback studies are explained by alternative accounts, including the placebo effect and physiological artifacts. Recently, decoded neurofeedback (DecNef) has been developed as a result of adapting new technological advancements, including implicit neurofeedback and fMRI multivariate analyses. DecNef provides strong evidence for the targeted neural plasticity model while refuting the abovementioned alternative accounts. In this review, we first discuss how DecNef refutes the alternative accounts. Second, we propose a model that shows how targeted neural plasticity occurs at the neuronal level during DecNef training. Finally, we discuss computational and empirical evidence that supports the model. Clarification of the neural mechanisms of DecNef would lead to the development of more advanced fMRI neurofeedback methods that may serve as powerful tools for both basic and clinical research.

Keywords: Decoded neurofeedback (DecNef); Functional magnetic resonance imaging (fMRI).


Conflict of interest statement

Declaration of interest

A potential financial conflict of interest exists; the authors are the inventors of patents related to the decoded neurofeedback method discussed in this article, while the original assignee of the patents is ATR, with which the authors are affiliated.

Figures

Fig. A.1.
Fig. A.1.. Representative time course of a trial during DecNef training.
In the induction period, participants were asked to regulate their brain activities. During the fixation period and intertrial interval (ITI), participants were asked to fixate on the center of the display. In the feedback period, participants were presented with a feedback disk. See the original articles for detailed descriptions of the experiments. (A) Representative time course used in the study by Shibata et al., in 2011. (B) Representative time course used in the studies by Amano et al., in 2016 and Koizumi et al., in 2016. (C) Representative time course employed in the 2016 study by Shibata et al. (D) Representative time course employed in the study by Cortese et al., in 2016.1
Fig. A.2.
Fig. A.2.. Relationships between variance accounted for (VAF) and numbers of principal components (PCs) for individual participants in Shibata et al. (2011).
Each panel represents one participant. Red and blue lines represent results from the PCA in the induction and decoder construction (DC) stages, respectively. Magenta lines show results from the PCA in which transformation loadings were computed from fMRI data in the DC stage and VAF was calculated from fMRI data obtained from the entire period of the induction stage (DC → Induction PCA).2
Fig. 1.
Fig. 1.. Possible mechanisms by which DecNef induces changes in a target behavior.
In the targeted neural plasticity model (red arrows), the induction of specific target activities at the neuronal level by DecNef drives neural plasticity in a target region that is manifested as changes in a target behavior. In alternative accounts (blue arrows), various cognitive factors and physiological artifacts lead to changes in neuronal activities outside the target activities during fMRI neurofeedback training. In this case, changes in behaviors, if any, are not attributed merely to neural plasticity driven by induction of the targeted activities at the neuronal level in the target region. See also Table 1 for a detailed list of these alternative accounts.
Fig. 2.
Fig. 2.
Schematic of the proposed model of targeted neural plasticity through DecNef.
Fig. 3.
Fig. 3.. Results of the GLM analysis of datasets obtained from DecNef studies.
(A) Responses to the feedback disk during DecNef training. In the colored voxels, fMRI signal amplitudes in response to the disk were significantly correlated with the size of the disk (two-tailed one-sample t-test, P < 0.05 after Bonferroni correction; see Appendix B for details of the analysis). (B) Activation observed during the induction period in which participants were asked to regulate brain activation. The colored voxels showed significant increases in the fMRI signal amplitude during the induction period (two-tailed one-sample t-test, P < 0.05 after Bonferroni correction).
Fig. 4.
Fig. 4.. PCA results.
(A) Results from an analysis of the data reported by Shibata et al., in 2011 in which the early visual cortex (V1 and V2) was targeted. (B) Results from an analysis of the data reported by Amano et al., in 2016 in which the early visual cortex (V1 and V2) was targeted. (C) Results from an analysis of the data reported by Koizumi et al., in 2016 in which the early visual cortex (V1 and V2) was targeted. (D) Results from an analysis of the data reported by Shibata et al., in 2016 in which the cingulate cortex was targeted. (E) Results from an analysis of the data reported by Cortese et al., in 2016 in which the parietal and frontal cortices were targeted. (F) Summary of the five studies. The red and blue bars represent the results of the induction and decoder construction (DC) stages, respectively. The magenta bars show the results of the PCA in which transformation loadings were computed from fMRI data in the DC stage and proportions of PCs accounting for 80% of the variance (PC80%) were calculated from fMRI data obtained from the entire period of the induction stage (DC → Induction PCA). The results of the DC → Induction PCA indicate that if PC80% is significantly less than 80%, fMRI signal patterns in the Induction stage contain subcomponents of fMRI signal patterns in the DC stage. In all PCAs for each study, PC80% was significantly less than 80% (two-tailed one-sample t-test, P < 10–4). Black lines in the box plots represent median values. Areas with darker colors indicate 95% confidence intervals and areas with lighter colors indicate 1 SD. Gray dots show individual data points.
Fig. 5.
Fig. 5.. PCA results across the 10 training days.
(A) The results of the Induction → decoder construction (DC) PCA for each of the 10 days during DecNef training in the study by Shibata et al. published in 2011. Transformation loadings were computed based on fMRI data obtained from each of the 10 days during the induction stage, and the transformation loadings were applied to fMRI data in the DC stage. No significant change in the proportions of PCs accounting for 80% of the variance (PC80%) was found. (B) The results of the DC → Induction PCA. A trend toward a decrease in PC80% on Day 10 was observed compared to Day 1 (one-tailed paired t-test, P = 0.056). (C) An additional analysis of data shown in (B). The PCs included in PC80% were classified into top and bottom halves according to contributions to orientation decoding (see the text for details). A significant increase in the variance accounted for (VAF) by the top-half PCs was observed on Day 10 compared to Day 1 (green; one-tailed paired t-test, P = 0.037). The exact opposite change was observed in VAF by the bottom-half PCs (black). This opposite change occurred because a total VAF by the top- and bottom-half PCs should always be 80%. Shaded areas represent SEM.
Fig. 6.
Fig. 6.. The results of the PCA based on the complementary method (VAF by the top 10% of PCs).
(A) Results from an analysis of the data reported by Shibata et al., in 2011 in which the early visual cortex (V1 and V2) was targeted. (B) Results from an analysis of the data reported by Amano et al., in 2016 in which the early visual cortex (V1 and V2) was targeted. (C) Results from an analysis of the data reported by Koizumi et al., in 2016 in which the early visual cortex (V1 and V2) was targeted. (D) Results from an analysis of the data reported by Shibata et al., in 2016 in which the cingulate cortex was targeted. (E) Results from an analysis of the data reported by Cortese et al., in 2016 in which the parietal and frontal cortices were targeted. (F) Summary of the five studies. The red and blue bars represent the results of the induction and decoder construction (DC) stages, respectively. The magenta bars show the results of the PCA in which transformation loadings were computed from fMRI data in the DC stage and VAF by the top 10% of PCs was calculated from fMRI data obtained from the entire period of the induction stage (DC → Induction PCA). The results of the DC → Induction PCA indicate that if the VAF by the top 10% of PCs is significantly greater than 10%, fMRI signal patterns in the Induction stage contain subcomponents of fMRI signal patterns in the DC stage. In all PCAs for each study, VAF by the top 10% of PCs was significantly greater than 10% (two-tailed one-sample t-test, P < 10–5). Black lines in the box plots represent median values. Areas with darker colors indicate 95% confidence intervals and areas with lighter colors indicate 1 SD. Gray dots show individual data points.
Fig. 7.
Fig. 7.. PCA results calculated across 10 training days based on the complementary method (VAF by the top 10% of PCs).
(A) The results of the Induction → decoder construction (DC) PCA for each of the 10 days during DecNef training in the study by Shibata et al. reported in 2011. Transformation loadings were computed based on fMRI data obtained from each of 10 days during the induction stage, and the transformation loadings were applied to fMRI data in the DC stage. No significant change in VAF by the top 10% of PCs was observed. (B) The results of the DC → Induction PCA. A trend toward an increase in VAF by the top 10% of PCs was observed on Day 10 compared to Day 1 (one-tailed paired t-test, P = 0.055). (C) An additional analysis of the data shown in (B). The top 10% of PCs were classified into top and bottom halves according to contributions to orientation decoding (see text for details). A significant increase in VAF by the top-half PCs was observed on Day 10 compared to Day 1 (green; one-tailed paired t-test, P = 0.033). No significant change in VAF by the bottom-half PCs (black) was identified. Shaded areas represent SEM.
Fig. 8.
Fig. 8.. Comparison of fMRI signal qualities.
(A) Mean absolute z-scores across voxels for the induction and decoder construction (DC) stages. No significant difference was observed between values (two-tailed paired t-test, P = 0.662). Black lines in the box plots represent median values. Areas with darker colors indicate 95% confidence intervals and areas with lighter colors indicate 1 SD. Gray dots show individual data points. (B). Mean absolute z-scores across voxels on each day of the induction stage. No significant difference was observed between Day 1 and Day 10 (two-tailed paired t-test, P = 0.638). Shaded areas represent SEM.
Fig. 9.
Fig. 9.. Schematic of the structure of the neural network simulation.
See the text and Appendix D for details.
Fig. 10.
Fig. 10.. The results of the neural network simulation.
Each line shows a probability distribution of the likelihood that the activities of neurons in the neuronal-level layer with random initial values converged to activities corresponding to different orientations before (blue) and after (red) DecNef training. The simulation was repeated 10 times with slightly different initial parameters to account for the diversity of 10 participants in the original study (Shibata et al., 2011). Shaded areas represent SEM. See Appendix D.4 for details.
Fig. 11.
Fig. 11.. Results of the DC → Induction PCA on fMRI data obtained from a baseline period.
No significant difference in the proportions of PCs accounting for 80% of the variance was observed between Day 1 and Day 10 (one-tailed paired t-test, P = 0.149). Shaded areas represent SEM.

Similar articles

Cited by

References

    1. Abbott DF, Opdam HI, Briellmann RS, Jackson GD, 2005. Brief breath holding may confound functional magnetic resonance imaging studies. Hum. Brain Mapp 24, 284–290. - PMC - PubMed
    1. Amano K, Shibata K, Kawato M, Sasaki Y, Watanabe T, 2016. Learning to associate orientation with color in early visual areas by associative decoded fMRI neurofeedback. Curr. Biol 26, 1861–1866. - PMC - PubMed
    1. Behrens TE, Woolrich MW, Walton ME, Rushworth MF, 2007. Learning the value of information in an uncertain world. Nat. Neurosci 10, 1214–1221. - PubMed
    1. Behroozi M, Daliri MR, Boyaci H, 2011. Statistical analysis methods for the fMRI data. Basic Clin. Neurosci 2, 67–74.
    1. Berkes P, Orban G, Lengyel M, Fiser J, 2011. Spontaneous cortical activity reveals hallmarks of an optimal internal model of the environment. Science 331, 83–87. - PMC - PubMed

Publication types