

Correlation Analysis to Identify the Effective Data in Machine Learning: Prediction of Depressive Disorder and Emotion States
- PMID: 30572595
- PMCID: PMC6313491
- DOI: 10.3390/ijerph15122907
Correlation Analysis to Identify the Effective Data in Machine Learning: Prediction of Depressive Disorder and Emotion States
Abstract
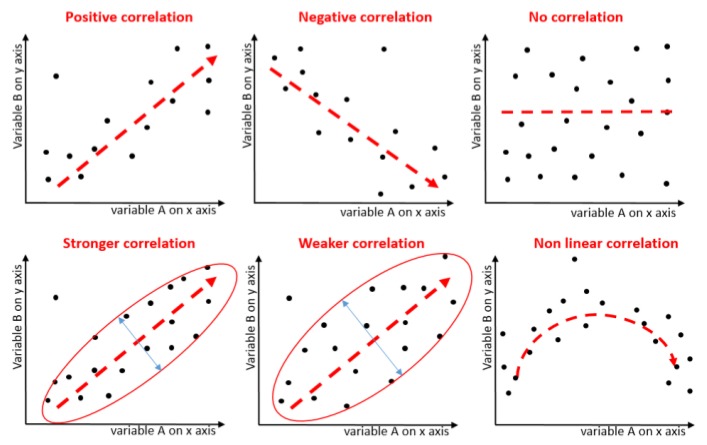
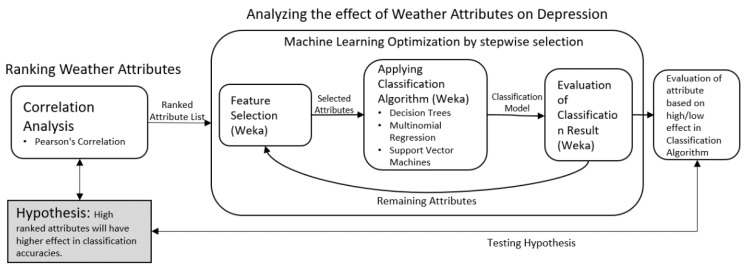
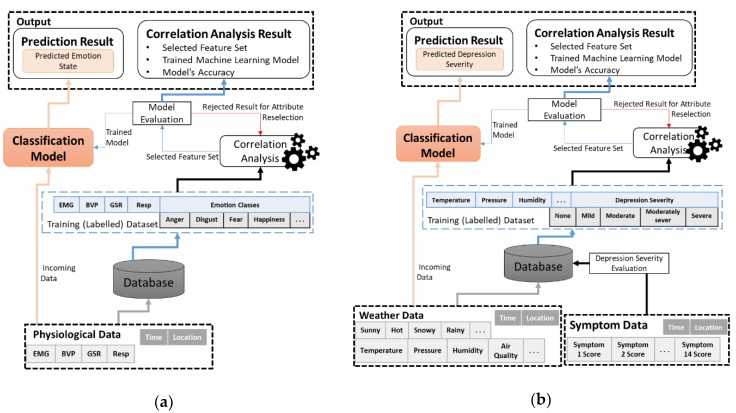
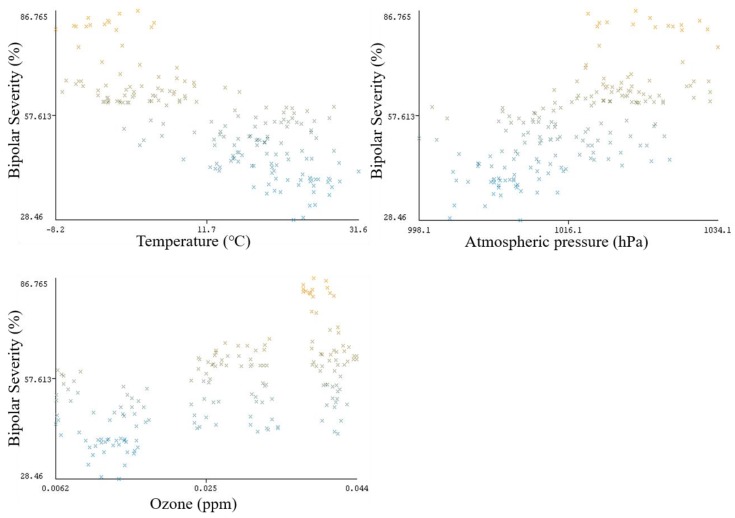
Correlation analysis is an extensively used technique that identifies interesting relationships in data. These relationships help us realize the relevance of attributes with respect to the target class to be predicted. This study has exploited correlation analysis and machine learning-based approaches to identify relevant attributes in the dataset which have a significant impact on classifying a patient's mental health status. For mental health situations, correlation analysis has been performed in Weka, which involves a dataset of depressive disorder symptoms and situations based on weather conditions, as well as emotion classification based on physiological sensor readings. Pearson's product moment correlation and other different classification algorithms have been utilized for this analysis. The results show interesting correlations in weather attributes for bipolar patients, as well as in features extracted from physiological data for emotional states.
Keywords: correlation analysis; data analytics; health care; machine learning.
Conflict of interest statement
The authors declare no conflict of interest.
Figures
Similar articles
-
Machine learning models in breast cancer survival prediction.Technol Health Care. 2016;24(1):31-42. doi: 10.3233/THC-151071. Technol Health Care. 2016. PMID: 26409558
-
Fetal health status prediction based on maternal clinical history using machine learning techniques.Comput Methods Programs Biomed. 2018 Sep;163:87-100. doi: 10.1016/j.cmpb.2018.06.010. Epub 2018 Jun 14. Comput Methods Programs Biomed. 2018. PMID: 30119860
-
Applications of machine learning algorithms to predict therapeutic outcomes in depression: A meta-analysis and systematic review.J Affect Disord. 2018 Dec 1;241:519-532. doi: 10.1016/j.jad.2018.08.073. Epub 2018 Aug 14. J Affect Disord. 2018. PMID: 30153635
-
A decision tree-based approach for determining low bone mineral density in inflammatory bowel disease using WEKA software.Eur J Gastroenterol Hepatol. 2007 Dec;19(12):1075-81. doi: 10.1097/MEG.0b013e3282202bb8. Eur J Gastroenterol Hepatol. 2007. PMID: 17998832
-
Predictive analytics and machine learning in stroke and neurovascular medicine.Neurol Res. 2019 Aug;41(8):681-690. doi: 10.1080/01616412.2019.1609159. Epub 2019 Apr 30. Neurol Res. 2019. PMID: 31038007 Review.
Cited by
-
A multi-criteria decision-making (MCDM) approach for data-driven distance learning recommendations.Educ Inf Technol (Dordr). 2023 Jan 26:1-38. doi: 10.1007/s10639-023-11589-9. Online ahead of print. Educ Inf Technol (Dordr). 2023. PMID: 36718426 Free PMC article.
-
Skin-Interfaced Wearable Sweat Sensors for Precision Medicine.Chem Rev. 2023 Apr 26;123(8):5049-5138. doi: 10.1021/acs.chemrev.2c00823. Epub 2023 Mar 27. Chem Rev. 2023. PMID: 36971504 Free PMC article. Review.
-
Machine Learning-Based Microclimate Model for Indoor Air Temperature and Relative Humidity Prediction in a Swine Building.Animals (Basel). 2021 Jan 18;11(1):222. doi: 10.3390/ani11010222. Animals (Basel). 2021. PMID: 33477540 Free PMC article.
-
Recent Techniques in Determining the Effects of Climate Change on Depressive Patients: A Systematic Review.J Environ Public Health. 2022 Aug 8;2022:1803401. doi: 10.1155/2022/1803401. eCollection 2022. J Environ Public Health. 2022. PMID: 35978588 Free PMC article.
-
Machine-Learning-Based Identification of Key Feature RNA-Signature Linked to Diagnosis of Hepatocellular Carcinoma.J Clin Exp Hepatol. 2024 Nov-Dec;14(6):101456. doi: 10.1016/j.jceh.2024.101456. Epub 2024 Jun 14. J Clin Exp Hepatol. 2024. PMID: 39055616
References
-
- Han J., Kamber M. Data Mining: Concepts and Techniques. 2nd ed. University of Illinois at Urbana-Champaign; Champaign, IL, USA: 2006.
-
- Bauman A.E., Sallis J.F., Dzewaltowski D.A., Owen N. Toward a better understanding of the influences on physical activity: The role of determinants, correlates, causal variables, mediators, moderators, and confounders. Am. J. Prev. Med. 2002;23:5–14. doi: 10.1016/S0749-3797(02)00469-5. - DOI - PubMed
Publication types
MeSH terms
LinkOut - more resources
Full Text Sources
