. 2018 Dec 19;23(12):3374.
doi: 10.3390/molecules23123374.

Diagnosis of Bacterial Pathogens in the Urine of Urinary-Tract-Infection Patients Using Surface-Enhanced Raman Spectroscopy

Affiliations

Diagnosis of Bacterial Pathogens in the Urine of Urinary-Tract-Infection Patients Using Surface-Enhanced Raman Spectroscopy

Ni Tien et al. Molecules. .

Abstract

(1) Background: surface-enhanced Raman spectroscopy (SERS) is a novel method for bacteria identification. However, reported applications of SERS in clinical diagnosis are limited. In this study, we used cylindrical SERS chips to detect urine pathogens in urinary tract infection (UTI) patients. (2) Methods: Urine samples were retrieved from 108 UTI patients. A 10 mL urine sample was sent to conventional bacterial culture as a reference. Another 10 mL urine sample was loaded on a SERS chip for bacteria identification and antibiotic susceptibility. We concentrated the urine specimen if the intensity of the Raman spectrum required enhancement. The resulting Raman spectrum was analyzed by a recognition software to compare with spectrum-form reference bacteria and was further confirmed by principal component analysis (PCA). (3) Results: There were 97 samples with single bacteria species identified by conventional urine culture and, among them, 93 can be successfully identified by using SERS without sample concentration. There were four samples that needed concentration for bacteria identification. Antibiotic susceptibility can also be found by SERS. There were seven mixed flora infections found by conventional culture, which can only be identified by the PCA method. (4) Conclusions: SERS can be used in the diagnosis of urinary tract infection with the aid of the recognition software and PCA.

Keywords: Raman spectroscopy; SERS; urinary tract infection.


Conflict of interest statement

The authors declare no conflict of interest. The funders had no role in the design of the study; in the collection, analyses, or interpretation of data; in the writing of the manuscript; or in the decision to publish the results.

Figures
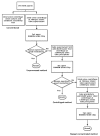
Figure 1
Figure 1
Flowchart of urine-sample processing.
Figure 2
Figure 2
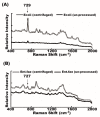
Raman shift patterns of bacteria from the unprocessed and centrifuged Raman. Raman spectrum of urine bacteria from the unprocessed sample (black line) and centrifuged sample (empty line) are similar. (A) Escherichia coli; (B) Enterococcus faecalis.
Figure 3
Figure 3
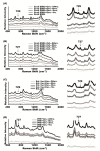
Centrifuged method and repeat concentrated method. Urinary-tract-infection (UTI) pathogens in the four samples that failed to be identified by the centrifugation method because of low resolution could be recognized with the repeat concentrated method. (A) Proteus mirabilis; (B,C) E. coli; and (D) E. coli ESBL.
Figure 4
Figure 4
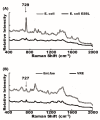
Raman spectra of antibiotic-susceptible and antibiotic-resistant bacteria. The Raman shift spectra of antibiotic-susceptible and antibiotic-resistant strains were similar. (A) E. coli and E. coli ESBL, (B) Enterococcus faecalis and vancomycin-resistant Enterococcus (VRE).
Figure 5
Figure 5
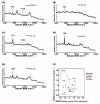
Principal component analysis (PCA) and the differentiation of antibiotic-susceptible and antibiotic-resistant bacteria. (A) Raman spectrum of E. coli; (B) Raman spectrum of E. coli ESBL; (C) PCA plots showed clustering of E. coli in the upper-left portion of the plot, and E. coli ESBL in the lower- right corner of the plot; (D) PC1 and PC2 loading plots corresponding to the PCA of (C); (E) Raman spectrum of E. faecalis; (F) Raman spectrum of VRE; (G) PCA plots show E. faecalis in the left side and VRE in the right side of the plot; (H) PC1 and PC2 loading plots corresponding to the PCA analysis of (G).
Figure 6
Figure 6
Antibiotic effects on bacterial-specific Raman signal. (A) 729 cm−1 signal peak of Raman spectrum time-dependently disappeared after gentamicin (Gen.) treatment in gentamicin-susceptible E. coli ESBL (gentamicin concentration: 0.256 mg/L); (B) E. coli-specific 729 cm−1 signal persisted in cefazolin (Cef.)-resistant E. coli ESBL. (cefazolin concentration: 0.256 mg/L); (C) Enterococcus-specific 727 cm−1 signal gradually disappeared after vancomycin treatment in vancomycin-susceptible Enterococcus faecalis (vancomycin concentration: 32.1 mg/L); (D) Enterococcus-specific 727 cm−1 signal persisted in VRE (vancomycin concentration: 0.256 mg/L).
Figure 7
Figure 7
Diagnosis of mixed flora infections. Urine infected with both Citrobacter ferundii and Proteus mirabilis was loaded on Raman chip. (A) Signal peaks of 727 and 1133 cm−1 can be seen in the Raman spectrum from the urine of a patient with mixed Citrobacter and Proteus infection; (B) Raman spectrum of known Citrobacter in urine sample showed a specific signal peak at 731 cm−1; (C) Raman spectrum of Proteus showed specific signal peaks at 727 and 1133 cm−1; (D) Raman spectrum of E. coli showed a signal peak at 729 cm−1; (E) Raman spectrum of Pseudomonas aeruginosa showed a signal peak at 725 cm−1; (F) PCA showed that four different known bacteria were spotted in different locations of the plot, and the PCA-spot patient with mixed Citrobacter and Proteus infection was deposited near the locations of Citrobacter and Proteus; (G) PC1 and PC2 loading plots corresponding to the PCA of (F).
Figure 7
Figure 7
Diagnosis of mixed flora infections. Urine infected with both Citrobacter ferundii and Proteus mirabilis was loaded on Raman chip. (A) Signal peaks of 727 and 1133 cm−1 can be seen in the Raman spectrum from the urine of a patient with mixed Citrobacter and Proteus infection; (B) Raman spectrum of known Citrobacter in urine sample showed a specific signal peak at 731 cm−1; (C) Raman spectrum of Proteus showed specific signal peaks at 727 and 1133 cm−1; (D) Raman spectrum of E. coli showed a signal peak at 729 cm−1; (E) Raman spectrum of Pseudomonas aeruginosa showed a signal peak at 725 cm−1; (F) PCA showed that four different known bacteria were spotted in different locations of the plot, and the PCA-spot patient with mixed Citrobacter and Proteus infection was deposited near the locations of Citrobacter and Proteus; (G) PC1 and PC2 loading plots corresponding to the PCA of (F).

References

    1. Sahm D.F., Thornsberry C., Mayfield D.C., Jones M.E., Karlowsky J.A. Multidrug-resistant urinary tract isolates of Escherichia coli: Prevalence and patient demographics in the United States in 2000. Antimicrob. Agents Chemother. 2001;45:1402–1406. doi: 10.1128/AAC.45.5.1402-1406.2001. - DOI - PMC - PubMed
    1. Nordenstam G., Sundh V., Lincoln K., Svanborg A., Eden C.S. Bacteriuria in representative population samples of persons aged 72-79 years. Am. J. Epidemiol. 1989;130:1176–1186. doi: 10.1093/oxfordjournals.aje.a115446. - DOI - PubMed
    1. Manges A.R., Johnson J.R., Foxman B., O’Bryan T.T., Fullerton K.E., Riley L.W. Widespread distribution of urinary tract infections caused by a multidrug-resistant Escherichia coli clonal group. N. Engl. J. Med. 2001;345:1007–1013. doi: 10.1056/NEJMoa011265. - DOI - PubMed
    1. Graham J.C., Galloway A. ACP Best Practice No 167: The laboratory diagnosis of urinary tract infection. J. Clin. Pathol. 2001;54:911–919. doi: 10.1136/jcp.54.12.911. - DOI - PMC - PubMed
    1. Seng P., Abat C., Rolain J.M., Colson P., Lagier J.C., Gouriet F., Fournier P.E., Drancourt M., La Scola B., Raoult D. Identification of rare pathogenic bacteria in a clinical microbiology laboratory: Impact of matrix-assisted laser desorption ionization-time of flight mass spectrometry. J. Clin. Microbiol. 2013;51:2182–2194. doi: 10.1128/JCM.00492-13. - DOI - PMC - PubMed

MeSH terms