. 2018 Dec 20;17(1):195.
doi: 10.1186/s12934-018-1044-2.

Saccharomyces cerevisiae morphological changes and cytokinesis arrest elicited by hypoxia during scale-up for production of therapeutic recombinant proteins

Affiliations

Saccharomyces cerevisiae morphological changes and cytokinesis arrest elicited by hypoxia during scale-up for production of therapeutic recombinant proteins

Juan C Aon et al. Microb Cell Fact. .

Abstract

Background: Scaling up of bioprocesses represents a crucial step in the industrial production of biologicals. However, our knowledge about the impact of scale-up on the organism's physiology and function is still incomplete. Our previous studies have suggested the existence of morphological changes during the scale-up of a yeast (Saccharomyces cerevisiae) fermentation process as inferred from the volume fraction occupied by yeast cells and exometabolomics analyses. In the current study, we noticed cell morphology changes during scale-up of a yeast fermentation process from bench (10 L) to industrial scale (10,000 L). We hypothesized that hypoxia observed during scale-up partially impaired the availability of N-acetyl-glucosamine, a precursor of chitin synthesis, a key polysaccharide component of yeast mother-daughter neck formation.

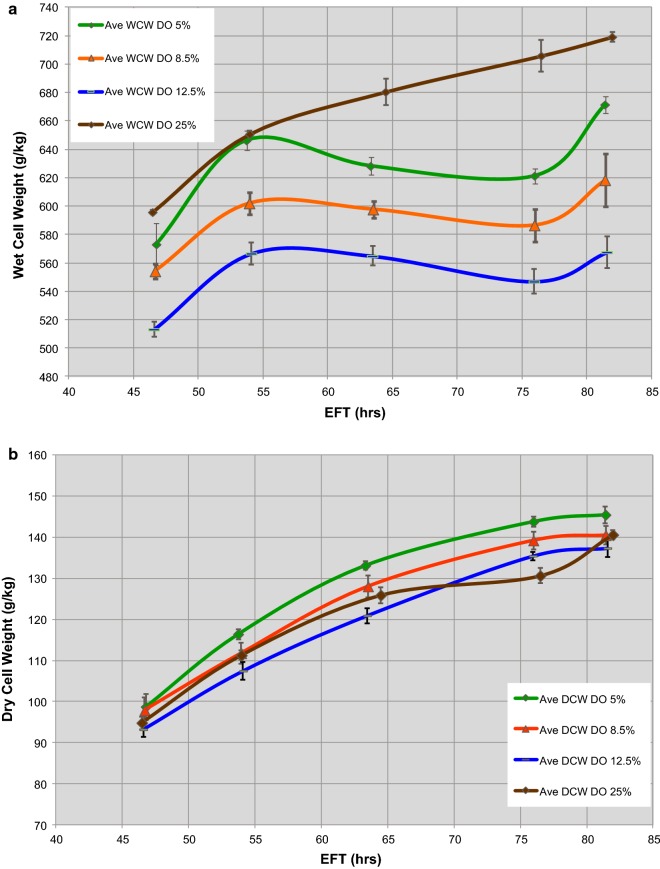
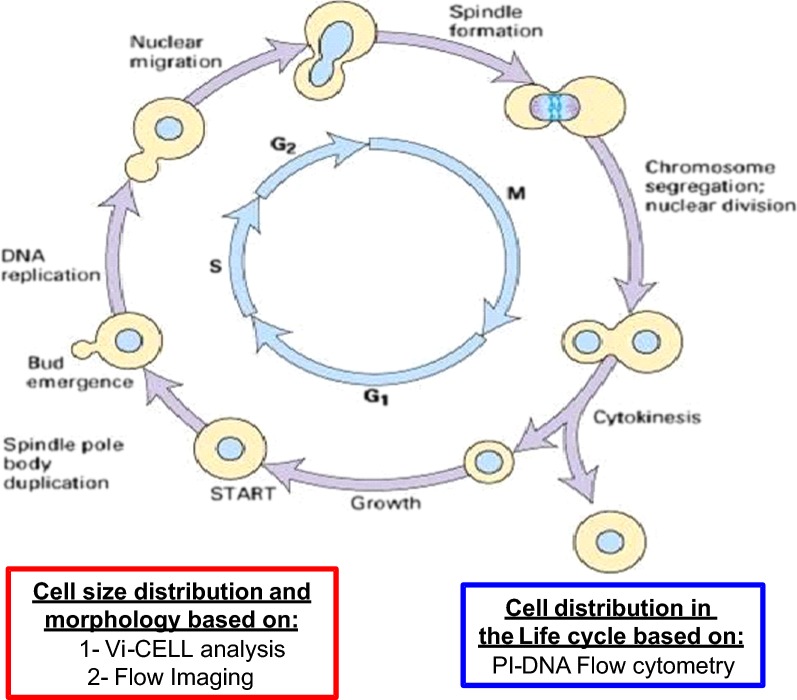
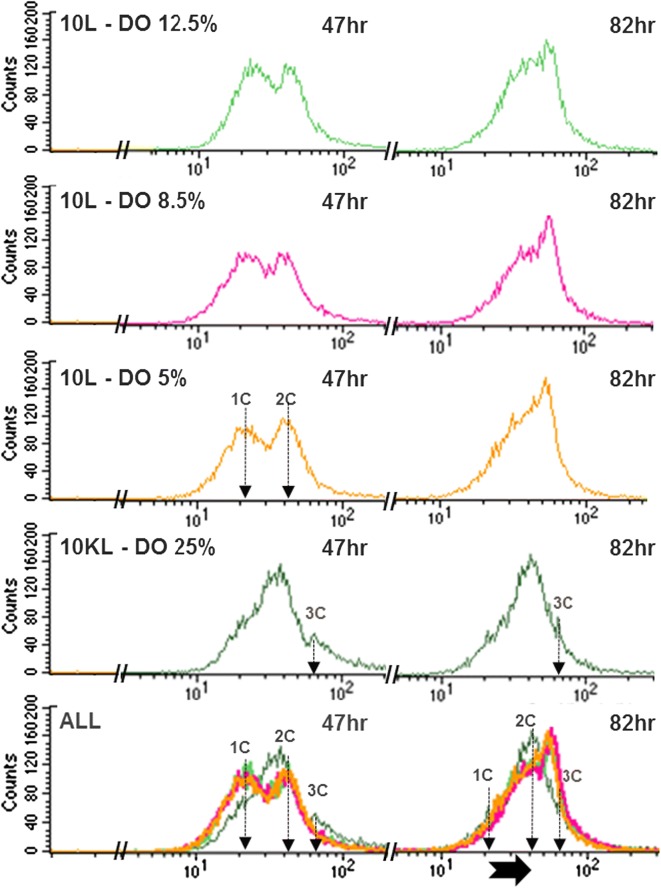
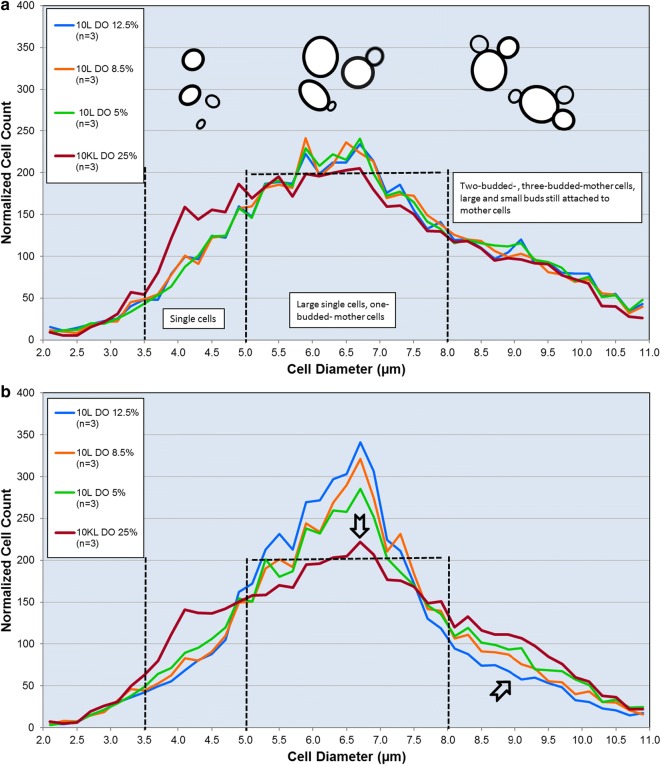
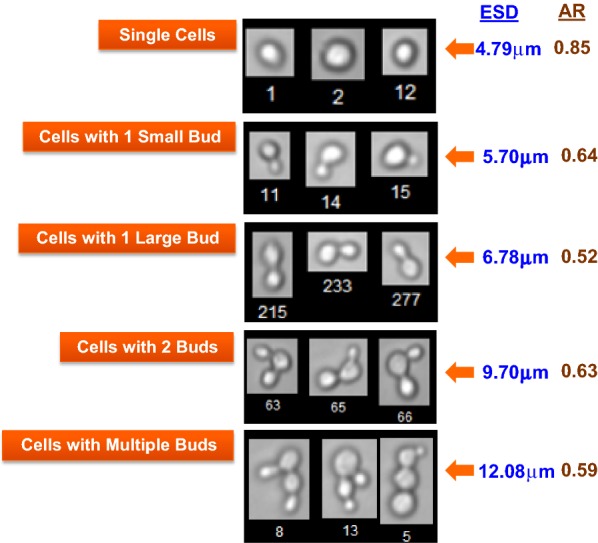
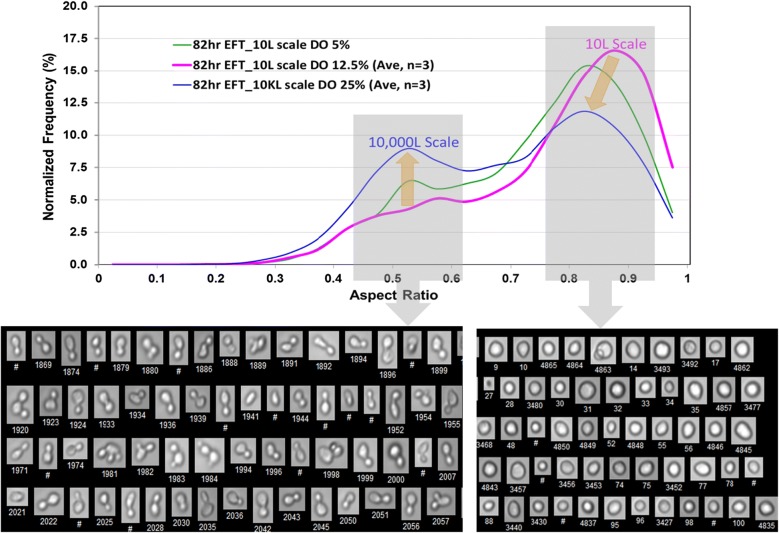
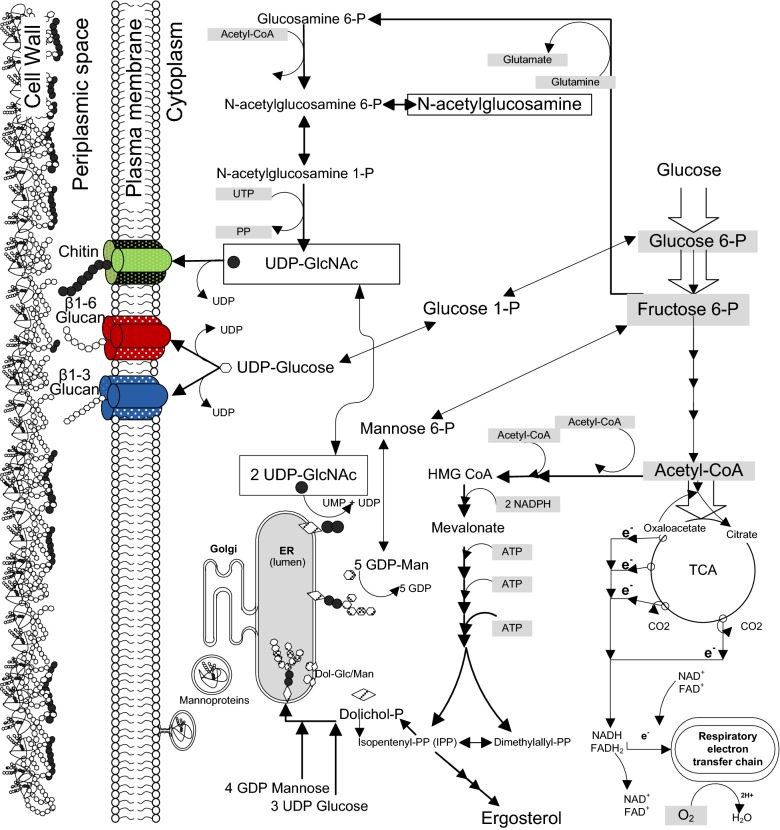
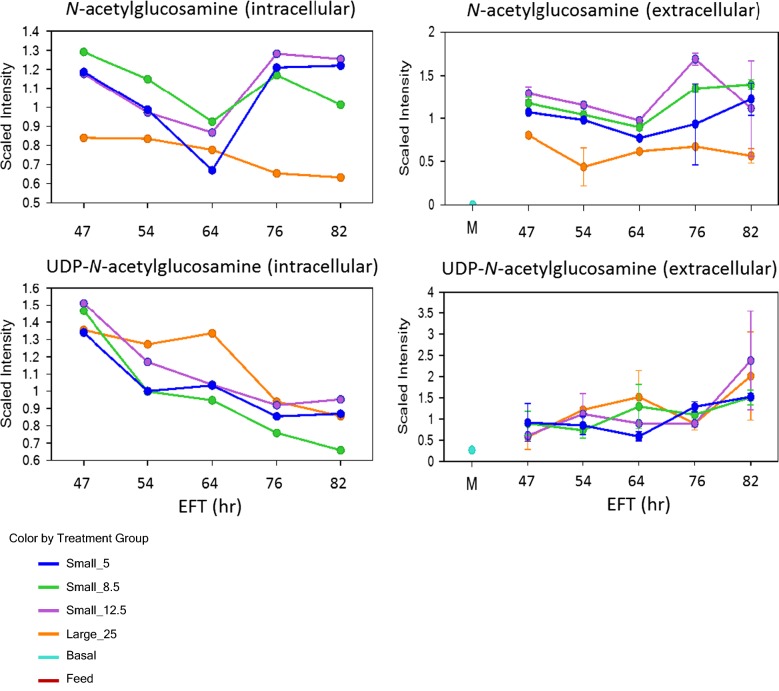
Results: Using a combination of flow cytometry with two high throughput cell imaging technologies, Vi-CELL and Flow Imaging, we found changes in the distribution of cell size and morphology as a function of process duration at the industrial scale of the production process. At the end of run, concomitantly with lowest levels of dissolved oxygen (DO), we detected an increase in cell subpopulations exhibiting low aspect ratio corresponding to morphologies exhibited by large-single-budded and multi-budded cells, reflecting incomplete cytokinesis at the M phase of the yeast mitotic cycle. Metabolomics from the intracellular milieu pointed to an impaired supply of precursors for chitin biosynthesis likely affecting the septum formation between mother and daughter and cytokinesis. Inducing hypoxia at the 10 L bench scale by varying DO levels, confirmed the existence and impact of hypoxic conditions on yeast cell size and morphology observed at the industrial scale.

Conclusions: We conclude that the observed increments in wet cell weight at the industrial scale correspond to morphological changes characterized by the large diameter and low aspect ratio exhibited by cell subpopulations comprising large single-budded and multi-budded cells. These changes are consistent with impairment of cytokinesis triggered by hypoxia as indicated by experiments mimicking this condition at DO 5% and 10 L scale. Mechanistically, hypoxia impairs N-acetyl-glucosamine availability, a key precursor of chitin synthesis.

Keywords: Cell wall; Cytokinesis; Fermentation bioprocess; Hypoxia; Metabolomics; Mitosis; Saccharomyces cerevisiae; Scale-up.


Figures

Fig. 1
Fig. 1
Comparison of time-course profiles of wet cell weights (a) and dry cell weights (b) of fermentations performed at 10,000 L scale and DO 25% (brown lines), and at 10 L scale set at three different DO set points, 5% (green lines), 8.5% (oranges lines), and 12.5% (blue lines). Plotted DCW, WCW values are average of triplicates at 10,000 L scale, and at 10 L scale per DO set point experimented. Error bars represented one standard deviation
Fig. 2
Fig. 2
Diagram of Saccharomyces cerevisiae mitotic life cycle and its different phases. Morphologies and DNA distribution associated with every phase of the yeast vegetative growth. Technologies used in this study to reveal chromosome segregation/nuclear division based on propidium iodide-DNA (PI-DNA) staining and quantitation with flow cytometry; and cell size as well as morphology distribution based on Vi-CELL and flow imaging
Fig. 3
Fig. 3
Quantification of cells with different DNA content by flow cytometry of fermentation at 10,000 L (10 KL) scale (dark green) and 10 L scale, within 10 L at DO 5% (orange), 8.5% (magenta), 12.5% (light green). Plots of counts of propidium iodide (PI) stained cells versus intensity of PI fluorescence at 47 (left hand-side profiles) and 82 hour (h) (right hand-side profiles) elapsed fermentation time (EFT). The DNA content is characterized by one set of chromosomes (1C), two sets (2C), up to three sets (3C) (shown by vertical arrows). For comparative purposes, all profiles at 47 h EFT were superimposed as well as those but separately at 82 h EFT. Purposely those overlays at both time points show the relative change of the subpopulations with different DNA content (1 set, 2, or 3 sets of chromosomes, or in between) as fermentations progressed to the end (82 h EFT) where the change trend is indicated by the horizontal arrow (bottom overlays)
Fig. 4
Fig. 4
Profiles of the distribution of subpopulations with different cell diameters at elapsed fermentation time 47 h (a), and 82 h (b). Plotted are the normalized cell counts (NCC) versus the cell diameter from 2 to 11 microns (µm) using Vi-CELL XR Viability Analyzer. Cell count values were normalized by total count for each sample measurement and averaged. Vertical dashed-lines indicate the three ranges of cell diameter, 3.5–5.0, 5.0–8.0, and 8.0–11.0 µm. Above every cell diameter range, the typical associated morphologies observed for those cell sizes. Horizontal dashed-line located at 200 NCC is a reference to assess the relative changes of the subpopulation NCCs as fermentations progressed to the end (82 h EFT) where the change trends are indicated by the arrows
Fig. 5
Fig. 5
Images of the representative populations of cell morphologies captured using the FlowCAM VS-1 Fluid Imaging Instrument. For the ESD and AR definitions refer to the “Methods” section. The average ESD and AR values are shown for each of the population ranging from 4.79 to 12.08 μm for ESD and from 0.52 to 0.85 for the AR
Fig. 6
Fig. 6
Overlay of cell AR distributions at the end of 10 L and 10 KL bioreactor runs at three different DO set points. Significant differences in distributions attributed to scale and DO levels, are indicated by the arrows and correspond to two main populations with approximate AR values of 0.54 and 0.85. Difference in abundance of populations with ~ 0.5 AR is highlighted in the top panel and respective morphologies of representative cells are shown in the bottom panel. Average AR and ESD values of displayed cells are 0.54 and 7.02 µm respectively. Difference in abundance of populations with ~ 0.9 AR is highlighted in the top panel and respective morphologies of representative cells are shown in the bottom panel. Average AR and ESD values of displayed cells are 0.85 and 5.58 µm respectively
Fig. 7
Fig. 7
Pathway diagram of phosphorylated nucleosides which are key intermediates in glycosylation and cell wall synthesis pathways generating chitin, glucans, and poly-mannosylated (mannoproteins) proteins. Pathway of N-acetyl-glucosamine (GlcNAc) synthesis in cytoplasm from glycolysis, followed by formation of UPD-N-acetyl-glucosamine (UDP-GlcNAc) and its polymerization at the plasma membrane complex (green) to form chitin which is translocated into the periplasmic space. The glucans are synthesized from UDP-glucose in the cytoplasm by polymerization at the plasma membrane to form β-1,3- (blue) and β-1,6-glucan (red), and secreted into the periplasmic space. Poly-mannosylated proteins are processed through the endoplasmic reticulum and Golgi for packing in vesicles that are transported to the plasma membrane to be secreted into the periplasmic space
Fig. 8
Fig. 8
Profiles of N-acetyl-glucosamine (GlcNAc) and UDP-GlcNAc relative intracellular and extracellular levels when fermentations are performed at different scales and DO set points. These are key intermediates for chitin synthesis and monitored for differences over time at 10,000 L scale and DO 25% (Large_25) (orange line) and at 10 L scale at DO 5% (Small_5) (blue line), DO 8.5% (Small_8.5) (green line), and DO 12.5% (Small_12.5) (purple line). The intermediates measurement and data analysis were determined as described in “Methods” section. In this line plot graph, data are scaled such that the median value measured across all samples was set to 1.0. Error bars represents “mean +/− one standard deviation”. In the extracellular samples, GlcNAc levels are shown at “M” in the time axis for extracellular medium line plot stand for Basal Medium (light blue), and at Feed (brown) where is undetectable

Similar articles

Cited by

References

    1. Fu Z, Verderame TD, Leighton JM, Sampey BP, Appelbaum ER, Patel PS, Aon JC. Exometabolome analysis reveals hypoxia at the up-scaling of a Saccharomyces cerevisiae high-cell density fed-batch biopharmaceutical process. Microb Cell Fact. 2014;13:32. doi: 10.1186/1475-2859-13-32. - DOI - PMC - PubMed
    1. Aon JC, Sun J, Leighton J, Appelbaum E. Hypoxia-elicited impairment of cell wall integrity, glycosylation precursors synthesis, and growth in scaled-up high-cell density fed-batch cultures of Saccharomyces cerevisiae. Microb Cell Fact. 2016;15:142. doi: 10.1186/s12934-016-0542-3. - DOI - PMC - PubMed
    1. Cid VJ, Duran A, Del Rey F, Snyder MP, Nombela C, Sanchez M. Molecular basis of cell integrity and morphogenesis in Saccharomyces cerevisiae. Microbiol Rev. 1995;59:345–386. - PMC - PubMed
    1. Biely P. Changes in the rate of synthesis of wall polysaccharides during the cell cycle of yeast. Arch Microbiol. 1978;119:213–214. doi: 10.1007/BF00964275. - DOI - PubMed
    1. Díaz S, Zinker S, Ruiz-Herrera J. Alterations in the cell wall of Saccharomyces cerevisiae induced by the alpha sex factor or a mutation in the cell cycle. Antonie Leeuwenhoek. 1992;61:269–276. doi: 10.1007/BF00713935. - DOI - PubMed

MeSH terms

Substances

LinkOut - more resources