. 2019 Feb;29(2):293-303.
doi: 10.1101/gr.238279.118. Epub 2018 Dec 20.

Identification of regulatory elements from nascent transcription using dREG

Affiliations

Identification of regulatory elements from nascent transcription using dREG

Zhong Wang et al. Genome Res. 2019 Feb.

Abstract

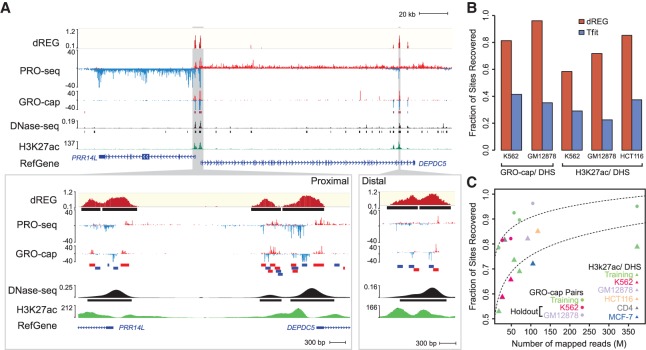
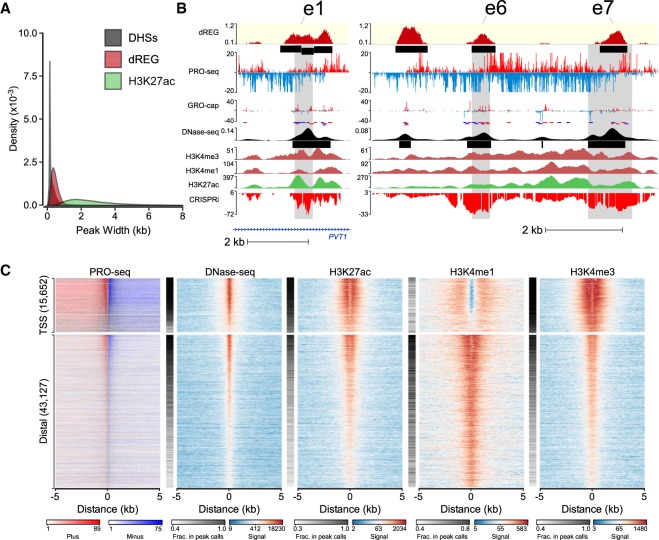
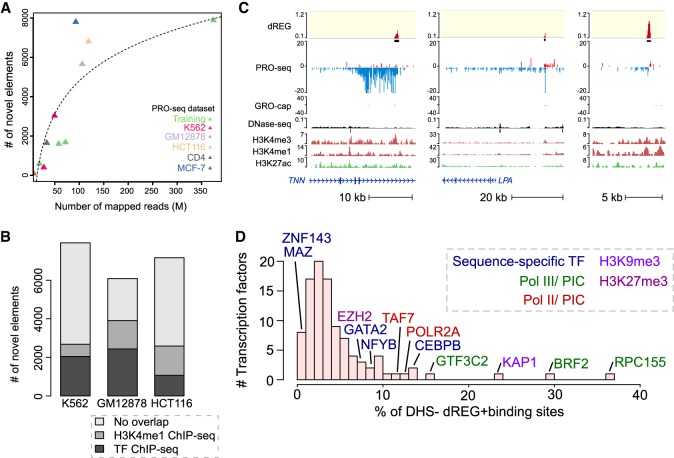
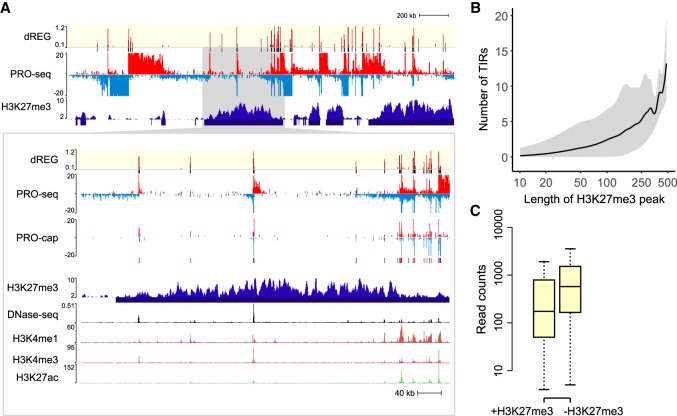
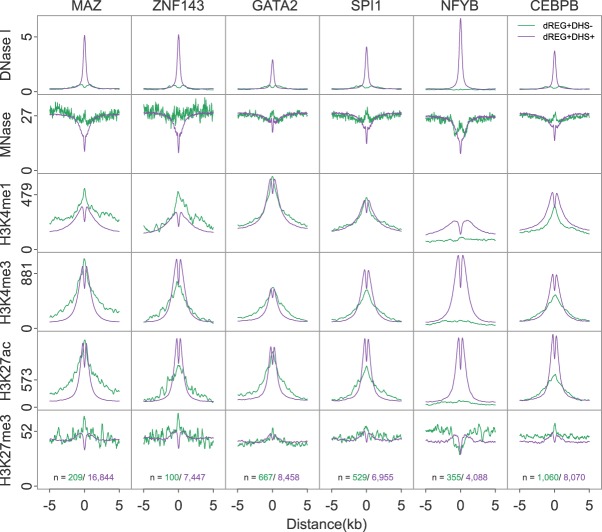
Our genomes encode a wealth of transcription initiation regions (TIRs) that can be identified by their distinctive patterns of actively elongating RNA polymerase. We previously introduced dREG to identify TIRs using PRO-seq data. Here, we introduce an efficient new implementation of dREG that uses PRO-seq data to identify both uni- and bidirectionally transcribed TIRs with 70% improvement in accuracy, three- to fourfold higher resolution, and >100-fold increases in computational efficiency. Using a novel strategy to identify TIRs based on their statistical confidence reveals extensive overlap with orthogonal assays, yet also reveals thousands of additional weakly transcribed TIRs that were not identified by H3K27ac ChIP-seq or DNase-seq. Novel TIRs discovered by dREG were often associated with RNA polymerase III initiation, bound by pioneer transcription factors, or located in broad domains marked by repressive chromatin modifications. Our results suggest that transcription initiation can be a powerful tool for expanding the catalog of functional elements.


Figures

Figure 1.
Figure 1.
dREG identifies regions of transcription initiation. (A) WashU Epigenome Browser visualization of dREG signal, PRO-seq data, GRO-cap, DNase-seq, and H3K27ac ChIP-seq near the PRR14L and DEPDC5 genes. Inserts (cf. gray shaded pointers) show an expanded view of gene-proximal promoter elements (left) and a distal enhancer (right), each encoding multiple transcription initiation sites. (B) Bar plots show the fraction of transcribed DHSs (left) and H3K27ac+ DHSs (right) that were discovered by dREG (red) and Tfit (blue) in holdout data sets. (C) Scatterplot shows the fraction of sites recovered (y-axis) as a function of sequencing depth (x-axis) for 12 data sets shown in Supplemental Table S1. The best fit lines are shown. The color represents whether the data set was used for training (green) or is a holdout data set (K562, red) or cell type (GM12878, lavender; HCT116, orange; CD4+ T-cells, gray; MCF-7, blue).
Figure 2.
Figure 2.
dREG calls are often concordant with other molecular assays. (A) Histogram shows the size distribution of dREG TIRs, H3K27ac ChIP-seq peaks, or DHSs. (B) WashU Epigenome Browser visualization of dREG signal, PRO-seq data, GRO-cap, DNase-seq, H3K4me3, H3K4me1, H3K27ac ChIP-seq, and CRISPR interference score (CRISPRi) at three enhancers (e1, e6, and e7) that affect transcription of MYC in K562 cells based on CRISPR interference (CRISPRi). (C) Heat maps show the log-signal intensity of PRO-seq, DNase-seq, or ChIP-seq for H3K27ac, H3K4me1, and H3K4me3. The fraction of sites intersecting ENCODE peak calls is shown in the white-black color map beside each plot. Color scales for signal and the fraction in peak calls are shown below the plot. Each row represents TIRs found overlapping an annotated transcription start site (n = 15,652) or >5 kb to a start site (n = 43,127).
Figure 3.
Figure 3.
dREG identifies new regions that were not found using other molecular assays. (A) Scatterplot shows the number of new TIRs that were not discovered in DNase-seq or H3K27ac ChIP-seq data (y-axis) as a function of sequencing depth (x-axis) for seven data sets shown in Supplemental Table S1. The best fit line is shown. The color represents whether the data set was used for training (green) or is a holdout data set (K562, red) or cell type (GM12878, lavender; HCT116, orange; CD4+ T-cells, gray; MCF-7, blue). (B) Stacked bar charts show the number of elements discovered using dREG, but not found in DNase-seq or H3K27ac ChIP-seq (y-axis) for PRO-seq or GRO-seq data sets in K562, GM12878, and HCT116 cells. The color denotes other functional marks intersecting sites discovered only using dREG. (C) Three separate genome browser regions that denote TIRs discovered using dREG, but were not found in DNase-seq or H3K27ac ChIP-seq data. Tracks show dREG signal, PRO-seq data, GRO-cap, DNase-seq, H3K27ac ChIP-seq, and annotated genes. (D) Histogram representing the fraction of binding sites for 100 transcription factors supported by a dREG TIR that was not also discovered in DNase-seq data. Several of the outliers are shown. The color denotes whether the factor is a member of the RNA polymerase III (Pol III) preinitiation complex (green), Pol II preinitiation complex (red), associated with H3K9me3 (light purple), or H3K27me3 heterochromatin (purple), or is a sequence-specific transcription factor (blue).
Figure 4.
Figure 4.
dREG TIRs located in H3K27me3 domains. (A) WashU Epigenome Browser visualization of dREG signal, PRO-seq data, GRO-cap, H3K27me3 ChIP-seq, DNase-seq, and H3K4me1, H3K4me3, and H3K27ac ChIP-seq. The insert (cf. gray shaded pointer) shows an expanded view of the H3K27me3 domain encoding multiple transcription initiation sites that were also supported in GRO-cap data. (B) The number of TIRs discovered in each H3K27me3 broad peak as a function of H3K27me3 peak size. The line represents the median, and gray shading denotes the fifth and 95th percentile. The x-axis is a log scale. (C) The box plot shows the difference in PRO-seq read counts between TIRs in an H3K27me3 peak call (+H3K27me3, left) and outside of an H3K27me3 peak call (−H3K27me3, right). The y-axis represents the number of reads found within 250 bp of each TIR.
Figure 5.
Figure 5.
dREG TIRs with specific transcription factor binding show distinct chromatin marks. Metaplots show the raw signal of DNase-seq, MNase-seq, and ChIP-seq for H3K4me1, H3K4me3, H3K27ac, and H3K27me3 near binding sites for six transcription factors, including MAZ, ZNF143, GATA2, SPI1, NFYB, and CEBPB. Signals are shown for dREG+DHS− (green) and dREG+DHS+ (purple) sites. The number of sites contributing to each signal is shown (bottom).

References

    1. Allen MA, Andrysik Z, Dengler VL, Mellert HS, Guarnieri A, Freeman JA, Sullivan KD, Galbraith MD, Luo X, Kraus WL, et al. 2014. Global analysis of p53-regulated transcription identifies its direct targets and unexpected regulatory mechanisms. eLife 3: e02200 10.7554/eLife.02200 - DOI - PMC - PubMed
    1. Andersson R, Gebhard C, Miguel-Escalada I, Hoof I, Bornholdt J, Boyd M, Chen Y, Zhao X, Schmidl C, Suzuki T, et al. 2014a. An atlas of active enhancers across human cell types and tissues. Nature 507: 455–461. 10.1038/nature12787 - DOI - PMC - PubMed
    1. Andersson R, Refsing Andersen P, Valen E, Core LJ, Bornholdt J, Boyd M, Heick Jensen T, Sandelin A. 2014b. Nuclear stability and transcriptional directionality separate functionally distinct RNA species. Nat Commun 5: 5336 10.1038/ncomms6336 - DOI - PubMed
    1. Andersson R, Sandelin A, Danko CG. 2015. A unified architecture of transcriptional regulatory elements. Trends Genet 31: 426–433. 10.1016/j.tig.2015.05.007 - DOI - PubMed
    1. Azofeifa JG, Dowell RD. 2016. A generative model for the behavior of RNA polymerase. Bioinformatics 33: 227–234. 10.1093/bioinformatics/btw599 - DOI - PMC - PubMed

Publication types