. 2019 Feb 1;79(3):518-533.
doi: 10.1158/0008-5472.CAN-18-1062. Epub 2018 Dec 20.

Acid-Induced Downregulation of ASS1 Contributes to the Maintenance of Intracellular pH in Cancer

Affiliations

Acid-Induced Downregulation of ASS1 Contributes to the Maintenance of Intracellular pH in Cancer

Alon Silberman et al. Cancer Res. .

Abstract

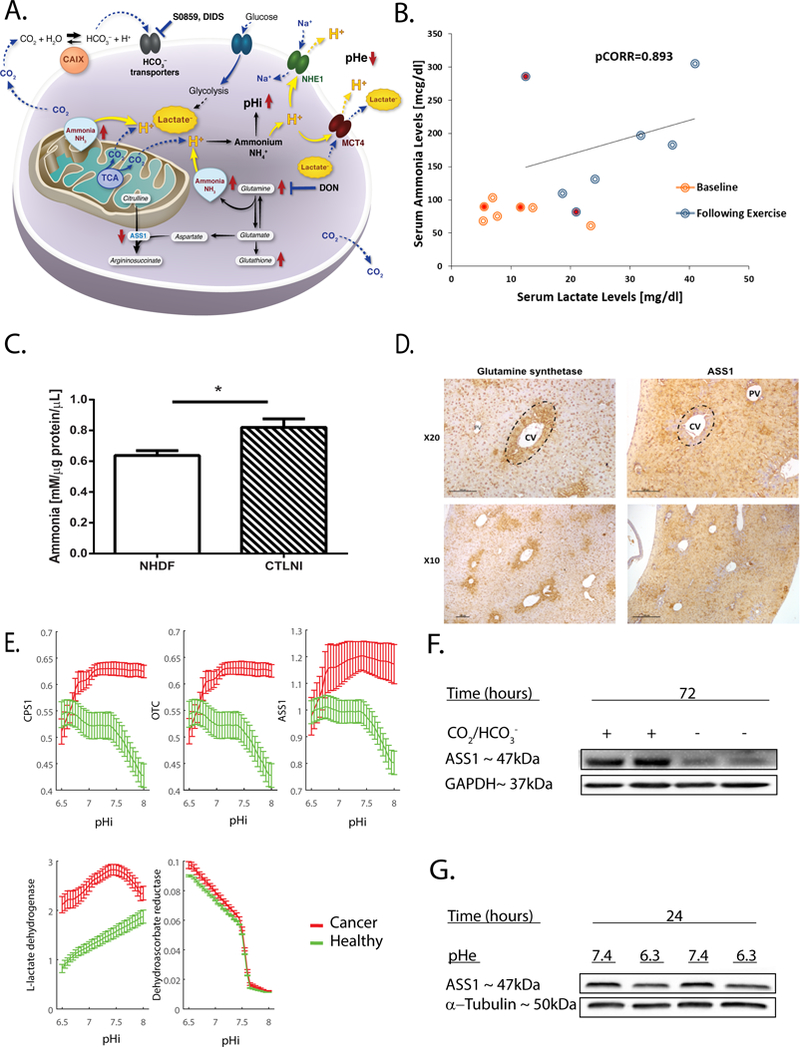
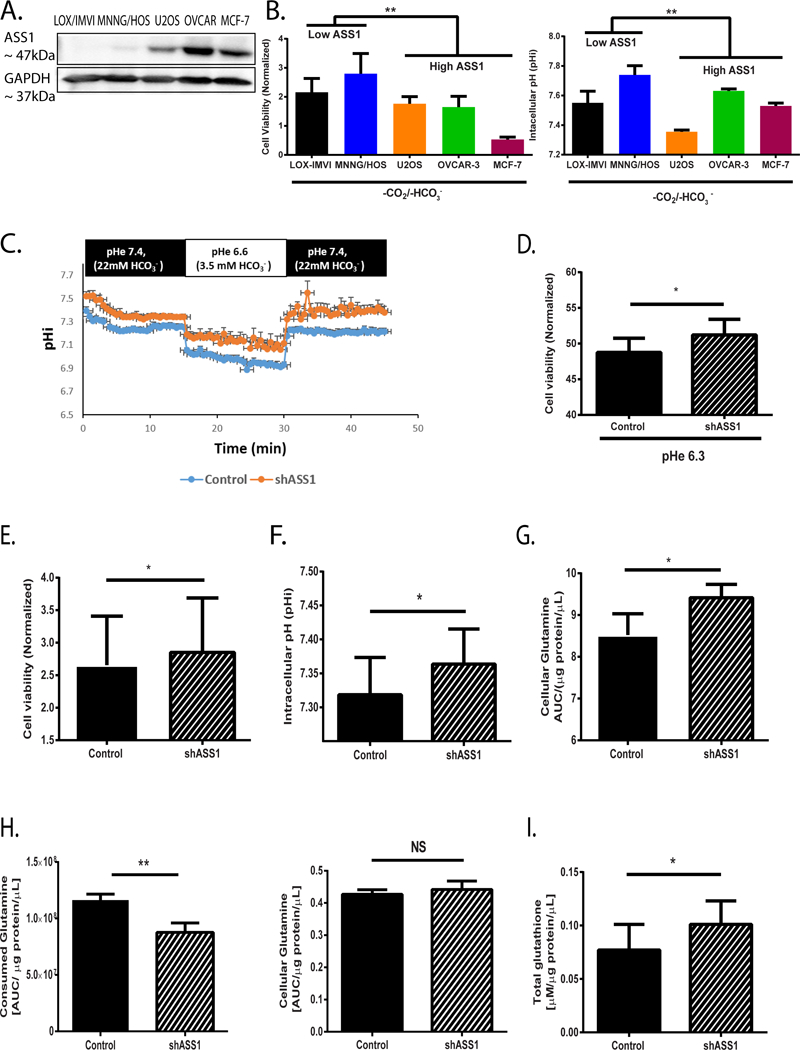
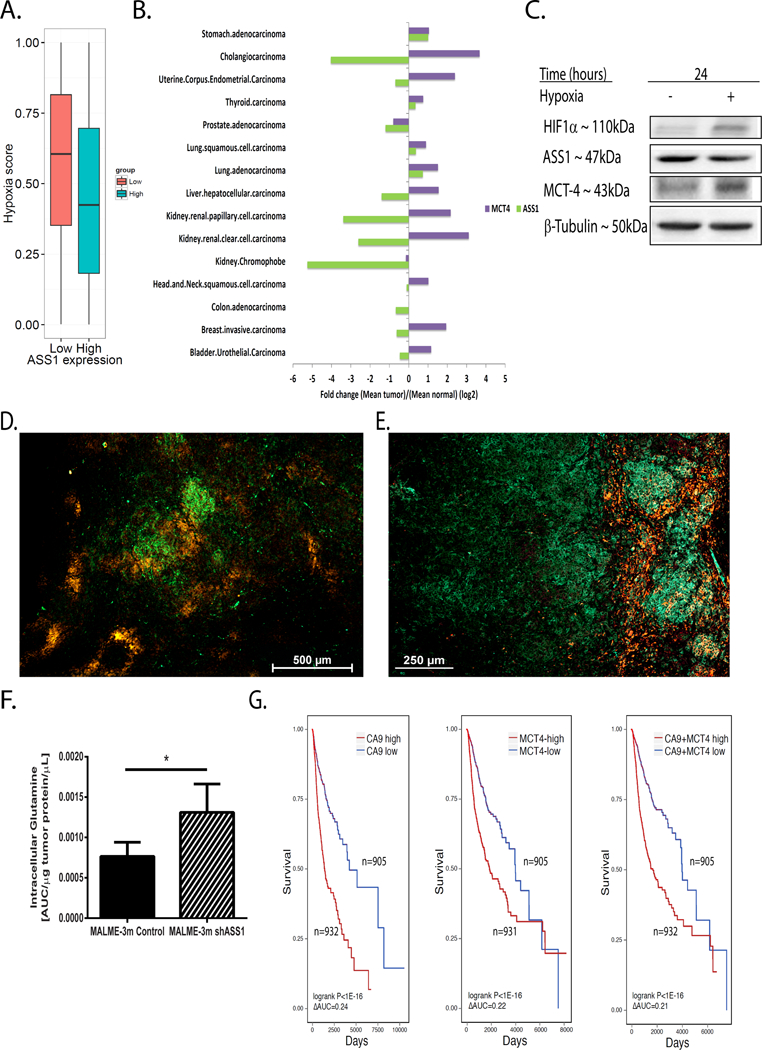
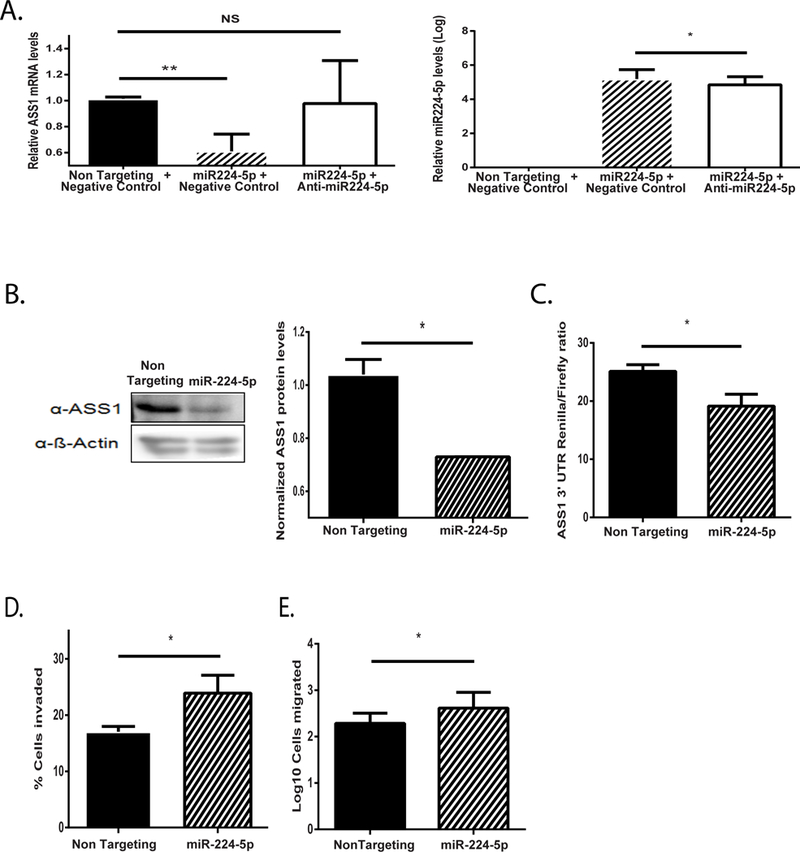
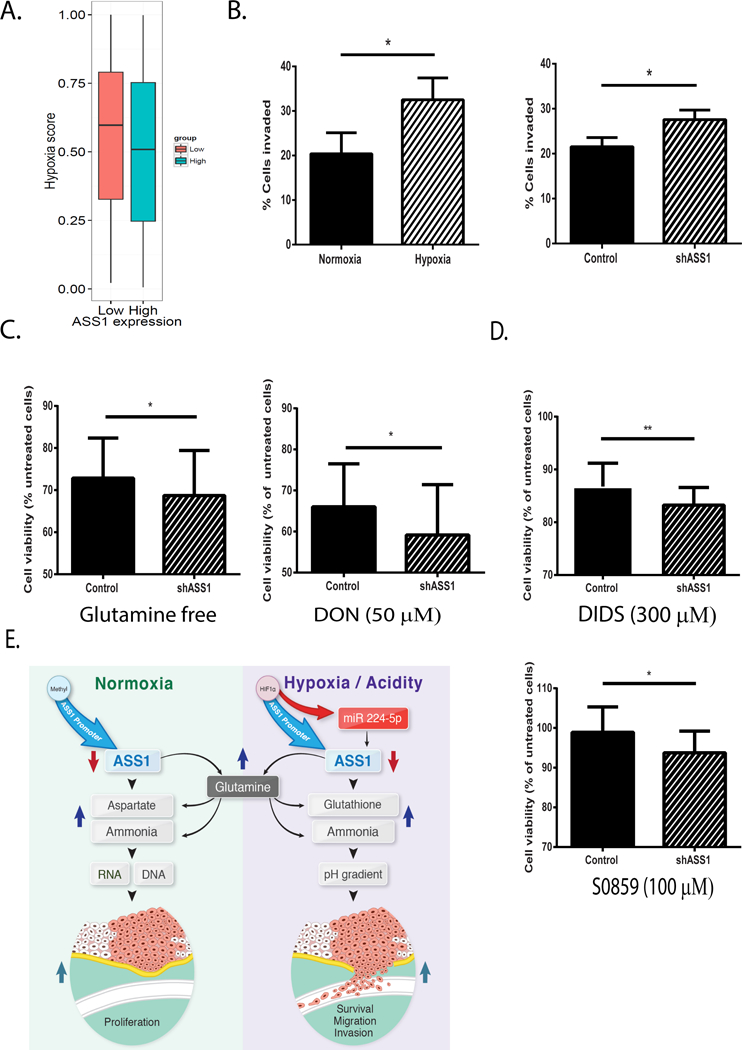
Downregulation of the urea cycle enzyme argininosuccinate synthase (ASS1) by either promoter methylation or by HIF1α is associated with increased metastasis and poor prognosis in multiple cancers. We have previously shown that in normoxic conditions, ASS1 downregulation facilitates cancer cell proliferation by increasing aspartate availability for pyrimidine synthesis by the enzyme complex CAD. Here we report that in hypoxia, ASS1 expression in cancerous cells is downregulated further by HIF1α-mediated induction of miR-224-5p, making the cells more invasive and dependent on upstream substrates of ASS1 for survival. ASS1 was downregulated under acidic conditions, and ASS1-depleted cancer cells maintained a higher intracellular pH (pHi), depended less on extracellular glutamine, and displayed higher glutathione levels. Depletion of substrates of urea cycle enzymes in ASS1-deficient cancers decreased cancer cell survival. Thus, ASS1 levels in cancer are differentially regulated in various environmental conditions to metabolically benefit cancer progression. Understanding these alterations may help uncover specific context-dependent cancer vulnerabilities that may be targeted for therapeutic purposes. SIGNIFICANCE: Cancer cells in an acidic or hypoxic environment downregulate the expression of the urea cycle enzyme ASS1, which provides them with a redox and pH advantage, resulting in better survival.Graphical Abstract: http://cancerres.aacrjournals.org/content/canres/79/3/518/F1.large.jpg.


Conflict of interest statement

The authors declare no potential conflicts of interest

Figures

Fig. 1:
Fig. 1:. ASS1 expression is downregulated during hypoxia and acidic states.
(A) Illustration of the hypothesized metabolic effects of ASS1 downregulation on cancer pH gradient. During aerobic metabolism, hydrated CO2 is a main cellular source of acidity. Inactivation of ASS1 in cancer would be expected to lead to accumulation of upstream metabolites such as glutamine and ammonia (derived from glutamine). Increase in these metabolites could be vital for the pH gradient in the maintenance of an alkalized pHi that is crucial for cancer cell survival, invasion and migration. In contrast, depletion of ASS1’s upstream substrates in ASS1 deficient cancer cells would be expected to confer vulnerability. Abbreviations: ASS1 (Argininosuccinate Synthase 1), pHi (pH intracellular), pHe (pH extracellular), TCA (tricarboxylic acid), NHE-1 (Na(+)/H(+) Exchanger 1), MCT4 (monocarboxylate transporter 4), CAIX (Carbonic anhydrase 9), DIDS (4,4′-Diisothiocyanatostilbene-2,2′-disulfonic acid), DON (6-Diazo-5-oxo-L-norleucine). (B) The FIT was performed for individuals who presented at the Metabolic Disease Unit of the Sheba Medical Center for evaluation of elevated serum Creatine Phosphokinase levels. The graph demonstrates the results of seven male subjects tested in the last five years in the age range of 8–28 years. Five out of the tested subjects were considered to have normal results since they had a coupled elevation of both lactate and ammonia in their serum after three minutes of exercise (blue circles) as compared to baseline levels (orange circles), while two subjects depicted by the filled red circles showed elevation of lactate without the expected accompanying elevation of ammonia levels and was thus suspected to have inborn error of metabolism. The normal ranges for serum lactate and ammonia levels are 6.0–18.0 mg/dl and 31.0–123.0 mcg/dl, respectively. pCORR=0.893 was calculated for healthy subjects following after three minutes of exercise. pCORR=0.311 was calculated for all tested subjects including those suspected to have IEM. (C) Extracellular ammonia measurements in media of fibroblasts generated from a patient with CTLN I as compared to normal human dermal fibroblasts (NHDF). The experiment was performed in triplicates and repeated twice. (D) A representative immunohistochemistry staining (DAB) of a wild type mouse liver for ASS1 and glutamine synthetase (GS). Magnification X10, X20. Portal Vein (PV); Central Vein (CV); glutamine synthetase is used as a CV biomarker. (E) The predicted metabolic activity of the three proximal urea cycle enzymes CPS1, OTC, and ASS1 following pHi changes. The activity is predicted to decrease in cancer cells with acidic pHi, in comparison to normal healthy cells (green), while that of Glutathione dehydrogenase (Dehydroascorbate reductase), is predicted to increase in acidic pH in both cancer and healthy cells. The activity of lactate dehydrogenase (LDH), which has been reported to decrease in cancer cells with acidity(31), serves as an internal control for the other predictions. Fluxes are given in mmol/mgDW/h. Mean values and their corresponding standard deviations are estimated across a dozens of genome-scale metabolic models, representing cell lines from each of the NCI-60 and HapMap panels. (F) A representative western blot image showing ASS1 protein levels extracted from osteosarcoma cells following 72 hours of incubation with or without bicarbonate in the media and CO2 in the incubator (−CO2/−HCO3 or +CO2/+HCO3 conditions). ASS1 protein levels are normalized to the expression levels of GAPDH (G) A representative western blot image showing ASS1 protein levels extracted from osteosarcoma cells following 24 hours of incubation in either pHe 7.4 or pHe 6.3 media using 25mM PIPES. ASS1 protein levels are normalized to the expression levels of α−tubulin. We used student’s t-test (2-tail) for statistical analysis in (C). The graph is presented as an average ± S.D. *, P ≤ 0.05.
Figure 2:
Figure 2:. ASS1 deficient cancer cells have survival advantage in acidic environment.
(A) A representative western blot showing ASS1 expression levles in five different cancer cell lines (B) Left panel: viability assays of five different cancer cells divided into two groups based on ASS1 expression as either “High ASS1” or “Low ASS1”, following 72 hours incubation under −CO2/−HCO3 conditions (viability is quantified relative to day 0). Right panel: pHi measurements of five different cancer cells divided into two groups based on ASS1 expression as either “High ASS1” or “Low ASS1”, following 72 hours incubation under −CO2/−HCO3 conditions (C) A Representative pHi curve based on quantifications of live confocal microscope images of U2OS osteosarcoma cells infected with either empty vector (control) or shASS1 and incubated in alternating pH solutions. Using the HH equation, solutions were supplemented with bicarbonate to reach the specified pH. For pH 7.4 buffer we used 22mM HCO3; 5% CO2 and for pH 6.6 buffer we used 3.5 mM HCO3; 5% CO2. Each point of a pHi value is an average of n ≥ 10 cells (ROIs). (D) Viability experiments showing increased survival for shASS1 U2OS cells as compared to control cells following 24 hours incubation under pHe 6.3 (1.75 mM HCO3; 5% CO2). Viability at pHe 6.3 (1.75 mM HCO3; 5% CO2) of each clone was normalized to its viability at pHe 7.4 (22 mM HCO3 ; 5% CO2). We did not detect significant differences in pHi between control and shASS1 U2OS cells under pHe 6.3. (E) Viability measurements of U2OS osteosarcoma cells infected with either empty vector or shASS1 and incubated under −CO2/−HCO3 conditions (viability is quantified relative to day 0). (F) Averaged pHi measurements of control U2OS osteosarcoma cells infected with either empty vector or shASS1 following incubation under −CO2/−HCO3 conditions for 72 hours. All measurements were done using pH 7.4 HEPES buffer medium in an incubator without CO2. Results are presented as an average of n≥5 independent experiments. (G) Cellular glutamine measurements using GC/MS of control and shASS1 osteosarcoma cells grown under +CO2/+HCO3 conditions at time point 24 hours (baseline). (H) Left panel: Glutamine uptake measurements using amino acid analyzer from the media of either control or shASS1 osteosarcoma cells grown under −CO2/−HCO3 conditions for 72 hours. Right panel: Cellular glutamine measurements of control and of shASS1 osteosarcoma cells grown under −CO2/−HCO3 conditions at time point 72 hours. (I) Total glutathione levels in control and shASS1 osteosarcoma cells grown under −CO2/−HCO3 conditions at time point 72 hours. For the multiple cell line comparisons in 2B, we used Two-way ANNOVA (with A-priori contrast: MNNG/HOS, LOX-IMVI vs. U2OS, MCF-7 and OVCAR-3). For all other comparisons, student’s t-test was used (2-tail) for statistical analysis. Unless otherwise specified, each graph represents the average of n≥3 experiments ± S.D. *, P ≤ 0.05; **, P≤ 0.01.
Figure 3:
Figure 3:. ASS1 levels are regulated together with HIF1α− gene network for pH regulation.
(A) Pan cancer analysis of the TCGA database demonstrating that tumors with low ASS1 expression levels (red) have a higher hypoxic score, based on measurement that includes HIF1α target genes’ expression (effect size: 0.180; Wilcoxon rank sum P<0.05, see Methods). (B) Pan cancer analysis of the TCGA database for ASS1 and MCT4, as compared to the expression of these genes in the respective normal tissues. Monocarboxylate transporter 4 (MCT4; SLC16A3); Argininosuccinate synthase 1(ASS1). (C) A representative western blot for the protein expression of HIF1α target genes in human osteosarcoma (U2OS) cells exposed to either normoxia or hypoxia for 24 hours. (D) A representative immunofluorescence image of a melanoma (Malme-3M) paraffin embedded tumor section following the administration and staining of the hypoxia sensitive pimonidazole probe (red) and of ASS1 (green). Magnification X4. (E) A representative immunofluorescence image of a Malme-3M melanoma paraffin tumor section stained for MCT4 (green) and ASS1 (red). Magnification X6. (F) Ex-vivo measurement of tumor glutamine levels using GC/MS in control Malme-3M vs shASS1 Malme-3M tumor cells. (G) Kaplan-Meier plots showing decreased survival in patients with tumors having either over expression of CA9 (left panel), MCT4 (middle panel) or of both (right panel) when ASS1 expression is downregulated. CA9 (low CA9: n=905; High CA9: n=932 patients) - Cox hazard ratio=1.14 (P<0.06), logrank P<1E-16 (ΔAUC=0.24); MCT4 (low MCT4: n=905 patients; High MCT4: n=931 patients) - Cox hazard ratio=1.19 (P<0.01), logrank P<1E-16, (ΔAUC=0.22). CA9 and MCT4 (low CA9+MCT4: n=905 patients; High CA9+MCT4: n=932 patients) - Cox hazard ratio=1.23 (P<0.004), logrank P<1E-16 (ΔAUC=0.21). We used student’s t-test (2-tail) for statistical analysis in (F) that represents the average of five mice per group ± S.D. *, P ≤ 0.05.
Figure 4:
Figure 4:. miR224-5p downregulates ASS1.
(A) ASS1 mRNA (left panel) levels are downregulated in osteosarcoma cells following transfection with miR-224–5p (right panel) under normoxia. Addition of anti miR224-5p rescued ASS1 levels. (B) Left panel: A representative western blot image showing reduction in ASS1 expression levels in osteosarcoma cells following transfection with miR224-5p (48 hours). Right panel: Averaged gel quantification (C) Luciferase assay showing diminished ratio of ASS1 3’ UTR Renilla to Firefly luciferases following transfection with miR224-5p. (D) Osteosarcoma cells invade significantly more following transfection with miR224-5p under normoxia. (E) Osteosarcoma cells migrate significantly more following transfection with miR-224–5p under normoxia. We used student’s t-test (2-tail) for statistical analysis. Unless otherwise specified, each graph represents the average of n≥3 experiments ± S.D. *, P ≤ 0.05; **, P≤ 0.01.
Figure 5:
Figure 5:. Cancer cells expressing low levels of ASS1 have increased sensitivity to glutamine and bicarbonate depletion.
(A) Pan cancer analysis based on TCGA metastatic samples showing that tumors with low ASS1 levels have a higher hypoxia-score (effect size: 0.088; Wilcoxon rank sum P<3.35E-3, see Methods). (B) Left panel: U2OS osteosarcoma cancer cells invade significantly more upon incubation of 48 hours under hypoxic as compared to normoxic conditions. Right panel: U2OS osteosarcoma cells with ASS1 depletion invade significantly more than control cells following incubation of 48 hours under normoxia. (C) MCF-7 breast cancer cells with ASS1 downregulation are less viable following incubation under hypoxia for 48 hours with either: glutamine free conditions (left panel) or 6-Diazo-5-oxo-L-norleucine (DON ; 50 μM; right panel). (D) MCF-7 breast cancer cells with ASS1 downregulation are less viable following incubation under hypoxia with either: DIDS (300 μM; 24 hours incubation) (upper panel) or S0859 (100 μM; 48 hours incubation) (lower panel). Viability is normalized to non-treated cells (cells grown in the absence of inhibitors). The experiments described in C and D have been performed under pHe 7.4. (E) Illustration of the different metabolic consequences following ASS1 downregulation in normoxia vs. hypoxia or acidity. Unless otherwise specified, we used student’s t-test (2-tail) for statistical analysis. Each graph represents the average of n≥3 experiments ± S.D. *, P ≤ 0.05.

References

    1. Quinonez SC, Thoene JG. Citrullinemia Type I 2014.
    1. Thoene JG. Citrullinemia Type I In: Pagon RA, Adam MP, Bird TD, Dolan CR, Fong CT, Stephens K, editors. GeneReviews Seattle (WA: )2004.
    1. Long Y, Center TUoTMAC, Tsai W-B, wbtsai@mdanderson.org, Pathology TM, Wangpaichitr M, et al. Arginine deiminase resistance in melanoma cells is associated with metabolic reprogramming, glucose dependence, and glutamine addiction. Molecular Cancer Therapeutics 2015;12(11). - PMC - PubMed
    1. Kobayashi E, Masuda M, Nakayama R, Ichikawa H, Satow R, Shitashige M, et al. Reduced argininosuccinate synthetase is a predictive biomarker for the development of pulmonary metastasis in patients with osteosarcoma. Mol Cancer Ther 2010;9(3):535–44. - PubMed
    1. Delage B, Luong P, Maharaj L, O’Riain C, Syed N, Crook T, et al. Promoter methylation of argininosuccinate synthetase-1 sensitises lymphomas to arginine deiminase treatment, autophagy and caspase-dependent apoptosis. Cell Death Dis 2012;3:e342. - PMC - PubMed

Publication types

MeSH terms