. 2019 Feb 20;39(8):1405-1419.
doi: 10.1523/JNEUROSCI.1421-18.2018. Epub 2018 Dec 20.

Prefrontal-Bed Nucleus Circuit Modulation of a Passive Coping Response Set

Affiliations

Prefrontal-Bed Nucleus Circuit Modulation of a Passive Coping Response Set

Shane B Johnson et al. J Neurosci. .

Abstract

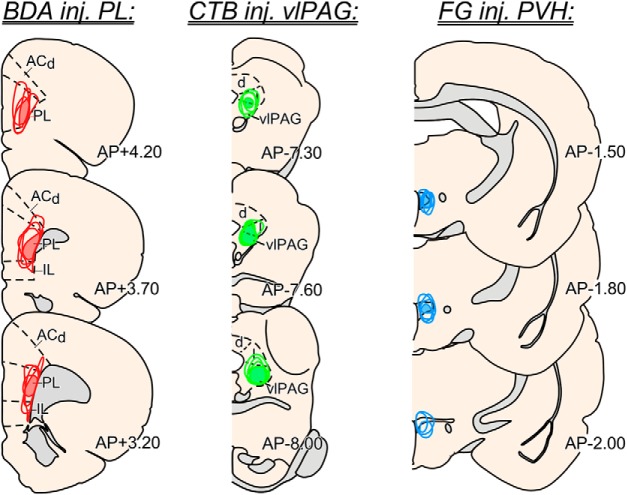
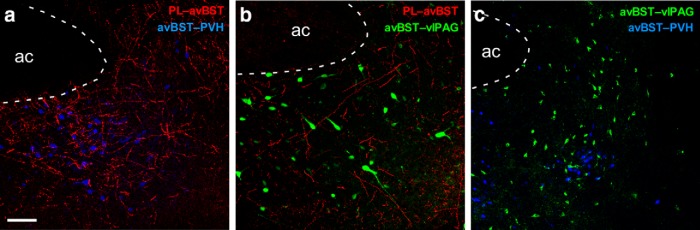
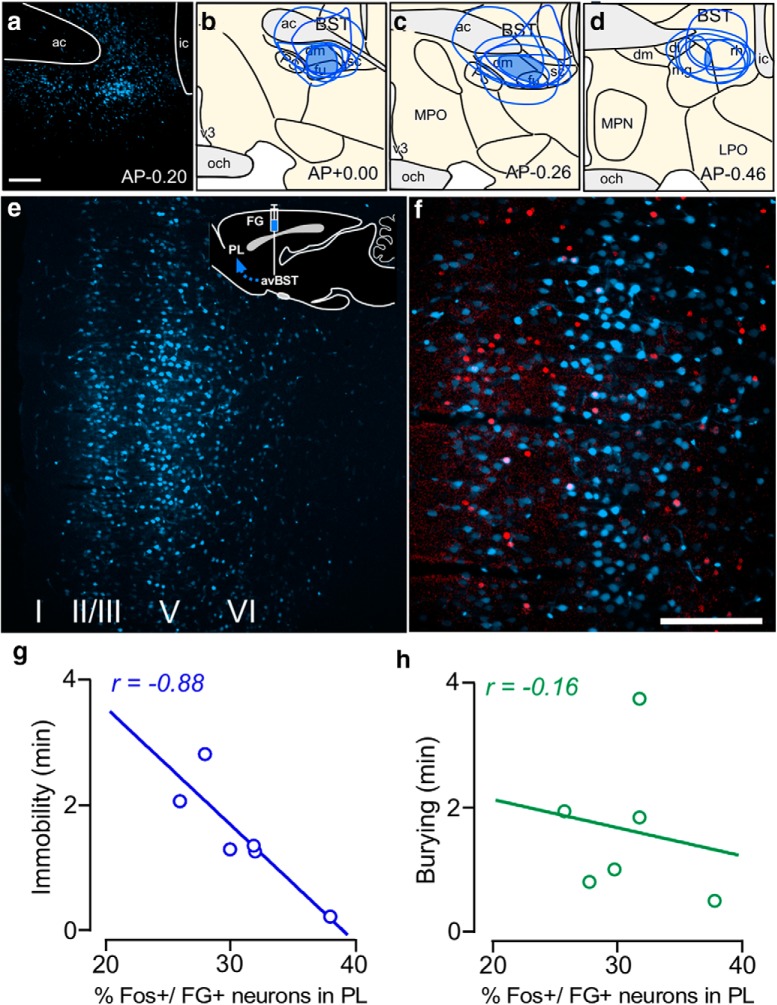
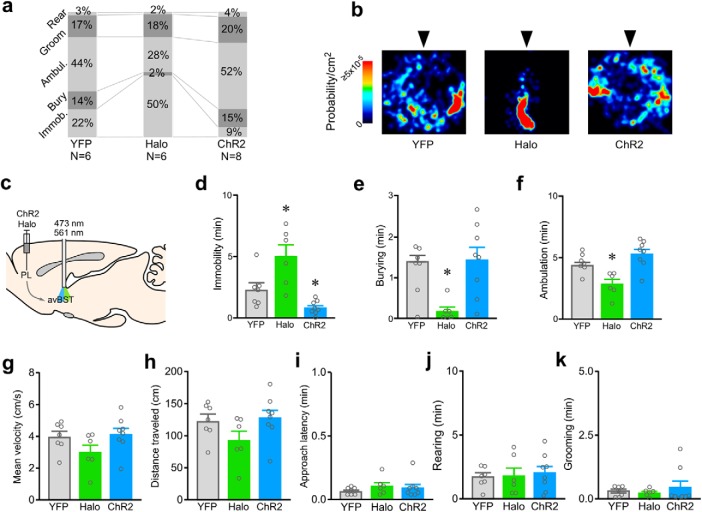
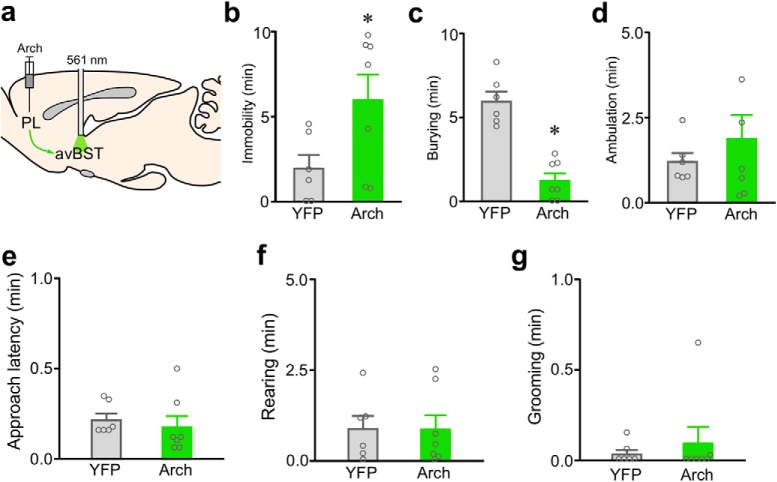
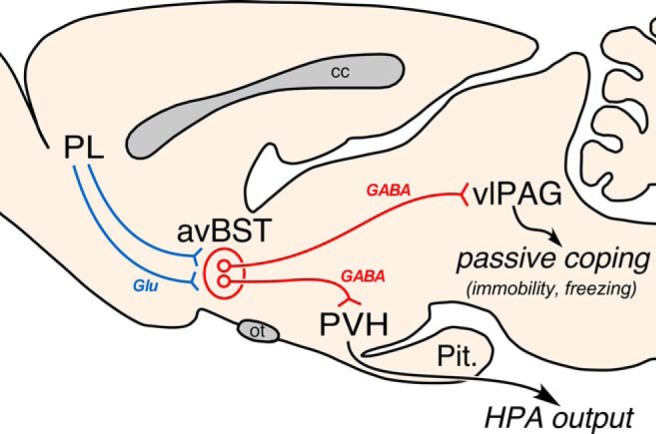
One of the challenges facing neuroscience entails localization of circuits and mechanisms accounting for how multiple features of stress responses are organized to promote survival during adverse experiences. The rodent medial prefrontal cortex (mPFC) is generally regarded as a key site for cognitive and affective information processing, and the anteroventral bed nuclei of the stria terminalis (avBST) integrates homeostatic information from a variety of sources, including the mPFC. Thus, we proposed that the mPFC is capable of generating multiple features (endocrine, behavioral) of adaptive responses via its influence over the avBST. To address this possibility, we first optogenetically inhibited input to avBST from the rostral prelimbic cortical region of mPFC and observed concurrent increases in immobility and hypothalamo-pituitary-adrenal (HPA) output in male rats during tail suspension, whereas photostimulation of this pathway decreased immobility during the same challenge. Anatomical tracing experiments confirmed projections from the rostral prelimbic subfield to separate populations of avBST neurons, and from these to HPA effector neurons in the paraventricular hypothalamic nucleus, and to aspects of the midbrain periaqueductal gray that coordinate passive defensive behaviors. Finally, stimulation and inhibition of the prelimbic-avBST pathway, respectively, decreased and increased passive coping in the shock-probe defensive burying test, without having any direct effect on active coping (burying) behavior. These results define a new neural substrate in the coordination of a response set that involves the gating of passive, rather than active, coping behaviors while restraining neuroendocrine activation to optimize adaptation during threat exposure.SIGNIFICANCE STATEMENT The circuits and mechanisms accounting for how multiple features of responses are organized to promote adaptation have yet to be elucidated. Our report identifies a prefrontal-bed nucleus pathway that organizes a response set capable of gating passive coping behaviors while concurrently restraining neuroendocrine activation during exposure to inescapable stressors. These data provide insight into the central organization of how multiple features of responses are integrated to promote adaptation during adverse experiences, and how disruption in one neural pathway may underlie a broad array of maladaptive responses in stress-related psychiatric disorders.

Keywords: HPA; bed nucleus; passive coping; prelimbic; shock probe defensive burying; ventrolateral periaqueductal gray area.


Figures

Figure 1.
Figure 1.
Characterization of the PL→ avBST pathway. Representative image of AAV injection site (a) and YFP expression in PL projection neurons. Scale bar, 500 μm. b, YFP-expressing PL terminal fields within avBST. Scale bar, 100 μm. c, Confocal fluorescent image of avBST region containing dense YFP-immunoreactive axon fibers and terminals that originate from PL projection neurons following AAV injection in that cortical region d, Confocal fluorescent image from the same region as c showing immunoreactivity for the VGLUT1 in avBST. e, Composite image of overlapping puncta from the preceding panels. Scale bar: (in c) ce, 10 μm. Circuit schematic depicting viral injection site in PL and postsynaptic avBST recording during PL terminal field inhibition (f, Halo, green) and excitation (g, ChR2, blue). h, Raster plot of action potentials in the absence (top, gray) and presence (bottom, green) of constant 561 nm light. i, Raster plot of action potentials in the absence (top, gray) and presence (bottom, blue) of 20 Hz pulses of 473 nm light. j, Summary histogram of data shown in h, indicating that 561 nm illumination (green bar) of Halo-expressing PL terminals decreased avBST unit activity (green line) relative to the no laser condition (gray line). k, Summary histogram of data shown in i, indicating that 20 Hz, 5 ms pulses of 473 nm light (blue bar) of ChR2-expressing PL terminals increased avBST unit activity (blue line) relative to the no-laser condition (gray line).
Figure 2.
Figure 2.
The PL→avBST pathway coordinates behavioral immobility and HPA axis inhibition during inescapable stress. Diagram depicting AAV microinjection into PL and fiber optic placement above avBST (a, top) to assess PL→avBST pathway involvement in responses to 10 min TS stress. PL→avBST pathway inhibition did not affect latency to first bout of immobility (a, bottom). However, the Halo group exhibited increased immobility duration (b), as well as elevated ACTH (c), and CORT (d) levels relative to the YFP control group. c, d, Insets, Integrated ACTH and CORT responses (AUC) were also significantly increased in the Halo versus YFP group. e, Latency to immobility was unchanged, while immobility duration was significantly lower in rats receiving PL→avBST pathway activation with ChR2 compared with YFP control group (f). g, Serial and integrated (AUC, inset) ACTH (g) and CORT (h) levels did not differ between the ChR2 and YFP groups. Data are shown as mean ± SEM. *p < 0.05.
Figure 3.
Figure 3.
Reconstructions of tracer placements from dual tract tracing anatomical experiments. Examples of injection placements are shown for PL using the anterograde tracer biotinylated dextran amine (left, red), injections in ventrolateral PAG using the retrograde tracer cholera toxin b (center, green), and injections in PVH with the retrograde tracer Fluoro-Gold (right, blue). Shaded regions indicate area of overlap common to all tracer injections. Data presented from these experiments were based upon successful placements made in 2 of 3 of these regions; for illustrative purposes N = 4 cases are shown for each site whereby injection placements were judged to be accurate enough for inclusion into the anatomical analysis. ACd, anterior cingulate cortex, dorsal part; vlPAG, ventrolateral periaqueductal gray. Coronal atlas images adapted with permission from Swanson (2004).
Figure 4.
Figure 4.
Anterograde and retrograde tract tracing of PL→avBST pathways. Experiments revealed that PL fibers terminate near avBST neurons that project to either the PVH (a) or ventrolateral PAG (b). c, A dual retrograde tracer experiment revealed that populations of PVH- and ventrolateral PAG-projecting avBST neurons do not display any overlap. Scale bar: (in a) ac, 100 μm.
Figure 5.
Figure 5.
Evidence that avBST projections to PVH and ventrolateral PAG are GABAergic. a, Confocal fluorescent image showing an example of YFP expression after injection of AAV5 centered in avBST. bd, Green shaded regions in avBST indicate areas of overlap common to all tracer injections (N = 4) and their approximate extent of diffusion into adjacent structures. ac, Anterior commissure; dl, dorsolateral subdivision of the avBST; dm, dorsomedial subdivision of the avBST; fu, fusiform subdivision of the avBST; ic, internal capsule; LPO, lateral preoptic area; mg, magnocellular subdivision of the posterior BST; MPN, median preoptic nucleus; MPO, medial preoptic area; och, optic chiasm; PS, parastrial nucleus; rh, rhomboid subdivision of the posterior BST; v3, third ventricle. Scale bars: a, 300 μm; bd, 400 μm. e, Confocal fluorescent images depict immunoreactivity YFP in the medial parvocellular subdivision (mp) of PVH following AAV injection in avBST, and the 65 kDa form of GAD, a synthetic enzyme for GABA (f). g, Composite image of images in e and f, with immunolocalization with CRF (blue somata). Numerous instances of YFP+/GAD+ puncta were noted to make appositions with CRF-labeled neurons (arrowheads). h, In ventrolateral PAG, YFP-immunolabeled terminals are also abundant following AAV injection in avBST. Extensive colocalization between YFP and GAD-65 (i, j) was noted in this region as well (arrowheads). Scale bar: (in e) ej, 5 μm.
Figure 6.
Figure 6.
PL→avBST pathway involvement in passive coping behavior. a, Confocal fluorescent image of an example tracer placement in avBST. bd, Blue shaded regions in avBST indicate areas of overlap common to all tracer injections (N = 6) and their approximate extent of diffusion into adjacent structures. ac, Anterior commissure; dl, dorsolateral subdivision of the avBST; dm, dorsomedial subdivision of the avBST; fu, fusiform subdivision of the avBST; ic, internal capsule; LPO, lateral preoptic area; mg, magnocellular subdivision of the posterior BST; MPN, median preoptic nucleus; MPO, medial preoptic area; och, optic chiasm; PS, parastrial nucleus; rh, rhomboid subdivision of the posterior BST; v3, third ventricle. Scale bars: a, 300 μm; b–d, 400 μm. Rats in eh were subjected to the shock probe defensive burying test for 10 min and perfused 90 min thereafter. e, Inset, Schematic diagram of Fluoro-gold injection site in avBST with arrow indicating retrograde transport of tracer to PL. Retrogradely labeled neurons in PL are displayed in blue and Fos-immunoreactive nuclei in red. Scale bar: (in f) e, f, 100 μm. The number of Fos immunolocalizations in retrogradely labeled PL neurons correlated with the length of time immobile (g) but not with the extent of burying behavior (h).
Figure 7.
Figure 7.
Activity in the PL→avBST pathway bidirectionally modulates passive coping behavior. a, Stacked histograms display the average amount of time that rats in each treatment group spent engaging in different behaviors in the shock probe defensive burying test (SPDB) over the 10 min period following shock. Each column displays average percentages for each category of scored behavior during concurrent laser stimulation of the PL→avBST pathway in YFP control, Halo (inhibition), and ChR2 (activation) groups. b, Heat maps indicate the time spent within the arena over a 10 min period following exposure to shock (probe is indicated by the arrowhead) in a representative example from each treatment group. c, Illustration of AAV-Halo or ChR2 injection into PL and fiber placement above avBST for pathway inhibition or activation during SPDB. d, During the defensive burying test, rats receiving inactivation with Halo exhibited increased immobility (Immob) behavior, whereas pathway activation with ChR2 resulted in significantly less immobility than YFP controls. e, Burying was significantly decreased in the Halo group, but unchanged in ChR2 animals. f, Ambulation (Ambul) was decreased in the Halo group, likely a reflection of increased immobility. During the initial 30 s bout of ambulation following shock, no group differences were observed for either velocity (g) or distance traveled (h) in rats receiving photoinhibition with Halo or photoexcitation ChR2 of the PL→avBST pathway relative to laser-stimulated YFP control rats. No differences were noted in approach latency (i), rearing (j), or grooming (k) behavior as a function of laser stimulation in either YFP, Halo, or ChR2 groups. Data are shown as mean + SEM. *p < 0.025 (Bonferroni correction).
Figure 8.
Figure 8.
Inactivation of the PL→avBST pathway with a different inhibitory opsin (Arch) increases passive, and decreases active coping behaviors. a, Illustration of AAV-Arch injection into PL and fiber placement above avBST for pathway inhibition during shock probe defensive burying test. Rats receiving inactivation with Arch exhibited increased immobility (b), and decreased burying behavior (c), relative to laser-stimulated YFP rats. d, Ancillary measures of ambulation (d), approach latency (e), rearing (f), and grooming (g) did not significantly differ as a function of experimental treatment. Data are shown as mean + SEM. *p < 0.05.
Figure 9.
Figure 9.
Activity in the avBST→ventrolateral PAG pathway is necessary for restraining passive coping responses. a, Diagram of experiment involving AAV microinjection into avBST and illumination of its terminal fields within ventrolateral PAG for inhibition of this pathway during shock probe defensive burying test. Immobility was elevated (b), burying was decreased (c), and ambulation was unchanged (d) for Halo group compared with YFP controls. During the initial 30 s bout of ambulation following shock, no group differences were observed for either velocity (e) or distance traveled (f) in rats receiving inhibition of the PL→avBST pathway. No differences were noted in approach latency (g), rearing (h), or grooming (i) behavior as a function of laser stimulation in either YFP or Halo groups. Data are shown as mean + SEM. *p < 0.05.
Figure 10.
Figure 10.
Summary diagram. Illustration of the PL→avBST pathway and its assembly of a passive coping response set. Axonal projections emanating from rostral PL contact distinct yet intermingled cell populations within avBST that, in turn, issue divergent GABAergic projections to either PVH or ventrolateral PAG. Photoinhibition and excitation of the PL→avBST pathway bidirectionally modulated passive coping behavior via a downstream avBST→vlPAG pathway, whereas photoinhibition augmented HPA output—an effect mediated by a previously described avBST→PVH pathway (Johnson et al., 2016). cc, corpus callosum; glu, glutamate; ot, optic tract; pit., pituitary gland.

Similar articles

Cited by

References

    1. Akana SF, Chu A, Soriano L, Dallman MF (2001) Corticosterone exerts site-specific and state-dependent effects in prefrontal cortex and amygdala on regulation of adrenocorticotropic hormone, insulin and fat depots. J Neuroendocrinol 13:625–637. 10.1046/j.1365-2826.2001.00676.x - DOI - PubMed
    1. Amat J, Baratta MV, Paul E, Bland ST, Watkins LR, Maier SF (2005) Medial prefrontal cortex determines how stressor controllability affects behavior and dorsal raphe nucleus. Nat Neurosci 8:365–371. 10.1038/nn1399 - DOI - PubMed
    1. Assareh N, Sarrami M, Carrive P, McNally GP (2016) The organization of defensive behavior elicited by optogenetic excitation of rat lateral or ventrolateral periaqueductal gray. Behav Neurosci 130:406–414. 10.1037/bne0000151 - DOI - PubMed
    1. Bandler R, Keay KA, Floyd N, Price J (2000) Central circuits mediating patterned autonomic activity during active vs passive emotional coping. Brain Res Bull 53:95–104. 10.1016/S0361-9230(00)00313-0 - DOI - PubMed
    1. Bohus B, Benus RF, Fokkema DS, Koolhaas JM, Nyakas C, van Oortmerssen GA, Prins AJ, de Ruiter AJ, Scheurink AJ, Steffens AB (1987) Neuroendocrine states and behavioral and physiological stress responses. Prog Brain Res 72:57–70. 10.1016/S0079-6123(08)60196-X - DOI - PubMed

Publication types

MeSH terms

Substances