

A resource of variant effect predictions of single nucleotide variants in model organisms
- PMID: 30573687
- PMCID: PMC6301329
- DOI: 10.15252/msb.20188430
A resource of variant effect predictions of single nucleotide variants in model organisms
Abstract
The effect of single nucleotide variants (SNVs) in coding and noncoding regions is of great interest in genetics. Although many computational methods aim to elucidate the effects of SNVs on cellular mechanisms, it is not straightforward to comprehensively cover different molecular effects. To address this, we compiled and benchmarked sequence and structure-based variant effect predictors and we computed the impact of nearly all possible amino acid and nucleotide variants in the reference genomes of Homo sapiens, Saccharomyces cerevisiae and Escherichia coli Studied mechanisms include protein stability, interaction interfaces, post-translational modifications and transcription factor binding sites. We apply this resource to the study of natural and disease coding variants. We also show how variant effects can be aggregated to generate protein complex burden scores that uncover protein complex to phenotype associations based on a set of newly generated growth profiles of 93 sequenced S. cerevisiae strains in 43 conditions. This resource is available through mutfunc (www.mutfunc.com), a tool by which users can query precomputed predictions by providing amino acid or nucleotide-level variants.
Keywords: burden score; genetic variants; genotype‐to‐phenotype; model organisms; resource.
© 2018 The Authors. Published under the terms of the CC BY 4.0 license.
Figures
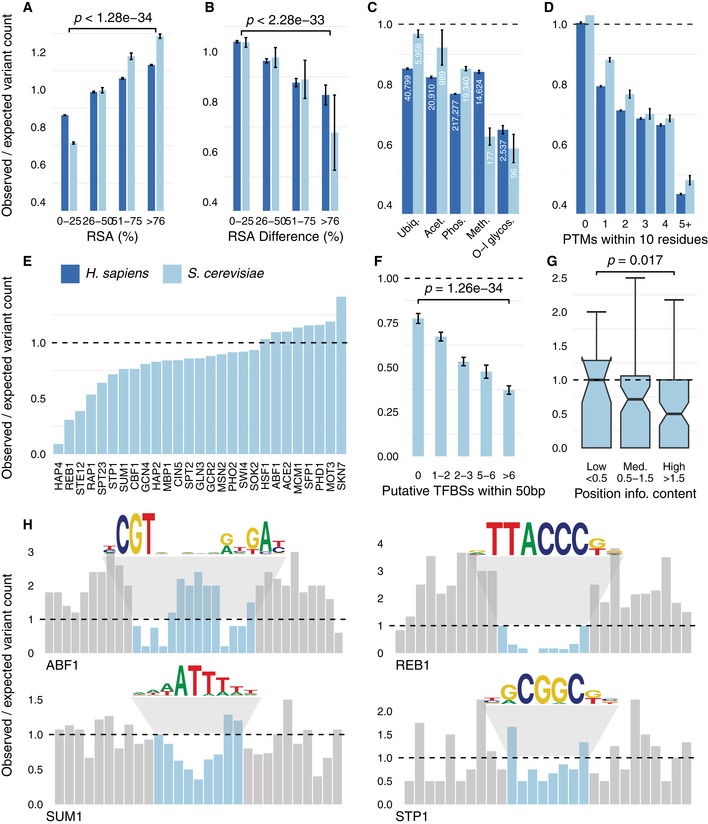
Regions buried within a protein structure with a low RSA typically exhibit higher evolutionary constraint.
Similarly, regions buried within interaction interfaces exhibit a high ∆RSA and demonstrate stronger sequence constraints.
Sequence constraint on PTMs, where numbers reflect the number of PTM sites for each modification.
PTMs with a higher number of neighbouring PTMs show stronger constraint.
Variability in constraint among bindings sites for TFs with at least 40 sites.
TFBSs that coexist with other binding sites are under stronger constraint.
Position‐specific constraint shows that positions of higher relevance for binding in TFs with at least 20 sites are under stronger constraint. Notches represent the 95% CI in the median, box limits the IQR and upper whiskers the 75th percentile. The horizontal line represents the null expectation of no difference between observed and expected, same as in all other panels of this figure.
Four examples where the bar plots reflect the position‐specific constraint in (blue) and around (grey) the binding site, along with sequence logos for the binding specificities.
- A
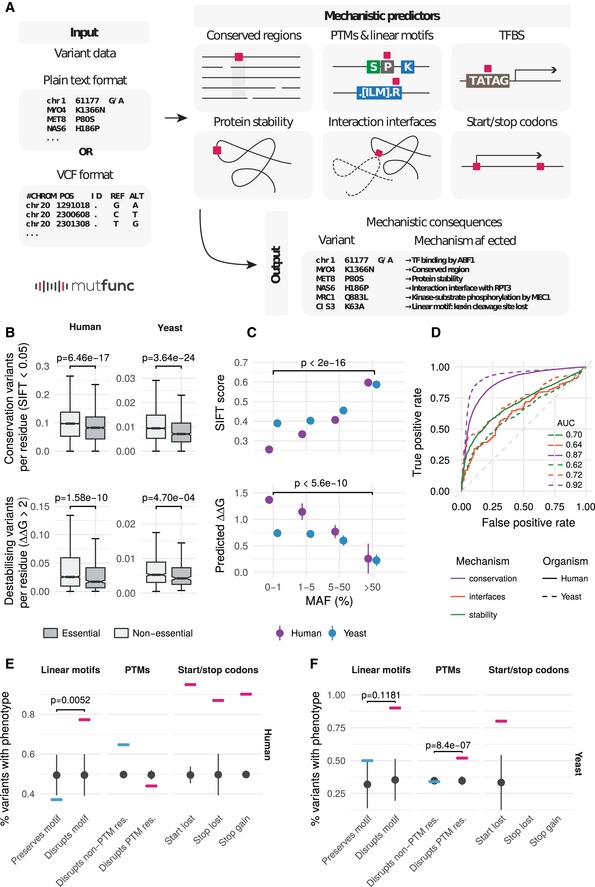
The mutfunc interface provides an intuitive, user‐friendly way by which users can query the resource using DNA or protein substitutions provided in plain text format or the variant call format (VCF). The impact of variants across different mechanisms is provided with information on impact strength in downloadable format and/or protein structural views.
- B
The fraction of variants predicted to affect a conserved or structural important residues for essential and nonessential genes. For yeast SIFT, the number of essential/non‐essential genes are 3,967 and 906, respectively. For yeast foldx the numbers are 925 and 281. For human sift the numbers are 15,542 and 1,575. For human foldx the numbers are 3,702 and 499.
- C
Mean SIFT scores and predicted ∆∆G values for human and yeast variants within different MAF bins. Error bars represent the standard error, and P‐values are calculated based on a one‐sided Wilcoxon test.
- D
Pathogenic and benign variants were obtained for human (from ClinVar) and yeast (curated) as described in the Materials and Methods section. These were used to benchmark the capacity of different predictors to discriminate between known pathogenic and benign variants.
- E, F
The proportion of pathogenic versus benign variants that disrupt or not different functional annotations (SLiMs, PTMs or stop gains/losses) in human (E) and yeast (F). Number of replicates is 100 (i.e. random samples).
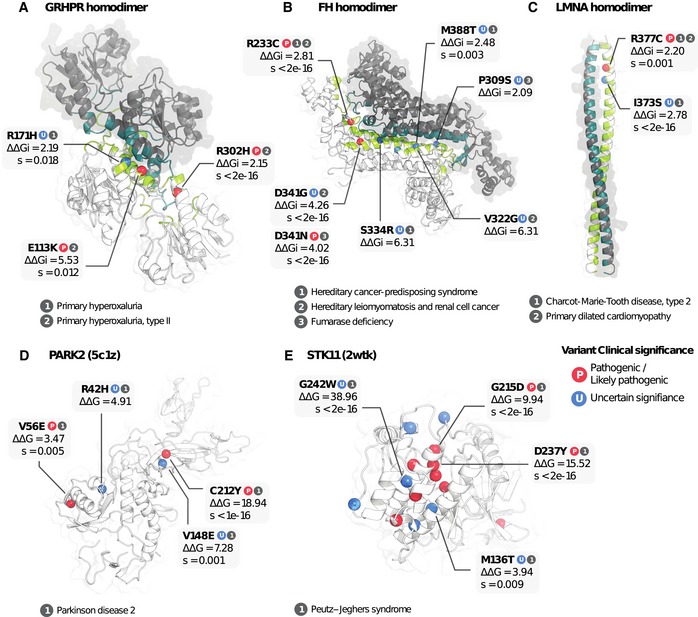
- A–C
Three examples of interaction interfaces containing variants predicted to impact binding stability. Subunits of the interaction complex are coloured in dark grey and white, and respective interface residues in dark green and green.
- D, E
Two examples of variants predicted to impact protein stability. Pathogenic variants are labelled “P” in red, and VUSs “U” in blue.
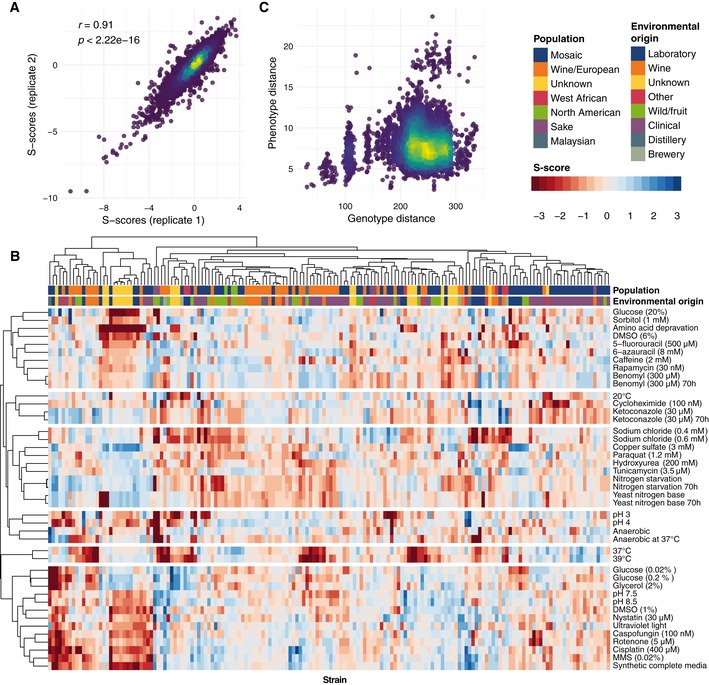
Concordance between replicate s‐score measurements.
Heatmap of s‐scores showing hierarchical clustering of both strains and conditions reveals clusters of phenotypically similar strains and conditions.
Comparison of pairwise genotype and phenotype distances between 93 sequenced strains shows little observable correlation.
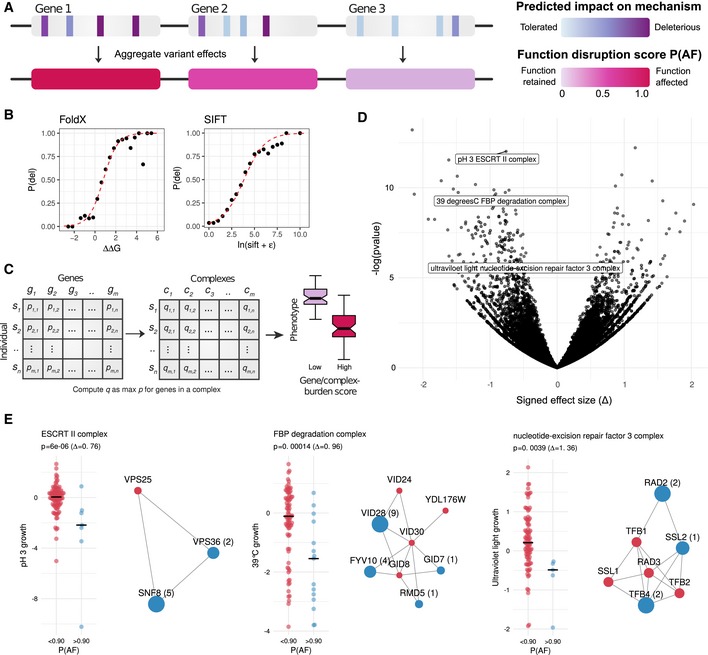
Diagram demonstrating the aggregation of variant impact. Each variant is first assigned a probability of deleteriousness, which are aggregated at the gene level using the maximum impact.
The probability of deleteriousness for FoldX and SIFT was computed by assessing the proportion of deleterious variants in gold‐standard data for FoldX and SIFT. A logistic regression model (red line) is fit to compute subsequent probabilities. Protein complex‐level burden scores were taken to be the maximal burden for any complex member.
Gene and complex burden scores for each strain, gene/complex‐phenotype associations were carried out.
Volcano plot with gene–complex associations highlighting the effect size and P‐value of selected examples.
S‐score growth distributions for strains having a low (P AF < 90, red) or high (P AF > 90, blue) burden scores for three selected complexes. The protein subunits of each complex are shown with affected subunits in blue with the number of strains in which the subunit is predicted to be impaired in parenthesis. Subunits in red are not predicted to be impaired in any strain.
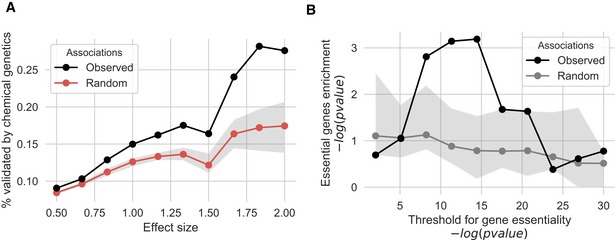
The fraction of gene–phenotype associations that is validated by chemical genetic information derived from gene‐deletion experiments. Shaded area reports the interquartile range over 100 iterations. The significance of the observed overlap was tested using permutation testing.
Associations between protein complexes and conditions were benchmarked by calculating the enrichment of previously known gene‐condition associations from gene‐deletion studies. Shaded area reports the interquartile range over 100 iterations. An enrichment was observed for some cut‐offs for the gene‐deletion condition‐dependent essentiality but only found to be better than random expectation for stringent cut‐off.
Comment in
-
From prioritisation to understanding: mechanistic predictions of variant effects.Mol Syst Biol. 2018 Dec 20;14(12):e8741. doi: 10.15252/msb.20188741. Mol Syst Biol. 2018. PMID: 30573689 Free PMC article.
References
MeSH terms
Grants and funding
LinkOut - more resources
Full Text Sources
Molecular Biology Databases
