. 2018 Dec 20;9(1):5405.
doi: 10.1038/s41467-018-07769-8.

Murine hematopoietic stem cell activity is derived from pre-circulation embryos but not yolk sacs

Affiliations

Murine hematopoietic stem cell activity is derived from pre-circulation embryos but not yolk sacs

Miguel Ganuza et al. Nat Commun. .

Abstract

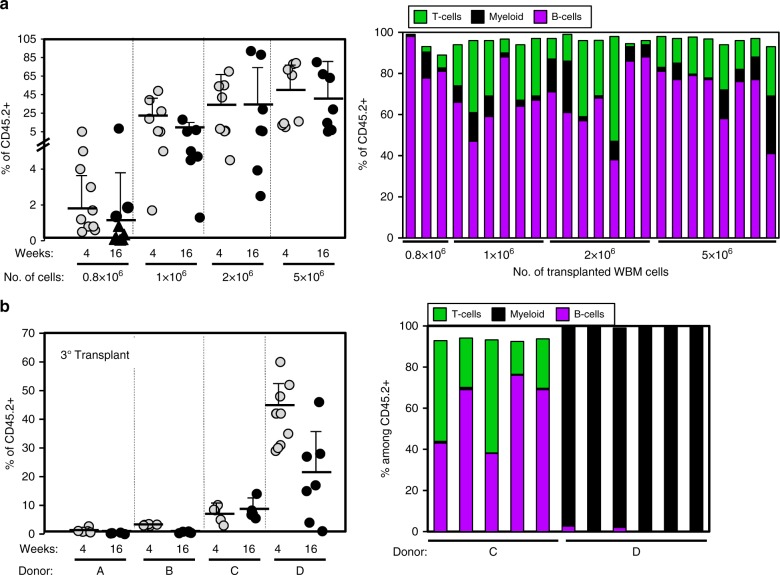
The embryonic site of definitive hematopoietic stem cell (dHSC) origination has been debated for decades. Although an intra-embryonic origin is well supported, the yolk sac (YS) contribution to adult hematopoiesis remains controversial. The same developmental origin makes it difficult to identify specific markers that discern between an intraembryonic versus YS-origin using a lineage trace approach. Additionally, the highly migratory nature of blood cells and the inability of pre-circulatory embryonic cells (i.e., 5-7 somite pairs (sp)) to robustly engraft in transplantation, even after culture, has precluded scientists from properly answering these questions. Here we report robust, multi-lineage and serially transplantable dHSC activity from cultured 2-7sp murine embryonic explants (Em-Ex). dHSC are undetectable in 2-7sp YS explants. Additionally, the engraftment from Em-Ex is confined to an emerging CD31+CD45+c-Kit+CD41- population. In sum, our work supports a model in which the embryo, not the YS, is the major source of lifelong definitive hematopoiesis.


Conflict of interest statement

The authors declare no competing interests.

Figures

Fig. 1
Fig. 1. Pre-circulation embryos but not YS yield robust dHSC activity.
a Experimental schematic. Em and YS were dissected from E8-E8.5 (2–7sp) concepti and cultured as explants at the air-liquid interface for 9–10 days. Explants were then harvested, dissociated and transplanted at ≥four embryo equivalent (e.e.)/recipient. b Left panel: CD45.2+ (i.e., 2–3sp Em-Ex (n = 7), 5–7sp Em-Ex (n = 11), 2–3sp YS-Ex (n = 5) or 5–7sp YS-Ex (n = 11)) contribution to PB of primary recipients. Data pooled from 16 independent experiments. Generally, tissues from one independent litter were transplanted per experiment. For 2–3sp explants, all YS-Ex (n = 5) were transplanted in parallel with Em-Ex isolated from the same concepti. For 5–7sp explants, all YS-Ex (n = 11) were transplanted in parallel with at least one Em-Ex isolated from the same concepti as a positive control for engraftment (**p < 0.01, eWrs-test). Right panel: Frequency of myeloid cells, T cells and B cells in CD45.2+ PB and representative flow cytometry plots of primary recipients of 2–3sp and 5–7sp Em-Ex 16 weeks post-transplant. Each column represents an independent recipient. For the 5–7sp Em-Ex, only the engrafted mice are shown (n = 9). c CD45.2+ YS were isolated from E8.5 (5–7sp, n = 8 recipients), E9.5 (19–22sp, n = 3 recipients), E10.5 (32–36sp, n = 3 recipients) or E11.5 (46–47sp, n = 7 recipients) concepti, cultured as explants for five or seven days and then transplanted at eight ee/recipient. Data pooled from five independent experiments. (*p < 0.05, eWrs-test). d YS-Ex and Em-Ex were isolated from CD45.2+ E9.5 (19–22sp) concepti and cultured under the same conditions as in b for five (n = 3 recipients), seven (n = 6 recipients) or 10 days (n = 3 recipients) before transplantation into lethally irradiated recipients at eight ee/recipient. Statistical differences between Em-Ex and YS-Ex are indicated (**p < 0.01, *p < 0.05, #p < 0.1, two-sample t-test and eWrs-test). bd %CD45.2+ PB (i.e., YS-Ex or Em-Ex-derived) was examined in recipients four and 16 weeks post-transplantation. Each circle represents an independent recipient. For all panels, gray or pink and black or red circles indicate four and 16 weeks post-transplant, respectively. Means and standard deviations are shown. Source data are provided as a Source Data file
Fig. 2
Fig. 2. Pre-circulation Em-Ex display serially transplantable multi-lineage potential.
a Left panel: Total WBM was isolated from three primary recipients of CD45.2+ 5–7sp Em-Ex-derived cells and transplanted separately into three secondary cohorts of lethally irradiated CD45.1+CD45.2+ recipients. Mice received 0.8 × 106 (n = 9), 1 × 106 (n = 7), 2 × 106 (n = 8) or 5 × 106 (n = 8) total WBM cells. Data pooled from three independent experiments is shown. Non-engrafted mice are depicted as triangles. Means are shown. Error bars denote standard deviation. Right panel: Frequency of myeloid cells, T cells and B cells in CD45.2+ PB of secondary recipients of 5–7sp Em-Ex 16 weeks post-transplant. b 5 × 106 WBM cells from secondary recipients of 5–7sp Em-Ex were transplanted into CD45.1+CD45.2+ mice along with 2 × 105 CD45.1+ WBM cells. Bone marrow from n = 4 independent secondary recipients were transplanted into independent cohorts of tertiary recipients. Secondary donors A, B, and C derived from the same initial primary recipient. Secondary donor D derived from an independent primary recipient. Left panel: %CD45.2+ tertiary recipient PB cells. Four (white circles) and 16 (black circles) weeks post-transplant. Donors A, B, and C (n = 5 recipients); Donor D (n = 10 recipients). Each circle indicates an independent tertiary recipient. Means and standard deviations are depicted. Right panel: Frequency of myeloid cells, T cells and B cells in CD45.2+ PB of tertiary recipients 16 weeks post-transplant. Each column corresponds to an independent recipient. Source data are provided as a Source Data file
Fig. 3
Fig. 3. HSC potential is restricted to CD31+CD45+c-Kit+CD41 embryo explant cells and requires SCF and IL-3.
a Experimental schematic. Embryos isolated from E8.5 (5–7sp) concepti were cultured as in Fig. 1b, dissociated and fractionated by FACS based on CD31, CD45, and c-Kit cell surface expression and then transplanted at four ee/recipient into lethally irradiated CD45.1 + CD45.2 + recipients along with 2 × 105 CD45.1+ WBM cells. b Representative flow cytometry plots denoting sorted and transplanted populations (A: CD31+CD45+c-Kit+CD41+; B: CD31+CD45+ c-Kit+CD41; C: CD31+CD45+c-Kit). c %CD45.2+ PB of recipients at four (light-colored circles) and 16 weeks (dark-colored circles) post-transplant. Each circle represents an individual recipient. Five independent experiments are depicted. In each experiment all sorted cells for each population were transplanted into one separate recipient. Engraftment was only detected upon transplantation of population B. d Experimental schematic. E8.5 (5–7sp) YS-Ex and Em-Ex were cultured at the air-liquid interface for 9–10 days in different combinations of SCF, FLT3L and IL-3 and either analyzed by flow cytometry or transplanted to test for dHSC. e Cultured explants were analyzed by flow cytometry for CD31+CD45+ and CD31+CD45+c-Kit+CD41cells after 5 (n = 2, with the exception of Em-Ex SCF + IL-3 + FLT3L + , Em-Ex SCF + IL-3 + and Em-Ex IL-3 + FLT3L + where n = 3) or 10 days of culture (n = 3, with the exception of Em-Ex SCF + IL-3 + FLT3L + , Em-Ex SCF + IL-3 + and Em-Ex IL-3 + FLT3L + where n = 4). Each circle represents an individual culture. Bars stand for average. Results from four independent experiments are shown. Left panel: Em-Ex-explants. Right panel: YS-Ex. Statistical differences with the SCF + Flt3l + IL-3 + control are indicated: (*p < 0.05 and **p < 0.01, two-sample t-test). f CD45.2+ Em-Ex were transplanted into lethally irradiated CD45.1+CD45.2+ recipients at four ee/recipient along with 2 × 105 CD45.1+ WBM cells. %CD45.2+ PB four (gray circles) and 16 weeks (black circles) post-transplant is shown. Each circle represents an individual recipient. Cumulative data from 13 independent experiments. The majority of the analyzed conditions yielded an engraftment that was marginally statistically higher than the No-Growth Factor condition (**p < 0.01, *p < 0.05, #p < 0.1; eWrs-test and two-sample t-test). Horizontal bars indicate averages. Error bars denote standard deviation. Source data are provided as a Source Data file
Fig. 4
Fig. 4. scRNAseq analysis identifies a rare HSC-like population specific to embryo explant cultures.
a Limiting dilution transplantation of Em-Ex cells. One, two or three embryo equivalents were transplanted/recipient. Data pooled from three independent experiments. Left panel: Experimental schematic. Middle panel: %CD45.2+ PB of recipients at 16 weeks post-transplant. Each circle represents an individual recipient. Red circles highlight non-engrafted recipients. The number of mice engrafted/number of recipients at each cell dose is shown. Right panel: χ2 analysis revealed a fit to the limiting dilution model (p-value = 0.717; t-test). The Log of the non-responding fraction is shown for each cell dose. b Representative FACS plots showing sorting strategy for CD31+CD45+c-Kit+CD41 cells in YS-Ex and Em-Ex after 10 days of culture. 49 E8.5 concepti (5–7sp) were dissected, cultured and cells of interest collected by FACS. Post-sort purity check of sorted populations are shown. c Single cell global gene expression analysis of Em-Ex- and YS-Ex-CD31+CD45+c-Kit+CD41 cells. Projection of single cell gene expression profiles onto tSNE1 (X-axis) versus tSNE2 (Y-axis) with Em-Ex cells in pink and YS-Ex cells in blue. X denotes the Em-Ex sub-population circled in red. (n = 3504 Em-Ex cells; n = 3037 YS-Ex cells) d Maturation stage analysis. Identified population was compared to available profile expression datasets on embryonic pre-HSC and HSC from Zhou et al.. Assignment of cultured YS-Ex, Em-Ex and X-cells to embryonic hematopoietic populations. From the AGM: E11_EC (E11-Endothelial cells; CD31+VE-cadherin+CD41CD43CD45Ter119); E11_T1 (E11-pre-HSCs; CD31+CD45CD41lowc-Kit+ CD201high); E11_T2_CD201neg (E11-pre-HSCs; CD31+CD45CD41lowc-Kit+CD201); E11_ T2 (E11-AGMCD31+CD45+CD41low CD201high); from the fetal liver, E12.5_FL (HSCs, LinSca-1+Mac-1lowCD201+; E14.5_FL (HSC, CD45+CD150+CD48CD201+); and Adult HSC (BM-HSC, CD45+CD150+CD48CD201+). e Volcano plot of differentially expressed genes between E11_T2 and E12.5_FL. Downregulated genes are shown in blue and upregulated in red, (FDR<0.05 and Log2 fold change <−2 or >2, respectively. f Pattern of the 80 most differentially expressed genes in X-population. Source data are provided as a Source Data file
Fig. 5
Fig. 5. LYVE1 is expressed by E9.5-E10.5 putative hematopoietic progenitors in embryonic and YS tissues.
a Left panel: Schematic of Lyve1eGFP-hCre knock-in allele (Lyve1Cre). Adapted from ref. . Middle panel: Schematic of the Rosa26mTmG allele. The membrane-targeted tandem dimer tomato (mT) protein is expressed from the unrecombined allele under the chicken β-actin core promoter with a CMV enhancer (pCA). Cre expression excises the mT cassette and results in expression of the membrane-targeted enhanced green fluorescent protein (mG). mT protein pA indicates polyadenylation sequences and black triangles are loxP sites. Right panel: Schematic of ROSA26Confetti allele. Unrecombined allele does not yield the expression of any fluorescent protein. Cre recombinase expression results in a two-steps recombination event that renders the expression of one of the four Confetti-colors (GFP, YFP, RFP, or CFP). b Left panel: %recombination (i.e., GFP+) in Lyve1+/CreRosa26+/mTmG PB at 2 months of age (n = 8). Right panel: %recombination (i.e., %Confetti + ) inLyve1+/CreRosa26+/Confetti PB (n = 8). Labeling efficiencies of total white blood cells, B-cells, T-cells and myeloid cells are shown. Average is depicted (error bars indicate ± s.d. of mean). cd Cell surface expression of LYVE1 in YS and embryos dissected from freshly isolated E9.5 (19–22sp) concepti (n = 14). c Representative flow cytometry plots. d The absolute number/concepti and frequency as a percent of total live events of LYVE1low and LYVE1high cells within the VE-Caderin+CD31+CD41+c-Kit+ compartment is shown. Two independent litters were analyzed. ef LYVE1 expression in freshly isolated E10.5 (32–36sp) concepti (n = 20). The absolute number/concepti and frequency as a percent of total live events of LYVE1low and LYVE1high cells within VE-Caderin+CD31+CD41lowc-Kit+ cells is shown. Three independent litters were analyzed. Each circle represents an independent YS or embryo. Means and standard deviations are shown. (***p < 0.001, two sample t-test and eWrs-test; differences held even after multiple testing corrections to control a FDR of 0.05). Source data are provided as a Source Data file
Fig. 6
Fig. 6. LYVE1 is expressed by both yolk sac and embryo cells at E8.5.
a Representative flow cytometry plots of LYVE1 expression in freshly isolated E8.5 (5–7sp) embryos and YS. b Cell surface expression of LYVE1 in YS and embryos dissected from freshly isolated E8.5 (5–7sp) concepti (n = 16). The absolute number per concepti and frequency as a percent of total live events of LYVE1low and LYVEhigh cells is shown. Each circle represents an independent YS or embryo. c Frequency of CD41+ cells as a percent of total live events of LYVE1low and LYVEhigh cells is shown (n = 16) for embryos and YS. ac Two independent litters were analyzed. (***p < 0.001, two-sample t-test for LYVE1low and eWrs-test LYVEhigh; differences held even after multiple testing corrections to control a FDR of 0.05). Means are shown. Error bars denote standard deviation. d Representative confocal images showing the pattern of expression of LYVE1 in E8.5 embryos and YS. Two independent embryos are shown. For each representative embryo an inset zoomed on one of the paired aortas is also shown. Anti-LYVE1 conjugated to CFTM568 is shown in red and anti-CD31BV421 is shown in blue. Scale bars stand for 50 µm for the low magnification (i and iii) and 10 µm for the high magnification (ii and iv). Schematics indicate anatomical parts: FG: foregut; A: paired-aorta; NT: Neural tube. Source data are provided as a Source Data file
Fig. 7
Fig. 7. Blood precursors emerge from intra-embryonic LYVE1+ cells at the onset of the heartbeat.
a Experimental schematic. YS and embryos dissected from CD45.2+ E8.5 (5–7sp) Lyve1+/CreRosa26+/mTmG concepti were either analyzed by flow cytometry for Lyve1-Cre-dependent labeling (GFP+ cells), cultured as explants for 10 days to examine Lyve1-Cre-dependent labeling in emerging hematopoietic populations or transplanted. bg Flow cytometry analysis and confocal microscopy of freshly isolated E8.5 (5–7sp) Lyve1+/CreRosa26mTmG YS and embryos. Non-recombined Rosa26+/mTmG cells are tdTomato+ and recombined Rosa26+/mTmG cells are GFP+. b Representative flow cytometry plots. c Average % recombination (i.e., GFP+) of total YS or embryo cells. (n = 14) from three independent litters. d % of total GFP+ cells expressing CD41. e %CD41+ in total cells. f % recombination (i.e., GFP+) in CD41+ cells. g Representative confocal microscopy images. GFP (green), tdTomato (red). Endothelial cells (blue, labeled by anti-CD31-BV421). An inset of a paired-aorta is shown. Scale bars: 50 µm and 10 µm. Schematics: A: paired-aorta; NT: Neural tube. hi Flow cytometry analysis of E8.5 (5–7sp) Lyve1+/CreRosa26mT/mG YS-Ex and Em-Ex after 10 days of culture. h Representative flow cytometry analysis of tdTomato and GFP labeling in YS-Ex and Em-Ex-derived CD31+CD45+c-Kit+CD41 cells. I Quantification of Lyve1-Cre dependent GFP labeling in CD31+CD45+c-Kit+CD41 cells. Each dot represents an independent conceptus. Bars represent average %recombination (n = 12) from three independent litters. jl PB of recipients transplanted with cultured E8.5 (5–7sp) or E9.5 (19–22sp) Lyve1+/CreRosa26mT/mG Em-Ex or YS-Ex. j Representative flow cytometry plots of recipient PB. tdTomato and GFP labeling is shown. k % Explant-derived PB, estimated as the sum of the % of tdTomato+ and % of GFP+ cells in the PB. Each circle represents an independent recipient. l %Lyve1-Cre dependent GFP labeling estimated as %GFP+ amongst % of Explant-derived PB cells is shown. Each circle represents an independent mouse transplanted with four ee of E8.5 CD45.2+ Lyve1+/CreRosa26mTmG cultured Em-Ex (n = 4) in three independent experiments or one ee of E9.5 CD45.2+ Lyve1+/CreRosa26mTmG cultured Em-Ex (n = 10) or YS-Ex (n = 6) in other three independent experiments. (*p < 0.05; ***p < 0.001; eWrs-test). Means and standard deviations are shown. Source data are provided as a Source Data file

Similar articles

Cited by

References

    1. Medvinsky A, Rybtsov S, Taoudi S. Embryonic origin of the adult hematopoietic system: advances and questions. Development. 2011;138:1017–1031. doi: 10.1242/dev.040998. - DOI - PubMed
    1. Muller AM, Medvinsky A, Strouboulis J, Grosveld F, Dzierzak E. Development of hematopoietic stem cell activity in the mouse embryo. Immunity. 1994;1:291–301. doi: 10.1016/1074-7613(94)90081-7. - DOI - PubMed
    1. Medvinsky A, Dzierzak E. Definitive hematopoiesis is autonomously initiated by the AGM region. Cell. 1996;86:897–906. doi: 10.1016/S0092-8674(00)80165-8. - DOI - PubMed
    1. Moore MA, Owen JJ. Chromosome marker studies on the development of the haemopoietic system in the chick embryo. Nature. 1965;208:956. doi: 10.1038/208956a0. - DOI - PubMed
    1. Moore MA, Owen JJ. Chromosome marker studies in the irradiated chick embryo. Nature. 1967;215:1081–1082. doi: 10.1038/2151081a0. - DOI - PubMed

Publication types