. 2018 Dec 20;9(1):5402.
doi: 10.1038/s41467-018-07823-5.

High-resolution acoustophoretic 3D cell patterning to construct functional collateral cylindroids for ischemia therapy

Affiliations

High-resolution acoustophoretic 3D cell patterning to construct functional collateral cylindroids for ischemia therapy

Byungjun Kang et al. Nat Commun. .

Abstract

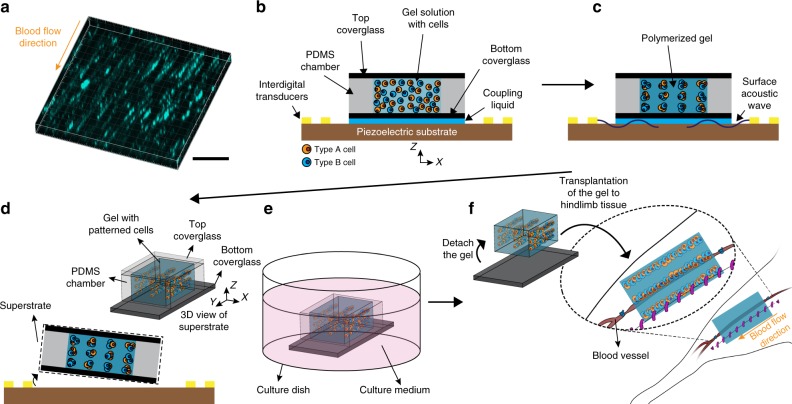
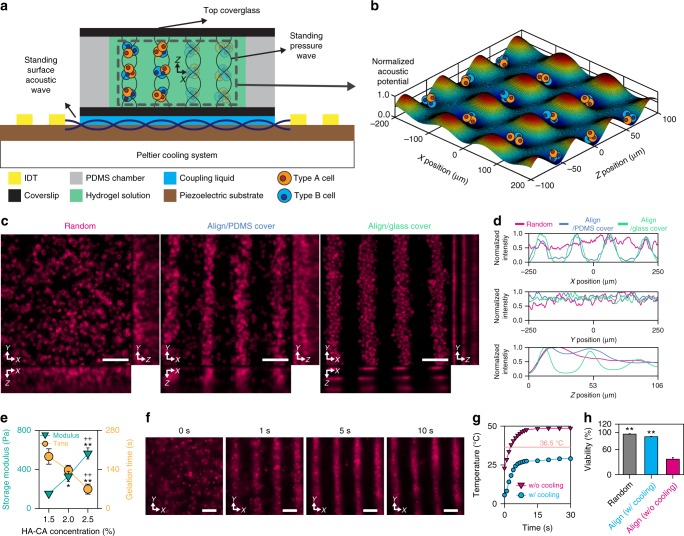
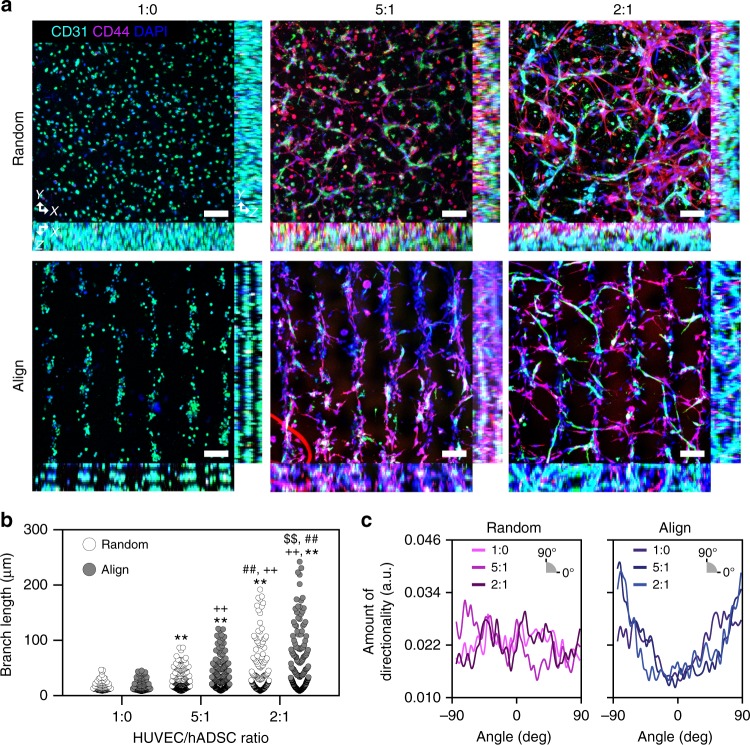
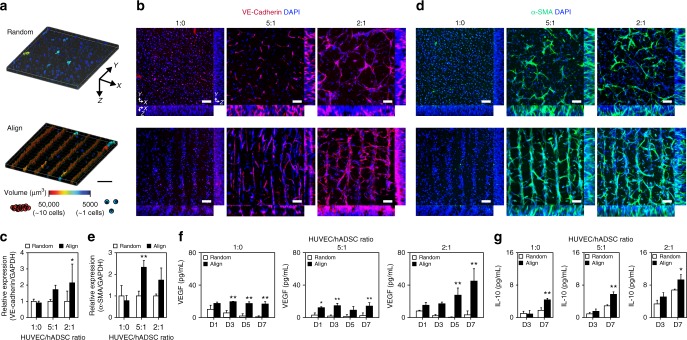
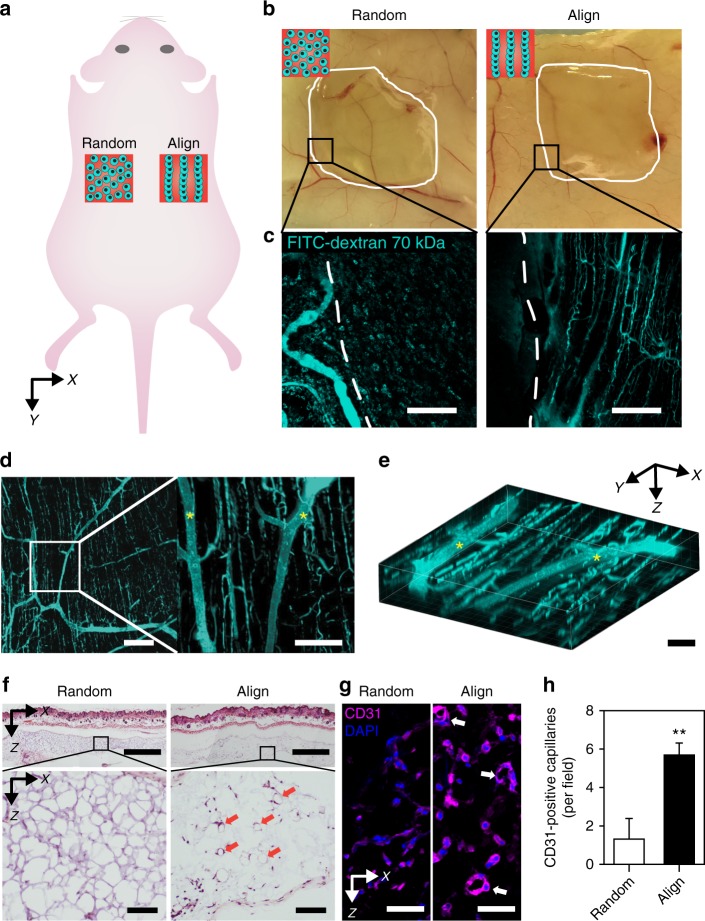
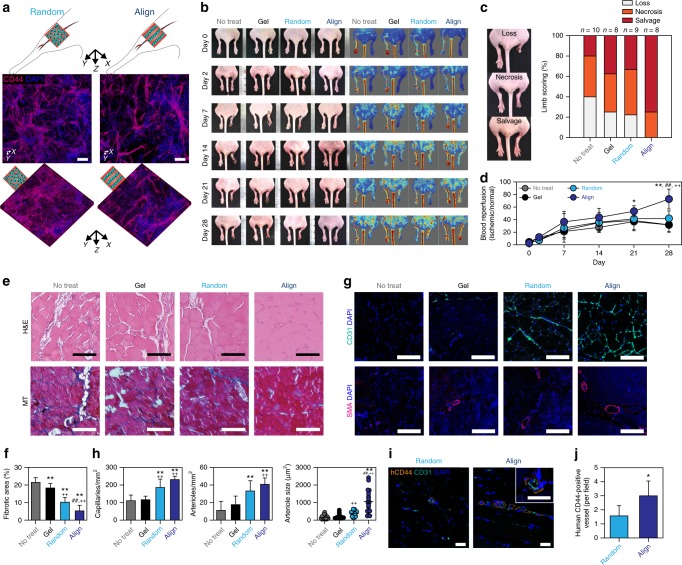
The fabrication of functional tissues is essential for clinical applications such as disease treatment and drug discovery. Recent studies have revealed that the mechanical environments of tissues, determined by geometric cell patterns, material composition, or mechanical properties, play critical roles in ensuring proper tissue function. Here, we propose an acoustophoretic technique using surface acoustic waves to fabricate therapeutic vascular tissue containing a three-dimensional collateral distribution of vessels. Co-aligned human umbilical vein endothelial cells and human adipose stem cells that are arranged in a biodegradable catechol-conjugated hyaluronic acid hydrogel exhibit enhanced cell-cell contacts, gene expression, and secretion of angiogenic and anti-inflammatory paracrine factors. The therapeutic effects of the fabricated vessel constructs are demonstrated in experiments using an ischemia mouse model by exhibiting the remarkable recovery of damaged tissue. Our study can be referenced to fabricate various types of artificial tissues that mimic the original functions as well as structures.


Conflict of interest statement

The authors declare no competing interests.

Figures

Fig. 1
Fig. 1
Fabrication of tissue construct with cells patterned using SSAW for ischemia therapy. a Fluorescent image of 70 kDa FITC-dextran in collateral vessels in mouse hindlimb tissue. Scale bar = 200 μm. b Injection of HA-CA hydrogel/cell mixture solution into a PDMS chamber on a piezoelectric substrate. c 3D cell patterning in gel solution using surface acoustic waves. d Disassembly of the superstrate of the hydrogel with patterned cells from the piezoelectric substrate. e Culturing hydrogel-cell constructs in medium. f Detachment of hydrogel constructs with patterned cells from the glass and transplantation of the constructs into the mouse hindlimb. The size of construct for in vivo experiments is 6, 10, and 0.53 mm in X, Y, and Z directions, respectively. For in vitro experiments, the size of construct is 6, 6, and 0.53 mm in X, Y, and Z directions, respectively
Fig. 2
Fig. 2
Acoustophoretic tissue fabrication system. a SSAW system consisting of a piezoelectric substrate, a PDMS chamber, a Peltier cooling system, and two glass coverslips designed to create a pattern of multi-type cells in a 3D hydrogel matrix. b 3D plot of the acoustic potential field normalized by the maximum value in the center region of the solution. c XY, YZ, and XZ projection images from confocal micrographs of DiI-stained cells in hydrogels from the Random group, Align/PDMS cover group and Align/glass cover group. Scale bars = 100 μm. d Normalized fluorescence intensity of cells in the X, Y, and Z directions in the gel. e Storage modulus at 1 Hz (cyan triangle, n = 3) and gelation time (orange circle, n = 4) of HA-CA hydrogel at various concentrations (technical repeats = 2, *p < 0.05 and **p < 0.01 versus 1.5% HA-CA group and ++p < 0.01 versus 2.0% HA-CA group, via one-way ANOVA followed by Tukey’s multiple comparisons test). f Time-lapse images of DiI-stained cells patterned by the SSAW system in 2% HA-CA hydrogel at an input voltage of 90 mVrms. Scale bars = 100 μm. g Change in temperature of 2% HA-CA hydrogel solution during the application of the SSAW with (blue circle) and without (magenta triangle) the cooling system. h Cell viability of random and aligned cells in hydrogels prepared with and without the cooling system (n = 3–4, technical repeats = 3, **p < 0.01 versus Align without cooling group, via one-way ANOVA followed by Tukey’s multiple comparisons test). Error bars represent one standard deviation
Fig. 3
Fig. 3
SSAW-induced 3D cell patterning for the recapitulation of microvessels in hindlimb muscle. a Dual immunofluorescence staining of CD31 for HUVECs and CD44 for hADSCs at various HUVEC/hADSC ratios (1:0, 5:1, 2:1—total cell density: 1 × 10⁷ cells ml−1) 1 week after cultivation (technical repeats = 3). Scale bars = 100 μm. Fluorescent image-based quantification of b HUVEC elongation (n = 92–247) and c elongated direction using CD31-stained images (technical repeats = 2, **p < 0.01 versus 1:0 Random group, ++p < 0.01 versus 1:0 Align group, ##p < 0.01 versus 5:1 Random group, and $$p < 0.01 versus 2:1 Random group, via one-way ANOVA followed by Tukey’s multiple comparisons test)
Fig. 4
Fig. 4
Effects of enhanced cell–cell contact in the fabricated cell-hydrogel construct on vessel maturation. a Reconstructed 3D images of contacting cells within the hydrogel. Scale bar = 150 μm. b Representative fluorescent images showing the expression of the EC-specific cell junction marker VE-cadherin at various HUVEC/hADSC ratios (1:0, 5:1, 2:1—total cell density: 1 × 10⁷ cells ml−1) (technical repeats = 3). Scale bars = 100 μm. c qPCR analysis to quantify the expression of VE-cadherin in aligned/randomly distributed cells within the hydrogel (n = 3–6, technical repeats = 2, *p < 0.05 versus each Random group, via two-way ANOVA followed by Sidak’s multiple comparisons test). d Immunofluorescence staining of cell-hydrogel constructs with the mural cell marker α-SMA (technical repeats = 3). Scale bars = 100 μm. e qPCR analysis to quantify the expression of α-SMA in aligned/randomly distributed cells within the hydrogel (n = 3–6, technical repeats = 2, **p < 0.01 versus each random group, via two-way ANOVA followed by Sidak’s multiple comparisons test). f ELISA analysis of VEGF secretion by aligned/randomly distributed cells in hydrogels at days 1, 3, 5, and 7 (n = 3, technical repeats = 2, *p < 0.05 and **p < 0.01 versus each Random group, via two-way ANOVA followed by Sidak’s multiple comparisons test). g ELISA analysis of IL-10 secretion by aligned/randomly distributed cells in hydrogels at days 3 and 7 (n = 3–4, technical repeats = 2, *p < 0.05 and **p < 0.01 versus each Random group, via two-way ANOVA followed by Sidak’s multiple comparisons test). Error bars represent one standard deviation
Fig. 5
Fig. 5
Integration of patterned microvessels with the host vasculature in transplantation. a Schematic illustration showing the transplantation of randomly distributed and aligned cell-hydrogel constructs into the subcutaneous space of the mouse back. b Gross view of harvested back-skin tissues with cell-hydrogel constructs 1 week after transplantation. c Fluorescent images of 70 kDa FITC-dextran-perfused vessels in one part of the image (b). Scale bars = 200 μm. Representative d 2D images and e 3D image of FITC-dextran-labeled vessels in transplanted 3D-aligned cell-hydrogel constructs (HUVEC/hADSC ratio at 2:1—total cell density: 1.2 × 10⁷ cells ml1) 1 week after transplantation. The asterisks indicate infiltrated host vessels. Scale bars = 200 μm for the left image of d, 100 μm for the right image of d, and 50 μm for e. f H&E-stained images of cross-sectioned 3D cell-hydrogel constructs with adjacent skin tissue 1 week after transplantation. Red arrows indicate vessel-like structures. Scale bars = 500 μm (upper image) and 200 μm (lower image). g Immunofluorescence staining of CD31 in a 3D cell-hydrogel construct 1 week after transplantation. White arrows indicate CD31-positive capillaries with lumen structure. Scale bars = 50 μm. h Quantification of CD31-positive capillary density in a 3D cell-hydrogel construct 1 week after transplantation (n = 3, technical repeats = 2, **p < 0.01 versus Random group, via unpaired t-test). Error bars represent one standard deviation
Fig. 6
Fig. 6
Enhanced therapeutic angiogenesis via transplantation of the fabricated cell-hydrogel construct. a Immunofluorescence staining of CD44 for determining the maintenance of cell alignment in retrieved cell-hydrogel constructs (HUVEC/hADSC ratio at 2:1—total cell density: 1.2 × 10⁷ cells ml−1) 3 days after transplantation into ischemic hindlimb of mouse. Scale bars = 100 μm. b Representative serial photographs (left) and blood perfusion images (right) of ischemic hindlimb at days 0, 2, 7, 14, 21, and 28 after cell transplantation. c Scoring for the physiological status of ischemic limbs on day 28. d Quantification of the relative blood perfusion rate of ischemic limb to normal limb in each group (n = 7–8, technical repeats = 2, *p < 0.05 and **p< 0.01 versus No-treatment group, ++p < 0.01 versus Gel group, and ##p < 0.01 versus Random group, via two-way ANOVA followed by Sidak’s multiple comparisons test). e H&E (upper) and Masson’s trichrome (lower) staining of the cross-sectioned ischemic muscles 28 days after cell transplantation. Scale bars = 100 μm. f Quantification of fibrotic area in the ischemic site (n = 10, technical repeats = 2, **p < 0.01 versus No-treatment group, ++p < 0.01 versus Gel group, ##p < 0.01 versus Random group, via one-way ANOVA followed by Tukey’s multiple comparisons test). g Immunofluorescence staining of CD31 (capillaries; upper) and α-SMA (arterioles; lower) in the cross-sectioned ischemic muscles 28 days after cell transplantation. Scale bars = 100 μm. h Quantification of CD31-positive capillary density (n = 7, left), α-SMA-positive arteriole density (n = 7, middle) and size (n = 20, right) in ischemic limb tissue (technical repeats = 2, **p < 0.01 versus No-treatment group, ++p < 0.01 versus Gel group, and ##p < 0.01 versus Random group, via one-way ANOVA followed by Tukey’s multiple comparisons test). i Dual immunofluorescence staining with human-specific anti-CD44 (for transplanted hADSCs) and mouse/human-co-reactive anti-CD31 (capillaries) in the cross-sectioned ischemic regions 28 days after cell transplantation. Scale bars = 20 μm. j Quantification of human CD44-positive vessels per field in ischemic limb tissue (n = 7–10, technical repeats = 2, *p < 0.05 versus Random group, via unpaired t-test). Error bars represent one standard deviation

Similar articles

Cited by

References

    1. Khademhosseini A, Langer R. A decade of progress in tissue engineering. Nat. Protoc. 2016;11:1775–1781. doi: 10.1038/nprot.2016.123. - DOI - PubMed
    1. Laschke MW, Menger MD. Life is 3D: boosting spheroid function for tissue engineering. Trends Biotechnol. 2017;35:133–144. doi: 10.1016/j.tibtech.2016.08.004. - DOI - PubMed
    1. Bajaj P, et al. 3D biofabrication strategies for tissue engineering and regenerative medicine. Annu. Rev. Biomed. Eng. 2014;16:247–276. doi: 10.1146/annurev-bioeng-071813-105155. - DOI - PMC - PubMed
    1. Datta P, Ayan B, Ozbolat IT. Bioprinting for vascular and vascularized tissue biofabrication. Acta Biomater. 2017;51:1–20. doi: 10.1016/j.actbio.2017.01.035. - DOI - PubMed
    1. Mirabella T, et al. 3D-printed vascular networks direct therapeutic angiogenesis in ischaemia. Nat. Biomed. Eng. 2017;1:0083. doi: 10.1038/s41551-017-0083. - DOI - PMC - PubMed

Publication types

Substances