. 2019 Apr;38(16):3093-3101.
doi: 10.1038/s41388-018-0625-1. Epub 2018 Dec 20.

Mitochondrial dysfunction is a key determinant of the rare disease lymphangioleiomyomatosis and provides a novel therapeutic target

Affiliations

Mitochondrial dysfunction is a key determinant of the rare disease lymphangioleiomyomatosis and provides a novel therapeutic target

E M M Abdelwahab et al. Oncogene. 2019 Apr.

Abstract

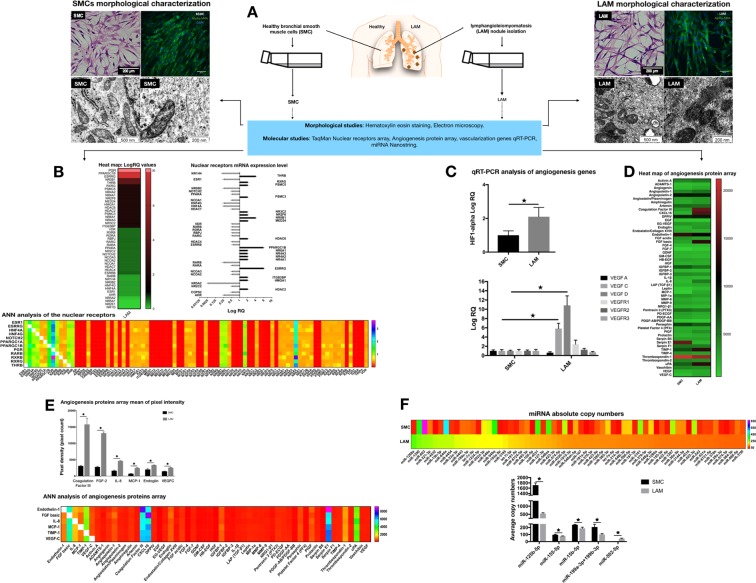
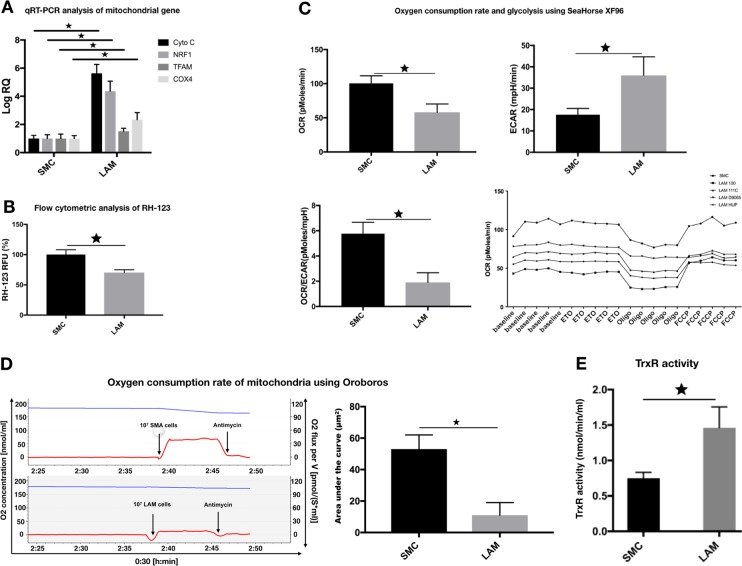
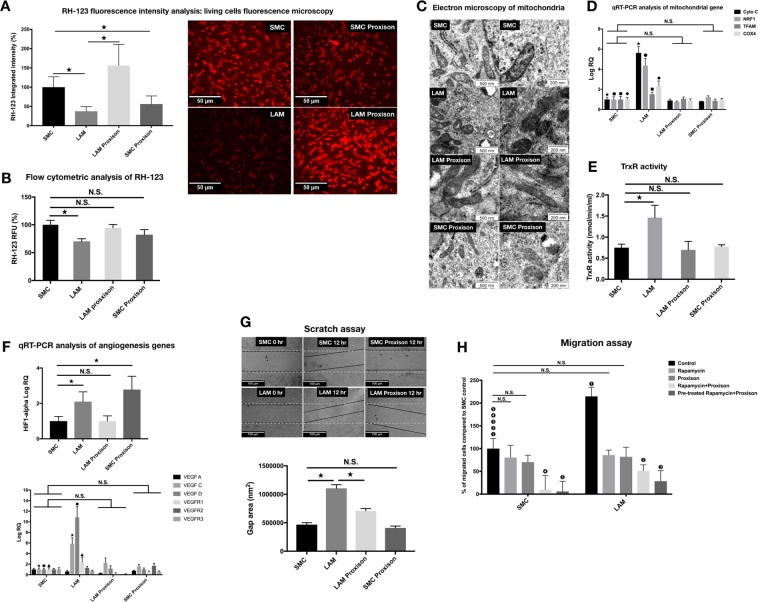
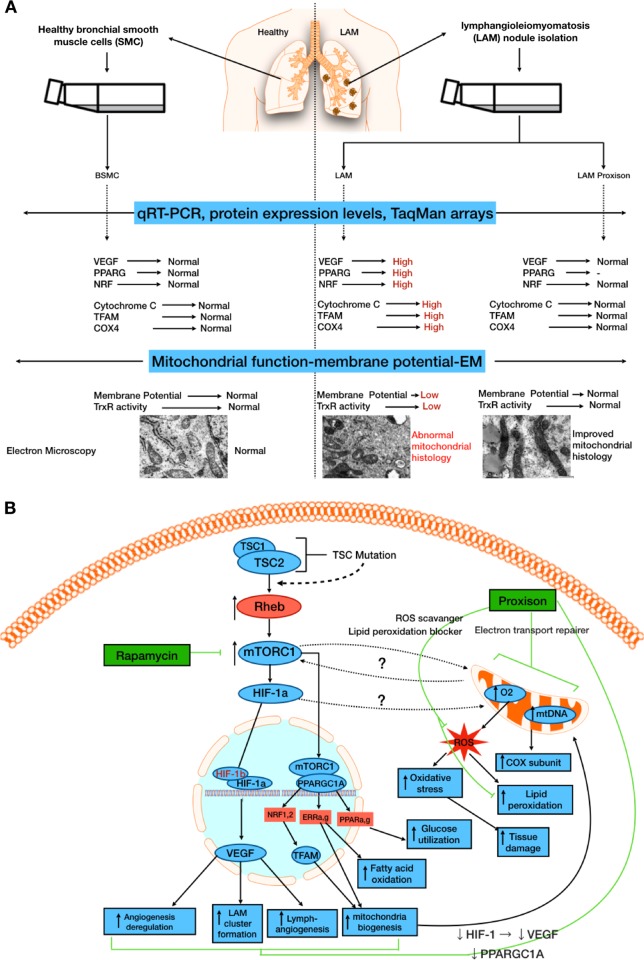
Lymphangioleiomyomatosis (LAM) is a rare and progressive systemic disease affecting mainly young women of childbearing age. A deterioration in lung function is driven by neoplastic growth of atypical smooth muscle-like LAM cells in the pulmonary interstitial space that leads to cystic lung destruction and spontaneous pneumothoraces. Therapeutic options for preventing disease progression are limited and often end with lung transplantation temporarily delaying an inevitable decline. To identify new therapeutic strategies for this crippling orphan disease, we have performed array based and metabolic molecular analysis on patient-derived cell lines. Our results point to the conclusion that mitochondrial biogenesis and mitochondrial dysfunction in LAM cells provide a novel target for treatment.


Conflict of interest statement

DMcP and AP own shares/employed by Antoxis Ltd, UK. The remaining authors declare that they have no conflict of interest.

Figures

Fig. 1
Fig. 1
Morphological and molecular characterization of bronchial SMC controls and LAM cell lines. a Study rationale and cellular morphology. Normal bronchial SMC controls (n = 2) and patient-derived LAM cell lines (n = 4) were stained for hematoxylin eosin (magnification ×10, size-bar 200 μm) and for alpha-smooth muscle actin (ASMA) (ASMA green, DAPI blue, magnification ×40, size bar 40 μm). Electron microscopy of mitochondria in LAM cells and normal bronchial SMC controls (magnification 200 nm, the scale bar 500 nm). b Nuclear receptor TaqMan arrays n = 2 (data were generated from pooled samples of normal bronchial SMC controls n = 2, or patient derived LAM cell lines n = 4, respectively). Heat map of LogRQ values are shown. Nuclear receptor TaqMan data presented as LogRQ ± technical error of the replicates. ANN analysis of the nuclear receptor arrays was performed to demonstrate hidden interactions among different nuclear receptors. c Deregulation of VEGF expression in LAM samples. qRT-PCR analysis of genes affecting angiogenesis were performed and beta-actin was used as inner control. Data are presented as mean of log RQ ± SEM. Significant changes are marked as asterisk (P < 0.05); d Heat map of angiogenesis protein array. The figure presents mean of pixel intensity. e Angiogenesis array results of LAM cell lines n = 3 and normal SMC control n = 2 presented as mean of pixel intensity ± SEM. Significant changes are marked as asterisk (P < 0.05). ANN analysis of angiogenesis protein interaction hierarchy. f Analysis of 798 miRNA absolute copy numbers by Nanostring. miRNA copy numbers detected by Nanostring in pooled LAM (n = 4) and pooled, normal SMC (n = 2) samples. The heat map represents the most deregulated 141 miRNA in LAM samples compared to normal SMC controls. Copy number differences of specific miRNAs that are involved in mitochondrial biogenesis detected after Nsolver analysis were further analyzed in individual cell lines (normal SMCs (n = 2) and LAM (n = 4)). Data are presented as average copy number ± SEM, significant changes are marked as asterisk (P < 0.05)
Fig. 2
Fig. 2
Altered function of mitochondria in LAM cells. a qRT-PCR analysis of mitochondrial gene expression in individual LAM cell lines (n = 4) compared to normal SMC controls (n = 2). Data are presented as mean log RQ ± SEM and significant changes are marked as asterisk (P < 0.05). b Flow cytometric analysis of RH-123 fluorescence intensity in individual LAM cell lines (n = 4) compared to normal SMC controls (n = 2). Data are presented as mean RFU ± SEM; significant changes are marked as asterisk (P < 0.05). c Oxygen consumption rate and glycolysis were measured by SeaHorse XF96 in individual LAM (n = 4) cell lines and normal SMC control cells (n = 2). Representative OCR and ECAR data are presented as mean ± SEM, significant changes are marked as asterisk (* P < 0.05). d Measurements of mitochondrial activity. Oxygen consumption rate of mitochondria measured using Oroboros (blue line = oxygen concentration, red line = oxygen flux per volume; quantification of oxygen consumption (area under the curve). e TrxR activity measured in individual LAM (n = 4) and normal, bronchial SMC control (n = 2) samples. Data are TrxR; activity is presented as mean of nmol min/ml ± SEM; significant changes are marked as asterisk (P < 0.05)
Fig. 3
Fig. 3
Proxison normalizes mitochondrial morphology and function in LAM cells. a Proxison (3 µM, 1 h)-treated normal SMC and LAM cells were incubated with 2.5 µM RH-123 and then fluorescence microscopy was used to analyze fluorescence intensity (magnification ×20, scale bar 50 µm). Quantification of fluorescence intensity in living cells was performed using ImageJ software. Data are presented as pixel intensity ± SEM; significant changes are marked as asterisk (P < 0.05). b Proxison (3 µM, 1 h)-treated normal SMC and LAM cells were incubated with 2.5 µM RH-123 and then fluorescence was analyzed by flow cytometry. Data are presented as mean of RFU ± SEM; significant changes marked as * P < 0.05. c Representative morphological changes in the mitochondria of LAM cell lines following Proxison treatment. Electron microscopy of mitochondria of untreated and Proxison (3 µM, 1 h)-treated LAM cells and normal SMC control cells (scale bars are 500 and 200 nm, respectively). d qRT-PCR analysis of mitochondrial gene expression in untreated and Proxison (3 µM, 1 h) treated LAM cell lines (n = 4) compared to normal SMC controls (n = 2); Data are presented as mean log RQ ± SEM and significant changes are marked as asterisk, solid circle, solid rhombus, and solid square (P < 0.05). e TrxR activity of Proxison (3 µM, 1h)-treated LAM cell lines (n = 4) compared to normal SMC controls (n = 2). TrxR activity is presented as mean ± SEM and significant changes are marked as asterisk (P < 0.05). f qRT-PCR analysis of angiogenesis related gene expression in untreated and Proxison (3 µM, 1 h)-treated cell cultures (LAM n = 4, normal bronchial SMC n = 2). Data are presented as mean RQ ± SEM and significant changes are marked as asterisk, solid circle, and solid triangle (in all results significance was P < 0.05). g Proliferation capacity following Proxison treatment (n = 3 technical repeats). Representative pictures of scratch assays in untreated and Proxison (3 µM, 1 h)-treated LAM cell lines (n = 4) compared to normal SMC controls (n = 2) after 12 h incubation. Data are presented as mean of cell growth (gap) area nm2 ± SEM; significant changes are marked as asterisk (P < 0.05). h Migration capacity of LAM cell lines. LAM cell lines (n = 2) and normal SMCs (n = 2) were treated with Rapamycin (20 nM, 24 h), Proxison (3 µM, 24 h), Rapamycin (20 nM, 24 h)+Proxison(3 µM, 24 h), and finally cells were pre-treated with Rapamycin for 48 h (20 nM/24 h) and then incubated with Proxison (3 µM, 24 h). Images are presented as the number of cells migrated through the membrane to the lower side of the chamber and were stained with DAPI. Data are presented as the percentage of migrated LAM cells compared to normal SMC ± SEM and significant changes are marked as (1), (2), (3), (4) and (5) (in all results significance was P < 0.05)
Fig. 4
Fig. 4
a Summary of LAM pathomechanism. b Summary of signaling pathway interactions in LAM revealing current and future therapeutic targets. The study led to the identification of mitochondrial dysfunction in LAM. Treatment with the mito-active candidate drug Proxison encouraged reestablishing the homeostasis in a diverse range of key pathways including VEGF and TFAM. Rapamycin, by acting directly on mTORC1, may also indirectly affect mitochondrial metabolism (as well as VEGF and TFAM), while Proxison, acting directly on the mitochondria, may indirectly influence the mTORC1 pathway. In migration assays the effects of the two drugs, Rapamycin and Proxison, were additive, indicating that from a clinical perspective there is a possibility of a combination therapy aimed at two different, but interacting facets of the disease process providing the best outcome for patients

References

    1. Harknett EC, Chang WYC, Byrnes S, Johnson J, Lazor R, Cohen MM, et al. Use of variability in national and regional data to estimate the prevalence of lymphangioleiomyomatosis. QJM. 2011;104:971–9. doi: 10.1093/qjmed/hcr116. - DOI - PubMed
    1. Hayashida M, Seyama K, Inoue Y, Fujimoto K, Kubo K. The epidemiology of lymphangioleiomyomatosis in Japan: a nationwide cross-sectional study of presenting features and prognostic factors. Respirology. 2007;12:523–30. doi: 10.1111/j.1440-1843.2007.01101.x. - DOI - PubMed
    1. Astrinidis A, Khare L, Carsillo T, Smolarek T, Au KS, Northrup H, et al. Mutational analysis of the tuberous sclerosis gene TSC2 in patients with pulmonary lymphangioleiomyomatosis. J Med Genet. 2000;37:55–7. doi: 10.1136/jmg.37.1.55. - DOI - PMC - PubMed
    1. Chang William YC, Cane Jennifer L, Blakey John D, Kumaran Maruti, Pointon Kate S, Johnson Simon R. Clinical utility of diagnostic guidelines and putative biomarkers in lymphangioleiomyomatosis. Respiratory Research. 2012;13(1):34. doi: 10.1186/1465-9921-13-34. - DOI - PMC - PubMed
    1. Goncharova EA, Goncharov DA, Eszterhas A, Hunter DS, Glassberg MK, Yeung RS, et al. Tuberin regulates p70 S6 kinase activation and ribosomal protein S6 phosphorylation: a role for the TSC2 tumor suppressor gene in pulmonary lymphangioleiomyomatosis (LAM) J Biol Chem. 2002;277:30958–67. doi: 10.1074/jbc.M202678200. - DOI - PubMed

Publication types