

Review
doi: 10.1038/s41592-018-0219-4.
Epub 2018 Dec 20.
Expansion microscopy: principles and uses in biological research
Affiliations
- PMID: 30573813
- PMCID: PMC6373868
- DOI: 10.1038/s41592-018-0219-4
Item in Clipboard
Review
Expansion microscopy: principles and uses in biological research
Nat Methods.
2019 Jan.
Abstract
Many biological investigations require 3D imaging of cells or tissues with nanoscale spatial resolution. We recently discovered that preserved biological specimens can be physically expanded in an isotropic fashion through a chemical process. Expansion microscopy (ExM) allows nanoscale imaging of biological specimens with conventional microscopes, decrowds biomolecules in support of signal amplification and multiplexed readout chemistries, and makes specimens transparent. We review the principles of how ExM works, advances in the technology made by our group and others, and its applications throughout biology and medicine.
Figures
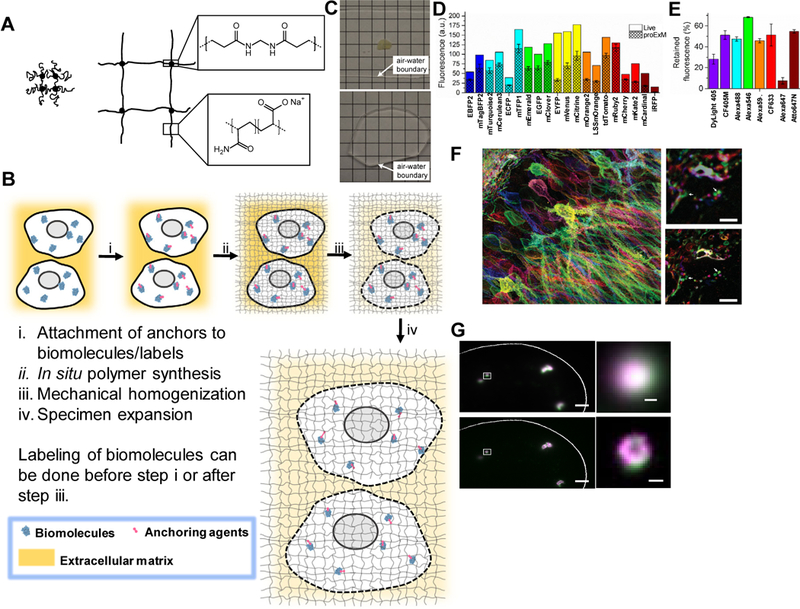
(A) Schematic of the ExM polyelectrolyte hydrogel, crosslinked sodium polyacrylate, showing the crosslinker (dot) and polymer chain (line), in the collapsed state before expansion (left) and in the expanded state after water dialysis (right). Insets show chemical structures of cross-linker and monomer components, in the synthesized polymer context. Adapted from ref. . (B) Diagram showing generalized workflow for ExM which involves (i) modification of biomolecules or labels (e.g., fluorescent antibodies) within a sample with a gel anchorable moiety (pink), (ii) in situ formation of the ExM polymer throughout the specimen, (iii) mechanical homogenization of the sample via heat treatment, detergent application, and/or enzymatic digestion, followed by (iv) expansion of the sample in water. Not to scale (the polymer spacing, or mesh size, is approximately 1–2 nm). (C) A 200 μm thick fixed mouse brain slice is opaque due to scattering before expansion (top) but is rendered transparent post-ExM, due to 100x dilution of the specimen contents in water (bottom). Adapted from ref. . (D-E) Retention of fluorescent proteins and antibody fluorescence in proExM. (D) Literature values of brightness for fluorescent proteins normalized to EGFP (open bars), compared to literature values of brightness multiplied by the observed retention percentage of each fluorescent protein with proExM (crosshatched bars, mean ± s.d.; n = 4 samples). (E) Retention of fluorescence of dyes conjugated to antibodies, after proExM (mean ± s.d., n = 3 samples). Adapted from ref.. (F) Nanoscale imaging of intact brain circuitry with proExM. Shown is a specimen of mouse hippocampus expressing virally delivered Brainbow3.0 epitopes, stained with fluorescent antibodies, and then expanded via proExM (left); image shows maximum intensity projection of a high-resolution confocal microscopy stack. (Top, right), pre-expansion image of the boxed region of the left image. Arrows indicate features highlighted in the bottom, right image. (Bottom, right), post-expansion image of the top, right image. Adapted from ref. . (G) smFISH image before expansion (top panel) and post-expansion image processed with the ExFISH protocol (bottom panel), of NEAT1 lncRNA in the nucleus of a HeLa cell. Magenta and green indicate probesets binding to different parts of NEAT1. Right, a NEAT1 cluster (corresponding to the boxed regions of images on the left) imaged with smFISH (upper right) and ExFISH (bottom right). Adapted from ref. . Scale bars, (F,
left) 50 μm (physical size post-expansion, 198 μm), (F, top right) 5 μm; (F, bottom right) 5 μm (19.8 μm); (G,
top left) 2 μm; (G,
bottom left) 2 μm (6.6 μm); (G,
top right) 200 nm; (G,
bottom right) 200 nm (660nm).
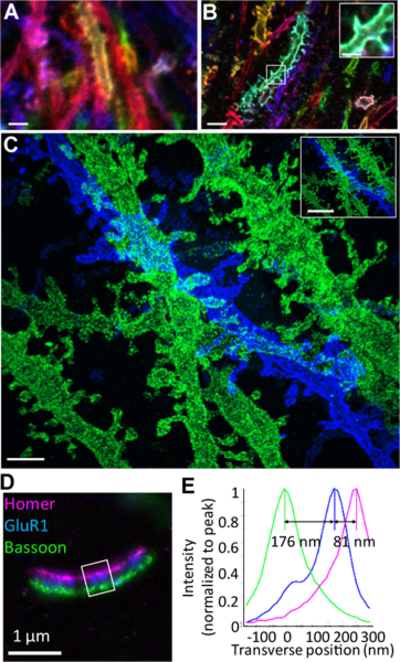
(A-C) iExM enables nanoscale imaging of brain circuitry in mouse hippocampus expressing Brainbow3.0 and immunostained with antibodies prepared for iExM expansion. (A) Confocal image of immunostained neurons in mouse hippocampus expressing Brainbow3.0, imaged without expansion. Blue, EYFP; red, TagBFP; green, mTFP. (B) As in (A) but imaged after 4.5x expansion via proExM; inset shows a magnified image of the boxed region in the main panel of B. (C) Confocal image (maximum intensity projection) of an iExM (~20x) expanded specimen of mouse hippocampus immunolabeled for EYFP (blue) and mCherry (green). Inset shows a demagnified view of (C) with the scale bar set to indicate the same distance as the scale bars in (A) and (B). (D) Nanoscale-resolution imaging of synapses using iExM. Wide-field image of a synapse from a field of cultured hippocampal neurons immunostained for Homer1 (magenta), glutamate receptor 1 (GluR1, blue), and Bassoon (green). (E) Transverse profile of the three proteins imaged in (D) (in the boxed region) after normalizing to the peak (Homer1 in magenta, GluR1 in blue, Bassoon in green). Adapted from ref. . Scale bars, (A) 3μm; (B) 3μm (physical size post-expansion 14μm); (B, inset) 1μm (4.5μm); (C) 1μm (20μm); (C, inset) 3μm (60μm); (D) 1μm (13μm).
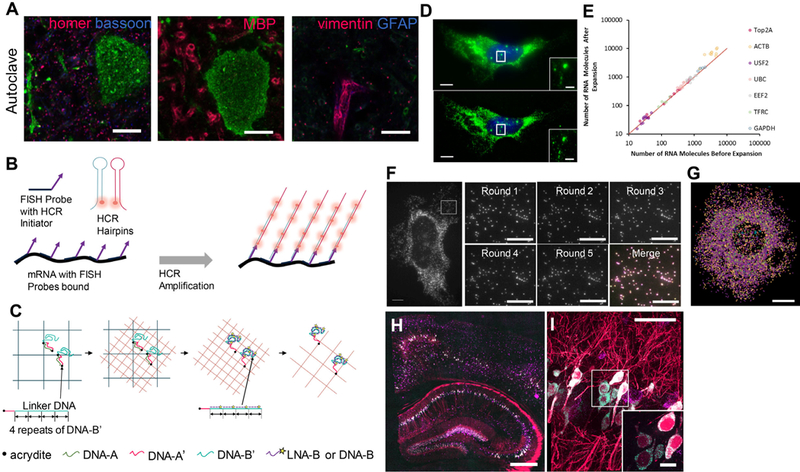
(A) Post-expansion antibody staining of protein targets in Thy1-YFP mouse brain tissue via a variant of proExM that uses high temperature detergent based (i.e., epitope-sparing) mechanical homogenization. Images show post-expansion staining against YFP (green), bassoon (blue) and homer (magenta) (left panel); YFP (green) and myelin basic protein (magenta) (middle panel); YFP (green), vimentin (magenta) and glial fibrillar acidic protein (blue) (right panel). Adapted from ref. . (B-C) ExM is compatible with different signal amplification techniques applied post-expansion, such as the Hybridization Chain Reaction (HCR) (B) and locked nucleic acid (LNA) based signal amplification (C). (B) Schematic for HCR-mediated signal amplification. A target RNA is labeled with FISH probes bearing HCR initiators. During amplification, metastable DNA hairpins bearing fluorophores assemble into polymer chains on the initiators, amplifying the signal from the bound FISH probe. Adapted from ref. . (C) Schematic showing LNA and DNA-based signal amplification for iExM. Adapted from ref. . (D) The decrowding of RNA molecules provided by ExFISH enables more accurate single-molecule quantification. Upper panel, pre-expansion smFISH image of ACTB RNA in a cultured HeLa cell. Inset shows zoomed-in region highlighting ACTB transcription sites in the nucleus. Lower panel, as in upper panel, but using ExFISH. (E) smFISH counts of RNA abundance for seven different transcripts before versus after expansion (n = 59 cells; each symbol represents one cell). Adapted from ref. . (F) ExM supports multiplexed read out of the identity of biomolecules, such as RNA, through multiple rounds of probe application and imaging. Left panel, widefield fluorescence image of ExFISH targeting GAPDH RNA in a cultured HeLa cell, with a boxed region showing five repeated cycles of staining and probe removal as shown on the right panel; lower right image shows an overlay of the five images (with each a different color: red, green, blue, magenta, yellow), showing colocalization. (G) Composite wide-field image showing ExFISH with serially delivered probes against six RNA targets in a cultured HeLa cell (NEAT1, blue; EEF2, orange; GAPDH, yellow; ACTB, purple; UBC, green; USF2, light blue). Adapted from ref. . (H-I) Nanoscale imaging of single RNA molecules in the mouse brain via ExFISH. (H) ExFISH post-expansion wide-field fluorescence image of a Thy1-YFP brain slice showing YFP protein (magenta), YFP mRNA (cyan) and Gad1 mRNA (purple). (I) Confocal image of mouse hippocampal tissue from (i), showing single RNA puncta. Inset, one plane of the boxed region (magenta , YFP protein; cyan, YFP mRNA; purple, Gad1 mRNA). Adapted from ref. . Scale bars, (A) 5μm (physical size post expansion ~21 μm); (D) 10 μm (33 μm), insets 2 μm (6.6 μm); (F) left panel, 6.6 μm (20 μm); right panel round 1–5, 3 μm (10 μm); (G) 6.6 μm (20 μm); (H) 500 μm (1450 μm); (I) 50 μm (145 μm), inset 10 μm (29 μm).
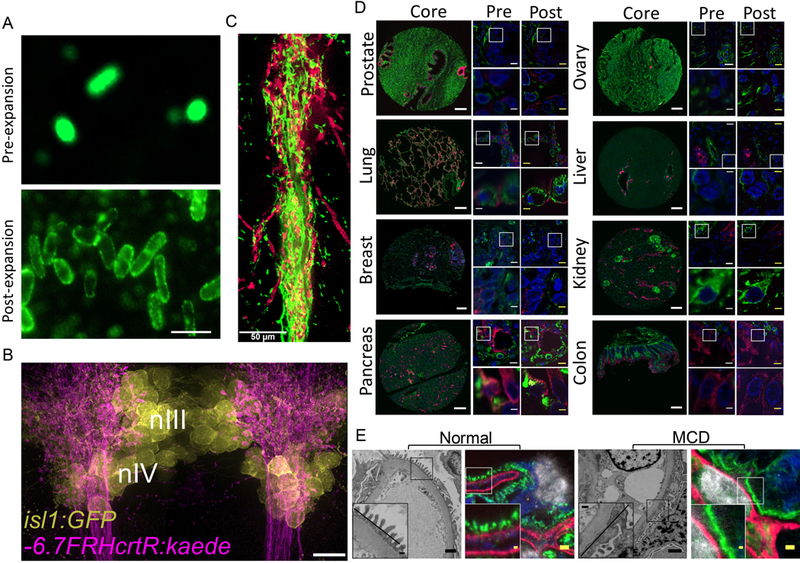
(A) Wide-field pre-expansion image of E. coli immunolabeled against membrane lipopolysaccharides (top). Wide-field post-expansion image of E. coli prepared as in (top) via ExM 1.0 (bottom). Adapted from ref. . (B) Image of part of the brain of a 6-day old larval zebrafish (nIII and nIV refer to the nuclei of the zebrafish brain indicated; isl1:GFP and −6.7FRHcrtR:kaede refers to the fish line utilized) using proExM. Image shows a maximum intensity projection of a ∼33-μm-thick volume of the brain immunolabeled for cells expressing GFP (yellow) and Kaede (magenta). Adapted from ref. . (C) proExM image of mouse brain striatal circuits showing the intertwined “bouquet” between striosomal fibers (green, mCitrine) and dopaminergic dendrites (magenta, tdTomato) in the mouse brain. Adapted from ref. . (D) ExPath imaging of a wide range of human tissue types. There are eight blocks of images, each corresponding to a different tissue type as labeled (e.g., prostate, lung, breast, etc.). Within each block of images for a given tissue type, there are 5 images shown. The left column within the 5 images shows the image of the tissue core, from a tissue microarray. The middle column within the 5 images shows two images, the top of which is a small field of view, and the bottom of which zooms into the area outlined in the top image by a white box, all pre-expansion. The right column within the 5 images shows the same fields of view as in the middle column, but now post-expansion after having been processed by the ExPath protocol. Blue, DAPI; green, vimentin; magenta, KRT19. Adapted from ref. . (E) Comparative imaging of kidney podocyte foot process in both normal and nephrotic disease states with both electron microscopy and ExPath. There are two pairs of images labeled “normal” and “MCD” (minimal change disease). Each pair of images shows one electron micrograph and one ExPath image from the same patient. Each image shows an inset, zoomed into the region outlined by the box from the main figure panel. Grey, DAPI; Blue, Collagen IV; green, vimentin; magenta, ACTN4. Adapted from ref. . Scale bars, (A) 2μm; (B) 10 μm (physical size post-expansion 38 μm); (C) 50 μm (D) tissue core, 200 μm; yellow scale bars have the same biological scale as the paired white scale bars: top images, 10 – 12.5 μm; bottom images, 2.5 – 3.1 μm; physical sizes post-expansion, top images, 50 μm; bottom images, 12.5 μm. (E) For electron micrographs, 1 μm; inset, 200 nm; for ExPath images, 1 μm (physical size post-expansion, 4.3 μm); inset, 200 nm.
References
-
- Dunn RC Near-field scanning optical microscopy. Chem. Rev. 99, 2891–928 (1999). - PubMed
-
- Dürig U, Pohl DW & Rohner F Near-field optical-scanning microscopy. J. Appl. Phys. 59, 3318–3327 (1986).
-
- Hell SW Far-field optical nanoscopy. in 2010 23rd Annual Meeting of the IEEE Photonics Society, PHOTINICS 2010 3–4 (2010). doi:10.1109/PHOTONICS.2010.5698725 - DOI
Publication types
MeSH terms
Grants and funding
LinkOut - more resources
Full Text Sources
Other Literature Sources
