. 2019 Jan;16(1):79-87.
doi: 10.1038/s41592-018-0253-2. Epub 2018 Dec 20.

Evaluation of variability in human kidney organoids

Affiliations

Evaluation of variability in human kidney organoids

Belinda Phipson et al. Nat Methods. 2019 Jan.

Abstract

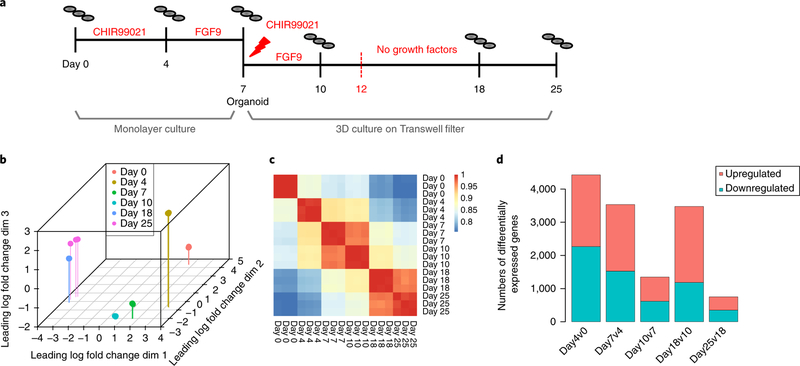
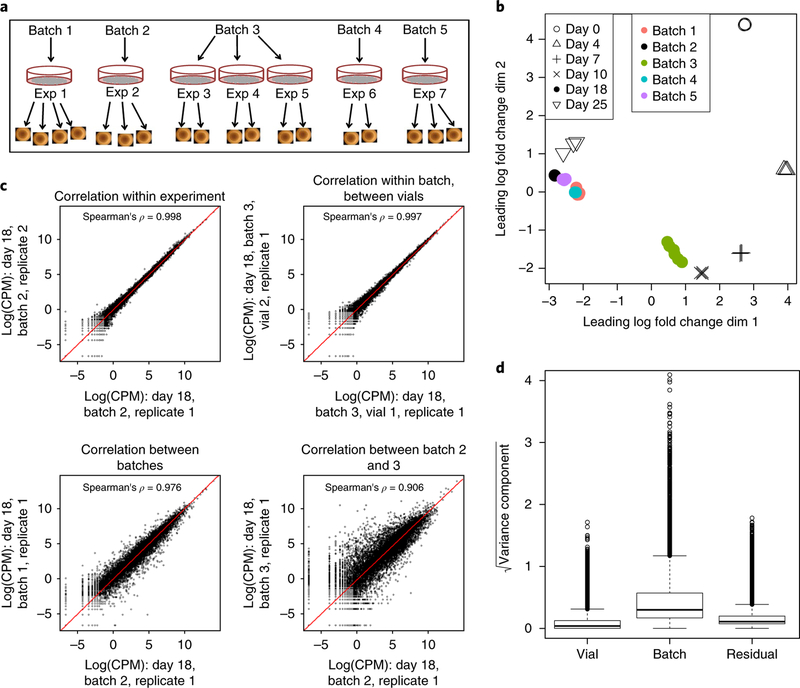
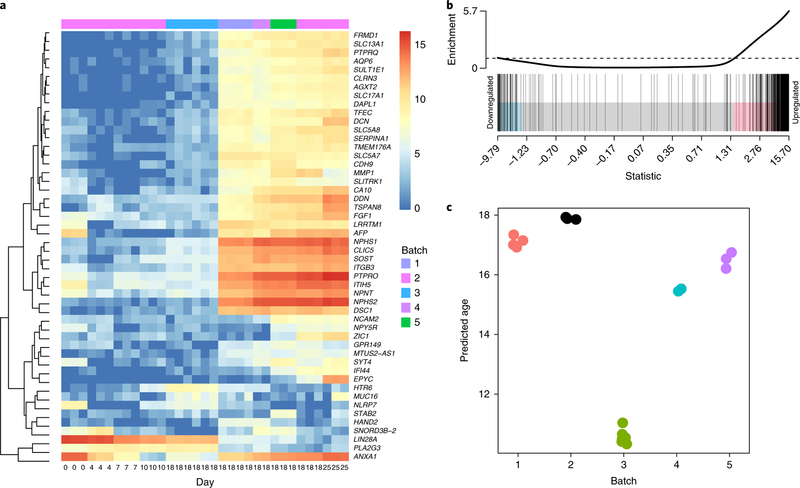
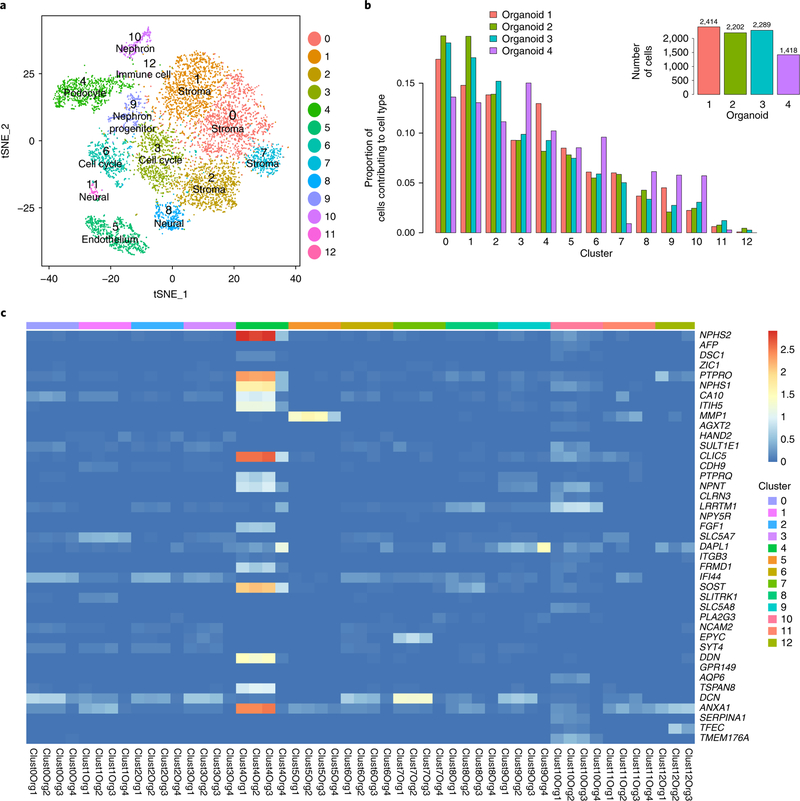
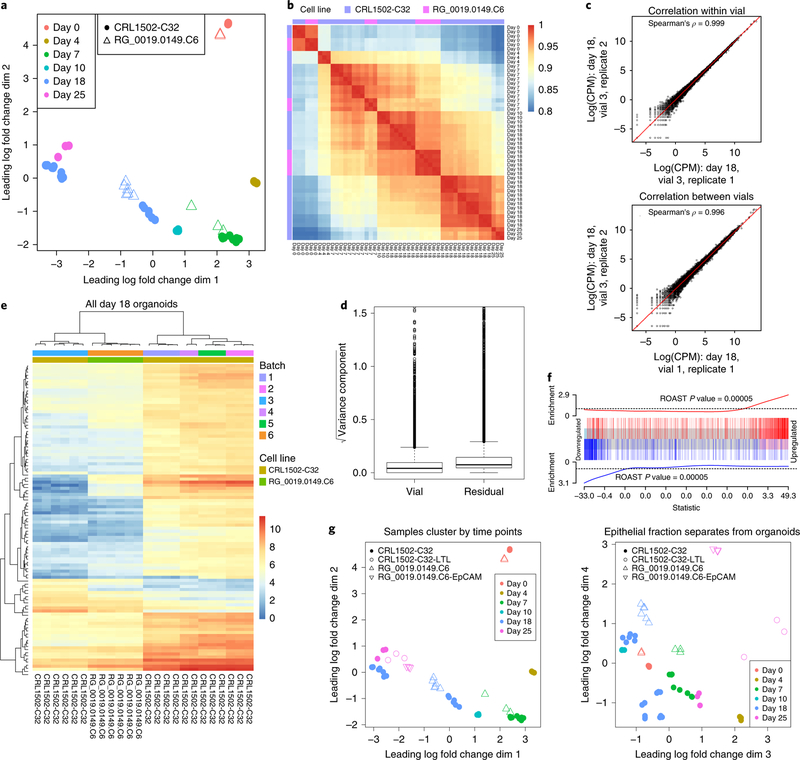
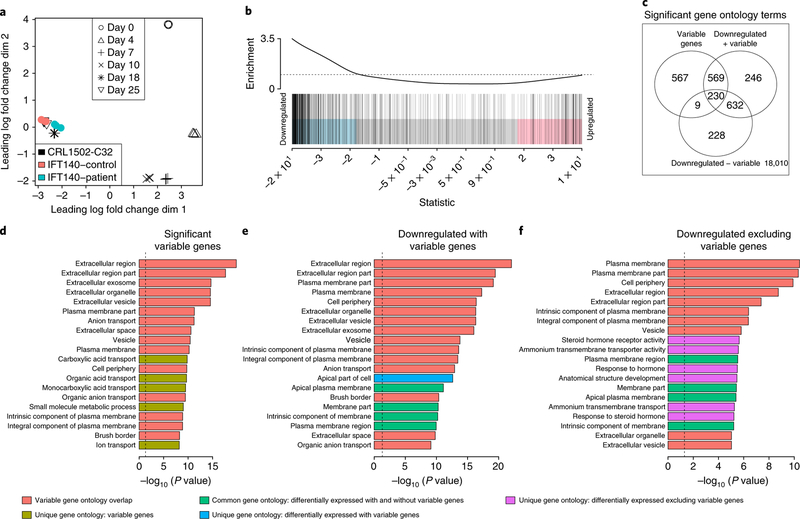
The utility of human pluripotent stem cell-derived kidney organoids relies implicitly on the robustness and transferability of the protocol. Here we analyze the sources of transcriptional variation in a specific kidney organoid protocol. Although individual organoids within a differentiation batch showed strong transcriptional correlation, we noted significant variation between experimental batches, particularly in genes associated with temporal maturation. Single-cell profiling revealed shifts in nephron patterning and proportions of component cells. Distinct induced pluripotent stem cell clones showed congruent transcriptional programs, with interexperimental and interclonal variation also strongly associated with nephron patterning. Epithelial cells isolated from organoids aligned with total organoids at the same day of differentiation, again implicating relative maturation as a confounder. This understanding of experimental variation facilitated an optimized analysis of organoid-based disease modeling, thereby increasing the utility of kidney organoids for personalized medicine and functional genomics.


Conflict of interest statement

Competing interests

M.H.L. and M.T. hold intellectual property around the kidney organoid differentiation protocol. M.H.L. holds contract research agreements with Organovo Holdings. All other authors declare that they have no competing interests.

Figures

Fig. 1
Fig. 1. Temporal characterization of human kidney organoid differentiation.
a, Overview of differentiation protocol, noting the collection time points. On days 0 and 4, individual wells were collected from a six-well plate; from day 7 onward, independent replicates refer to individual organoids. (CHIR99021 is an aminopyrimidine derivative that is an extremely potent inhibitor of glycogen synthase kinase-3 alpha.) FGF9, fibroblast growth factor 9. b, MDS plot of all samples demonstrates a clear developmental trajectory. c, Pairwise Spearman’s ρ correlation coefficients between the samples collected across the time course (n = 15,685 genes). d, Number of significant differentially expressed genes upregulated and downregulated between consecutive time points. Significant genes were identified on the basis of TREAT statistics with absolute log fold change > 1 and FDR < 5% (two-sided).
Fig. 2
Fig. 2. Sources of transcriptional variation within and between experiments.
a, Diagram of organoids profiled at day 18, showing the relationship between experiment (single differentiation from a unique vial), batch (multiple experiments separated in time), and organoid. Samples refer to individual organoids within an experiment. b, MDS plot of day 18 organoid and time series samples indicating batch and day. c, Log-normalized expression for pairs of representative samples showing correlation between organoids (Spearman’s ρ, n = 15,685 genes). d, Contribution to each source of variation (vial, batch, and residual) across all 15,685 genes (center line, median; hinges, first and third quartiles; whiskers, most extreme values within 1.5× the interquartile range of the box).
Fig. 3
Fig. 3. Prediction of relative organoid maturation between batches.
a, Log2-normalized expression across time points for the most variable genes identified at day 18. Note that the original time series is part of batch 2. b, ROAST analysis of the 500 most variable genes at day 18 shows strong enrichment between days 10 and 25 and suggests an association between nephron maturation and transcriptional variability (one-sided P = 0.0005). c, Prediction of organoid age based on ten genes marking the progression of differentiation.
Fig. 4
Fig. 4. Single-cell profiling reveals heterogeneity in component cell types among four day 25 organoids.
a, Graph-based clustering identifies 13 clusters, including anticipated and off-target cell types. The t-distributed stochastic neighbor embedding (tSNE) plot consists of 8,361 cells from n = 4 biologically independent organoids. b, Proportions of cells per cell type in each organoid. Inset bar graph, total number of cells contributed from each organoid. c, Average log-normalized expression for top variable genes for each organoid in each cluster. Most of the variable genes are expressed in cluster 4, the podocytes.
Fig. 5
Fig. 5. Transcriptional variation between iPSC lines, and temporal concordance between total organoid and enriched nephron epithelium.
a, MDS plot of organoids generated from two cell lines. b, Spearman’s correlations between all organoids. c, Log-normalized expression for pairs of RG_0019.0149. C6 organoids. Spearman’s ρ was used to calculate correlation coefficients across 15,685 genes. d, Contribution of two variance components in a random effects model estimated for each gene (n = 14,870 genes). Center line, median; hinges, first and third quartiles; whiskers, most extreme values within 1.5× the interquartile range of the box. e, Hierarchical clustering of all day 18 organoids based on the top 100 differentially expressed genes between day 18 and day 10 in the original time course data. The color scale represents the expression values as log(CPM). f, Barcode plot showing enrichment of genes differentially expressed between CRL1502-C32 day 18 batch 3 organoids (n = 6) and RG_0019.0149.C6 day 18 organoids (n = 6) when compared to day 18 (n = 3) versus day 10 (n = 3) CRL1502-C32 organoids. g, MDS plots of day 25 enriched nephron epithelium samples from the two cell lines, labeled CRL1502-C32-LTL and RG_0019.0149.C6-EpCAM, compared to all other total organoid samples.
Fig. 6
Fig. 6. Transcriptional analysis of a disease model improves with accounting for highly variable genes.
a, MDS plot showing patient samples, control samples, and time series data. IFT140, intraflagellar transport protein 140 homolog. b, The previously identified 570 highly variable genes were significantly enriched in the genes downregulated between patient and control samples (ROAST one-sided P = 0.0085). Moderated t-tests were used to test for differential expression between patient and control samples (two-sided). FDR < 1% and absolute log fold change > 0.7 were used to identify significant differentially expressed genes. c, Overlap of significant gene ontology categories for the three different gene ontology analyses. d, Gene ontology categories enriched for significant, highly variable genes. e, Gene ontology categories enriched for significantly downregulated genes, including highly variable genes. f, Gene ontology categories enriched for significantly downregulated genes, excluding highly variable genes. For all gene ontology analyses, a modified hypergeometric test was used to determine statistical significance, considering gene length bias. P values are one-sided.

References

    1. Takahashi K et al. Induction of pluripotent stem cells from adult human fibroblasts by defined factors. Cell 131, 861–872 (2007). - PubMed
    1. Bellin M et al. Isogenic human pluripotent stem cell pairs reveal the role of a KCNH2 mutation in long-QT syndrome. EMBO J 32, 3161–3175 (2013). - PMC - PubMed
    1. Kim C et al. Studying arrhythmogenic right ventricular dysplasia with patient-specific iPSCs. Nature 494, 105–110 (2013). - PMC - PubMed
    1. Phelan DG et al. ALPK3-deficient cardiomyocytes generated from patient-derived induced pluripotent stem cells and mutant human embryonic stem cells display abnormal calcium handling and establish that ALPK3 deficiency underlies familial cardiomyopathy. Eur. Heart J 37, 2586–2590 (2016). - PubMed
    1. Ardhanareeswaran K, Mariani J, Coppola G, Abyzov A & Vaccarino FM Human induced pluripotent stem cells for modelling neurodevelopmental disorders. Nat. Rev. Neurol 13, 265–278 (2017). - PMC - PubMed

Publication types