. 2019 Jan;16(1):75-78.
doi: 10.1038/s41592-018-0255-0. Epub 2018 Dec 20.

Reliability of human cortical organoid generation

Affiliations

Reliability of human cortical organoid generation

Se-Jin Yoon et al. Nat Methods. 2019 Jan.

Abstract

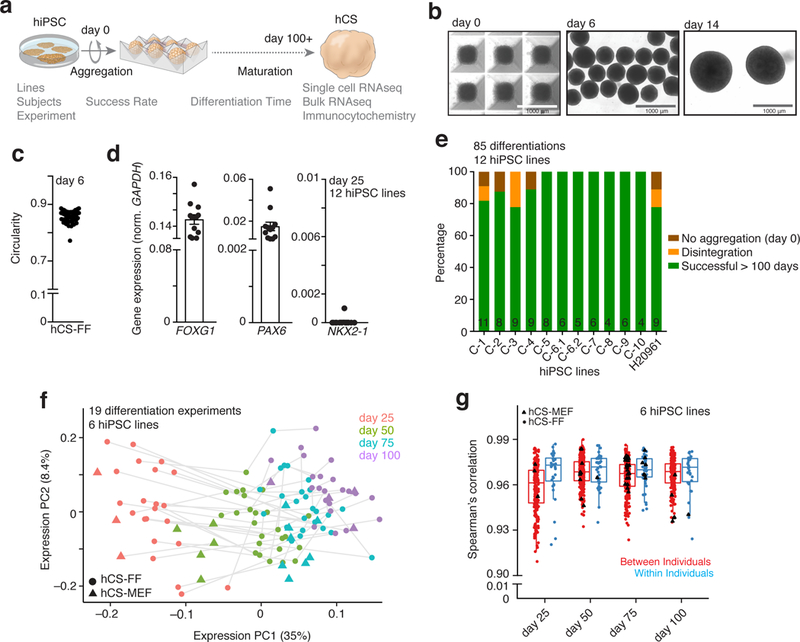
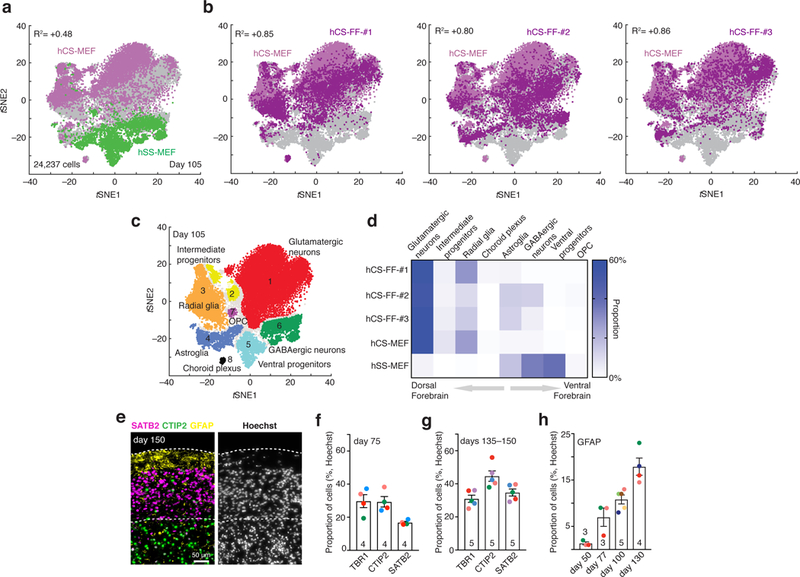
The differentiation of pluripotent stem cells in three-dimensional cultures can recapitulate key aspects of brain development, but protocols are prone to variable results. Here we differentiated multiple human pluripotent stem cell lines for over 100 d using our previously developed approach to generate brain-region-specific organoids called cortical spheroids and, using several assays, found that spheroid generation was highly reliable and consistent. We anticipate the use of this approach for large-scale differentiation experiments and disease modeling.


Conflict of interest statement

Competing interests

Stanford University has filed a provisional patent application that covers the generation of region-specific neural spheroids (US Application Serial No. 15/158,408). H.C.F., E.M.W. and G.M.H. were employees of BD Genomics during this study.

Figures

Figure 1.
Figure 1.. Success of differentiation and transcriptional reliability of human cortical spheroids.
a, Scheme illustrating the derivation of hCS-FF from hPSCs and the assays used. b, Representative images of neural spheroids at day 0, 6 and 14 of differentiation. c, Circularity (4p × area/perimeter2) of day 6 neural spheroids derived from 4 hiPSC lines. A value of 1.0 indicates a perfect circle. d, Gene expression of FOXG1, PAX6, NKX2.1 relative to GAPDH in hCS-FF at day 25 of Differentiation (n = 12 hiPSC lines from 11 subjects). Mean ± s.e.m. are shown. e, Percentage of successful differentiations up to 100 days for 12 hiPSC lines (n= 85 experiments; number per line indicated inside bars). f, Principal component analysis of hCS-FF and hCS-MEF at 4 stages of in vitro differentiation. Differentiation of the same line are indicated by a gray line (days 25, 50, 75, 100: n = 22, 25, 25, 22 hCS-FF and 3, 5, 8, 4 hCS-MEF samples, respectively). g, Spearman’s correlation of samples obtained from different individuals (between individuals) or from multiple differentiations of the same hiPSC lines (within individual); two-sided Wilcoxon–Mann–Whitney test, P< 0.03. Day 25, 50, 75, 100: n = 202, 269, 281, 206 samples (between individual) and 33, 41, 47, 31 samples (within individuals), respectively. Middle hinge corresponds to median, and lower and upper hinges correspond to first and third quartiles. RNA-seq data in f and g were obtained from n = 6 hiPSC lines derived from 6 individuals and differentiated in multiple independent differentiation experiments each.
Figure 2.
Figure 2.. Single-cell characterization of human cortical spheroids.
a,b, Single-cell profiling of hCS-MEF (n = 7,340 cells) and hSS-MEF n = 4,771 cells) (a) versus hCS-FF derived from 3 different individuals (hCS-FF-1, n = 4,649 cells; hCS-FF-2, n = 4,389 cells; hCS-FF-3, n = 3,088 cells) (b) at day 105 of differentiation. The correlation (log10 transformed mean of molecules per cell per gene) between total hCS-MEF and each of the hCS-MEF cultures or hSS-MEF is indicated. c,d, Clustering (c) and proportions (d) of all single cells across conditions (glutamatergic neuron cluster 1, n = 11,367 cells; intermediate progenitor cluster 2, n = 1,018 cells; radial glia cluster 3, n = 4,217 cells; astroglia cluster 4, n = 2,036 cells; ventral progenitor cluster 5, n = 1,915 cells; GABAergic neuron cluster 6, n = 2,520 cells; OPC cluster 7, n = 194 cells; choroid plexus cluster 8, n = 170 cells; 800 cells not assigned to a cluster). e, Representative cryosection at day 150 of differentiation stained for deep (CTIP2) and superficial (SATB2) neuronal markers and the glial marker GFAP. f,g, Proportion of cells expressing layer-specific cortical markers (TBR1, CTIP2, SATB2) at day 75 (f) and days 135ȓ150 (g) of differentiation from 4–5 hiPSC lines derived from 4–5 individuals (two-way ANOVA, F2,21 = 5.44, P = 0.01 for interaction; mean ± s.e.m. are shown; sample size indicated on each column). h, Developmental time course for GFAP+ cell generation, quantified in dissociated hCSs (n = 3–5 hiPSC lines per time point from 7 hiPSC lines derived from 6 individuals); ANOVA F3,11 = 21.89, P < 0.0001; mean ± s.e.m.).

References

    1. Di Lullo E & Kriegstein AR The use of brain organoids to investigate neural development and disease. Nat Rev Neurosci 18, 573–584, doi:10.1038/nrn.2017.107 (2017). - DOI - PMC - PubMed
    1. Pasca SP The rise of three-dimensional human brain cultures. Nature 553, 437–445, doi:10.1038/nature25032 (2018). - DOI - PubMed
    1. Kelava I & Lancaster MA Stem Cell Models of Human Brain Development. Cell Stem Cell 18, 736–748, doi:10.1016/j.stem.2016.05.022 (2016). - DOI - PubMed
    1. Bershteyn M et al. Human iPSC-Derived Cerebral Organoids Model Cellular Features of Lissencephaly and Reveal Prolonged Mitosis of Outer Radial Glia. Cell Stem Cell 20, 435–449 e434, doi:10.1016/j.stem.2016.12.007 (2017). - DOI - PMC - PubMed
    1. Mariani J et al. FOXG1-Dependent Dysregulation of GABA/Glutamate Neuron Differentiation in Autism Spectrum Disorders. Cell 162, 375–390, doi:10.1016/j.cell.2015.06.034 (2015). - DOI - PMC - PubMed

Publication types