. 2018 Dec 6:9:1721.
doi: 10.3389/fphys.2018.01721. eCollection 2018.

Investigating Multimodal Diagnostic Eye Biomarkers of Cognitive Impairment by Measuring Vascular and Neurogenic Changes in the Retina

Affiliations

Investigating Multimodal Diagnostic Eye Biomarkers of Cognitive Impairment by Measuring Vascular and Neurogenic Changes in the Retina

Delia Cabrera DeBuc et al. Front Physiol. .

Abstract

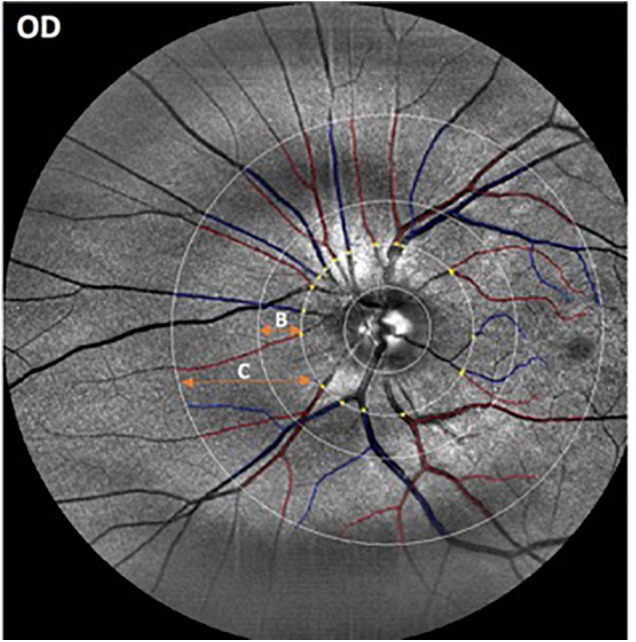
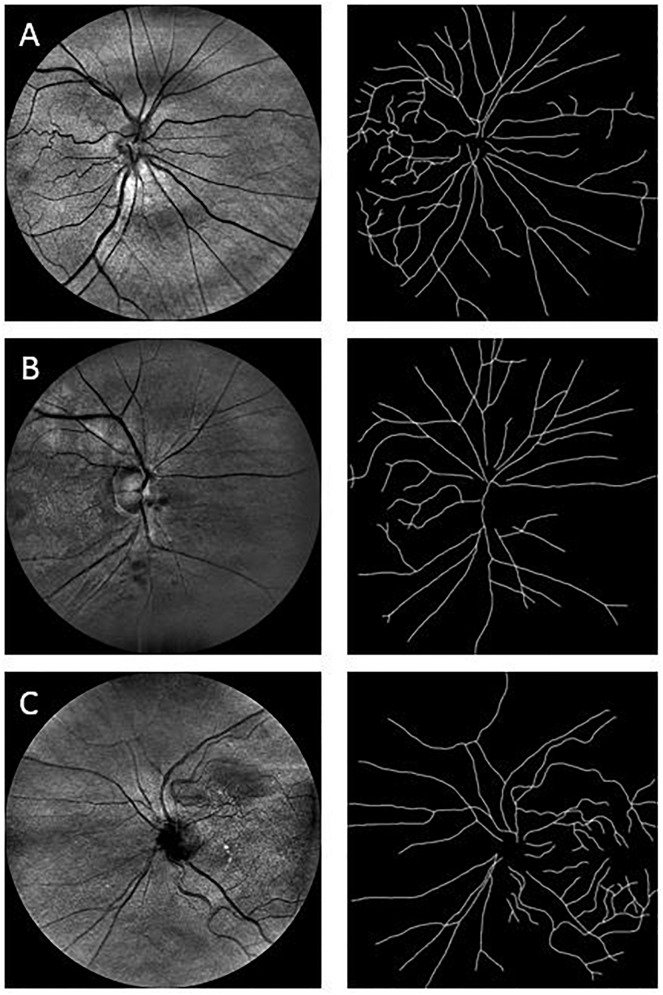
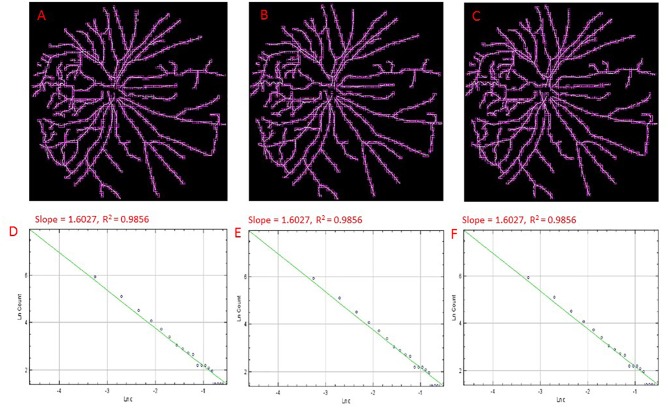
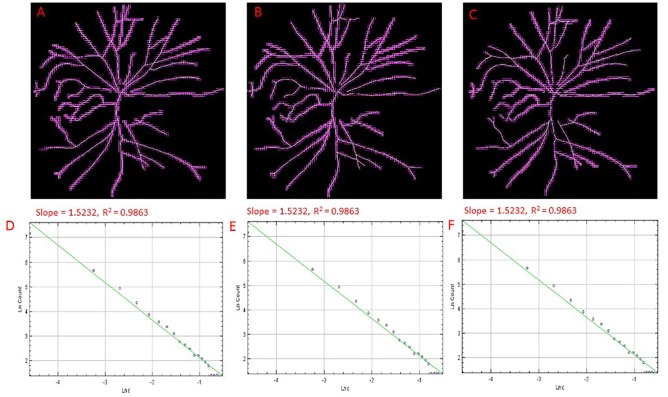
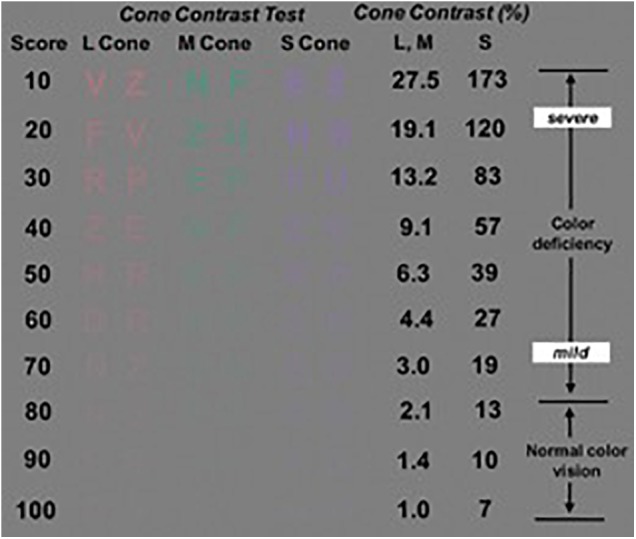
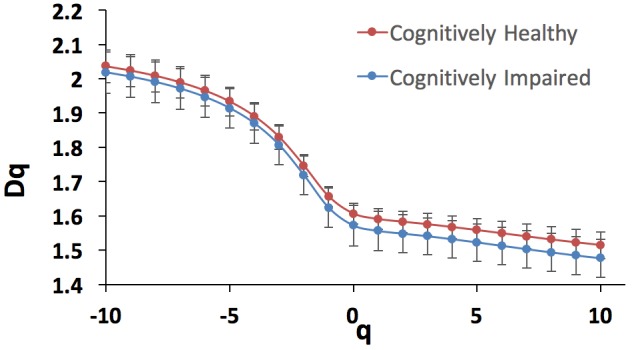
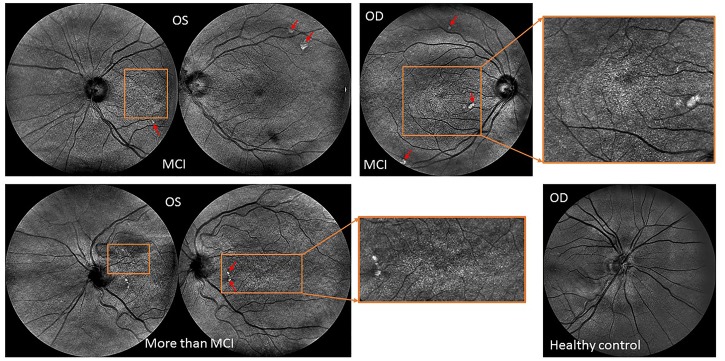
Previous studies have demonstrated that cognitive impairment (CI) is not limited to the brain but also affects the retina. In this pilot study, we investigated the correlation between the retinal vascular complexity and neurodegenerative changes in patients with CI using a low-cost multimodal approach. Quantification of the retinal structure and function were conducted for every subject (n = 69) using advanced retinal imaging, full-field electroretinogram (ERG) and visual performance exams. The retinal vascular parameters were calculated using the Singapore Institute Vessel Assessment software. The Montreal Cognitive Assessment was used to measure CI. Pearson product moment correlation was performed between variables. Of the 69 participants, 32 had CI (46%). We found significantly altered microvascular network in individuals with CI (larger venular-asymmetry factor: 0.7 ± 0.2) compared with controls (0.6 ± 0.2). The vascular fractal dimension was lower in individuals with CI (capacity, information and correlation dimensions: D0, D1, and D2 (mean ± SD): 1.57 ± 0.06; 1.56 ± 0.06; 1.55 ± 0.06; age 81 ± 6years) vs. controls (1.61 ± 0.03; 1.59 ± 0.03; 1.58 ± 0.03; age: 80 ± 7 years). Also, drusen-like regions in the peripheral retina along with pigment dispersion were noted in subjects with mild CI. Functional loss in color vision as well as smaller ERG amplitudes and larger peak times were observed in the subjects with CI. Pearson product moment correlation showed significant associations between the vascular parameters (artery-vein ratio, total length-diameter ratio, D0, D1, D2 and the implicit time (IT) of the flicker response but these associations were not significant in the partial correlations. This study illustrates that there are multimodal retinal markers that may be sensitive to CI decline, and adds to the evidence that there is a statistical trend pointing to the correlation between retinal neuronal dysfunction and microvasculature changes suggesting that retinal geometric vascular and functional parameters might be associated with physiological changes in the retina due to CI. We suspect our analysis of combined structural-functional parameters, instead of individual biomarkers, may provide a useful clinical marker of CI that could also provide increased sensitivity and specificity for the differential diagnosis of CI. However, because of our study sample was small, the full extent of clinical applicability of our approach is provocative and still to be determined.

Keywords: Alzheimer’s disease; cognitive impairment; electroretinography; eye biomarkers; fractal dimension; neurodegeneration; retinal vascular complexity.


Figures

FIGURE 1
FIGURE 1
Representative image obtained with the EasyScan unit (i-Optics Corporation, Netherlands) and analyzed with the SIVA program that measured the caliber of the vessels emerging from the optic disk. Arterioles are in red and venules are in blue. The SIVA software automatically detects the optic disk and traces vessels in a zone 0.5 to 2.0-disk diameter from the disk margin. The different circular ROIs with various radii around the optic disk center are labeled as B (0.5 – 1.0 disk diameters away from the disk margin) and C (0.5- 2.0 disk diameters away from the disk).
FIGURE 2
FIGURE 2
Sample images used in the fractal analysis. Images in the left column are the raw images obtained with the EasyScan system, while those in the right are their respective skeleton images that were used in the fractal analysis. Row (A) is from a healthy cognitively individual (MoCA score range: 29.6–25.2), Row (B) is from an MCI subject (MoCA score range: 25.2–19), and Row (C) is from a participant with more cognitive deterioration than MCI (MoCA score range: 21 to 11.4). MoCA, Montreal Cognitive Assessment.
FIGURE 3
FIGURE 3
Skeletons of vessels obtained from an cSLO image of a cognitively healthy individual with overlaid boxes at different number (i.e., 9, 12, and15) of grid positions, 9 (A), 12 (B), and 15 (C) with their corresponding double-log plots (D–F) of the count of boxes containing meaningful pixels vs. box size showing the slope (D0) and the R2 values of the regression lines. Overlaid boxes on the skeletonized images are shown to indicate that only boxes containing meaningful pixels were counted and used in the computation of the fractal dimension (D0 or the slope). Different number of grid positions are shown in (A–C) from the FracLac settings to show that these parameters were optimized and that a change in the number of grid positions did not result in a change in the slope (D0) or the R2 values (D–F). Hence the recommended number of 12 grid positions was used.
FIGURE 4
FIGURE 4
Skeletons of vessels from an cSLO image of a MCI participant with overlaid boxes at different number of grid positions, 9 (A), 12 (B), and 15 (C) with their corresponding double-log plots (D–F) of the count of boxes containing meaningful pixels vs. box size showing the slope (D0) and the R2 values of the regression lines. Overlaid boxes on the skeletonized images are shown to indicate that only boxes containing meaningful pixels were counted and used in the computation of the fractal dimension (D0 or the slope). Different number of grid positions are shown in (A–C) from the FracLac settings to show that these parameters were optimized and that a change in the number of grid positions did not result in a change in the slope (D0) or the R2 values (D–F). Hence the recommended number of 12 grid positions was used. For all double log pots of the remaining cognitively impaired and healthy controls, see Supplementary Information.
FIGURE 5
FIGURE 5
The cone contrast test (CCT) design principles showing the Long, Middle, and Short- CCT scores (i.e., Red, Green and Blue CCT scores, respectively). Image modified from Rabin et al. (2011).
FIGURE 6
FIGURE 6
Generalized dimension spectrum Dq vs. q for the cognitively healthy individuals (n = 19, blue trace) and cognitively impaired (n = 20, red trace).
FIGURE 7
FIGURE 7
Retinal topographical features observed in individuals with mild cognitive impairment. (Top row) Central and nasal infrared light-images obtained from a female subject (79 years old) with MCI showing extramacular features such as drusen-like regions depicted by irregularly shaped bright spots in the periphery of the superior quadrant as well as with pigment dispersion in both eyes. (Bottom image: Left) Central and nasal infrared light-images obtained from a female subject (81 years old) with MCI showing tortuous vessels, extramacular features such as drusen-like regions along with pigment dispersion in the left eye. (Right) Nasal infrared-light image obtained from a healthy control (71 years old). All images were acquired with the EasyScan Unit (i-Optics Corporation, The Netherlands). The EasyScan camera is a dual color confocal SLO: Infrared (785 nm) and pure green (532 nm). The different colors are related to different penetration depth. ?The red arrows indicate the location of the drusen and white spots observed at extramacular locations. The ROIs enclosed by the orange rectangles indicate the locations where pigment dispersion was observed. The green light-image (see fundus image shown in Figure 1) is reflected at the retinal nerve fiber layer showing the vascular structure up to the 4th bifurcation. The infrared light-image is reaching the choroidal vessel layer.

References

    1. Aizenstein H. J., Nebes R. D., Saxton J. A., Price J. C., Mathis C. A., Tsopelas N. D., et al. (2008). Frequent amyloid deposition without significant cognitive impairment among the elderly. Arch. Neurol. 65 1509–1517. 10.1001/archneur.65.11.1509 - DOI - PMC - PubMed
    1. Alexander K. R., Rajagopalan A. S., Raghuram A., Fishman G. A. (2006). Activation phase of cone phototransduction and the flicker electroretinogram in retinitis pigmentosa. Vision Res. 46 2773–2785. 10.1016/j.visres.2006.01.007 - DOI - PubMed
    1. Antes R., Ezra-Elia R., Weinberger D., Solomon A., Ofri R., Michaelson D. M. (2013). ApoE4 induces synaptic and ERG impairments in the retina of young targeted replacement apoE4 mice. PLoS One 8:e64949. 10.1371/journal.pone.0064949 - DOI - PMC - PubMed
    1. Armstrong R. A. (1996). Visual field defects in Alzheimer’s disease patients may reflect differential pathology in the primary visual cortex. Optom. Vis. Sci. 73 677–682. 10.1097/00006324-199611000-00001 - DOI - PubMed
    1. Azemin M. Z., Kumar D. K., Wong T. Y., Wang J. J., Mitchell P., Kawasaki R., et al. (2012). Age-related rarefaction in the fractal dimension of retinal vessel. Neurobiol. Aging. 33 194.e1–194.e4. 10.1016/j.neurobiolaging.2010.04.010 - DOI - PubMed

LinkOut - more resources