. 2018 Dec 6:9:2813.
doi: 10.3389/fimmu.2018.02813. eCollection 2018.

MicroRNA-31 Reduces the Motility of Proinflammatory T Helper 1 Lymphocytes

Affiliations

MicroRNA-31 Reduces the Motility of Proinflammatory T Helper 1 Lymphocytes

Markus Bardua et al. Front Immunol. .

Abstract

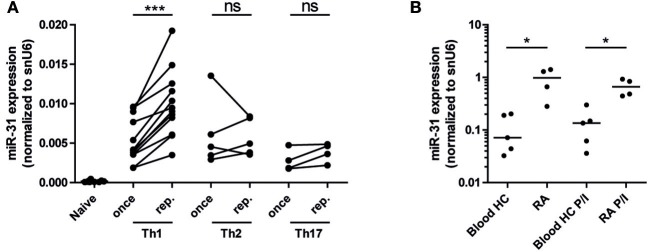
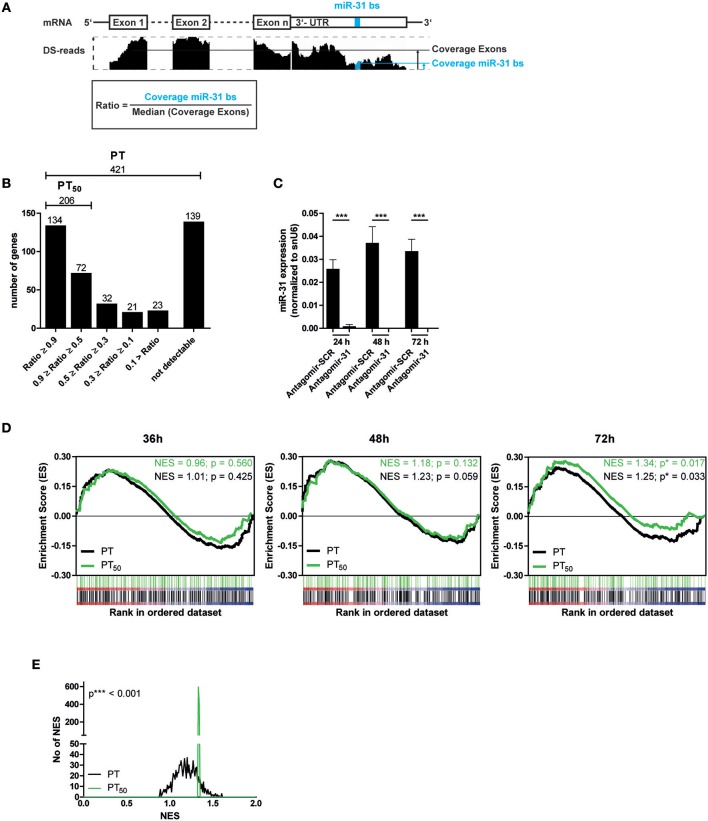
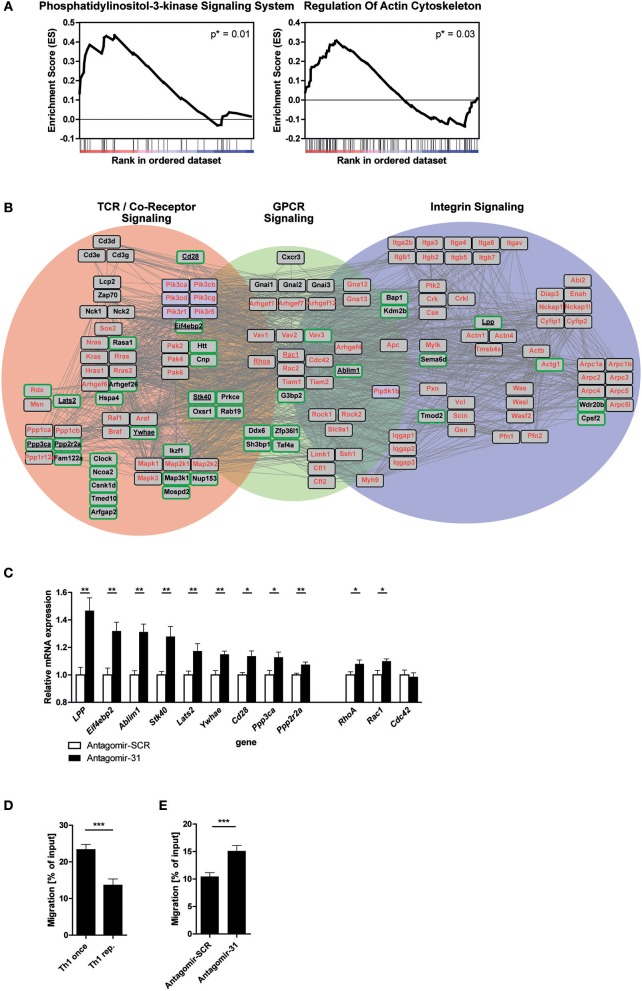
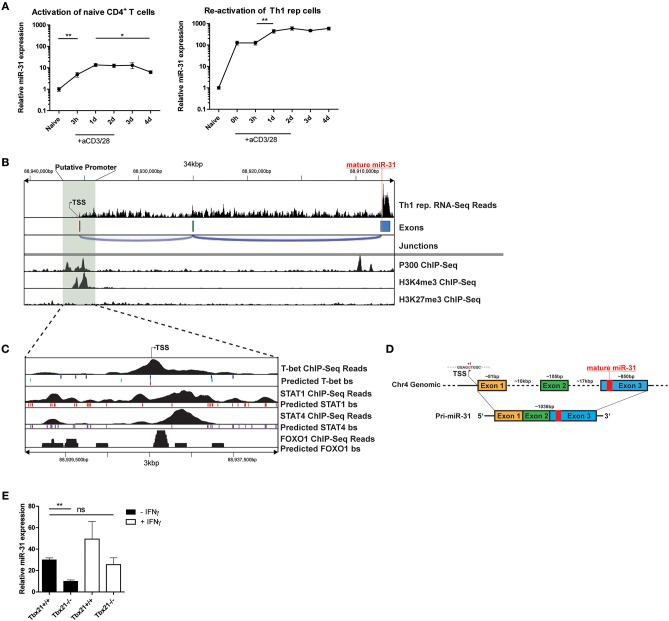
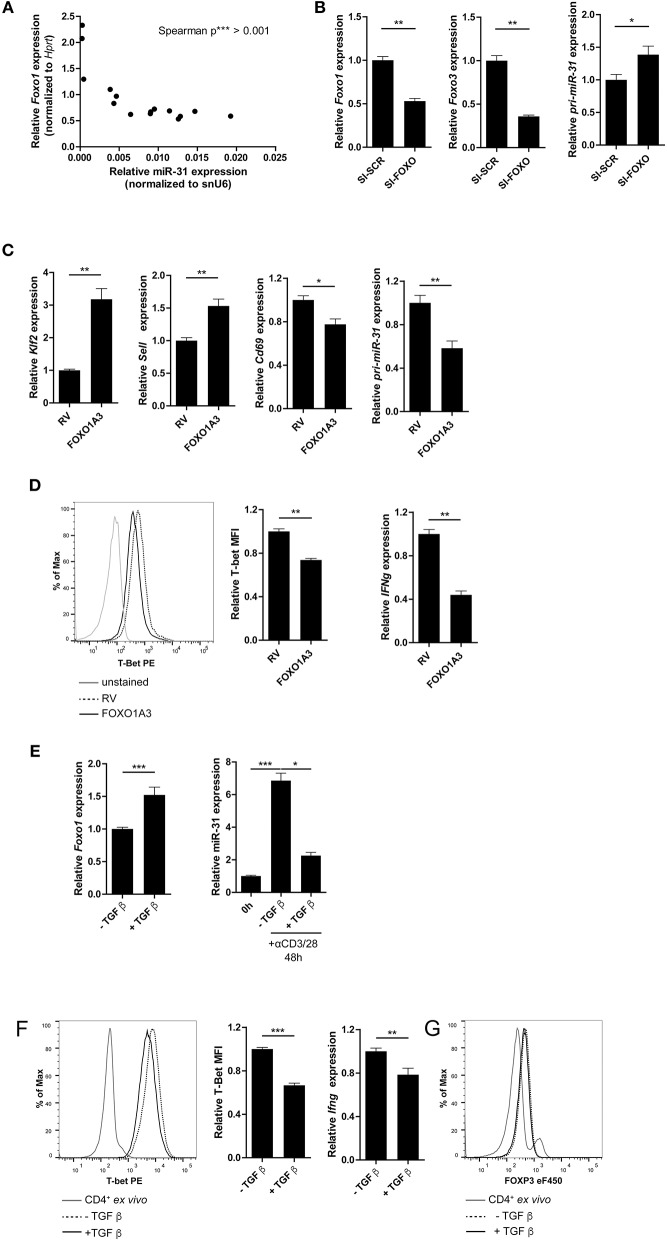
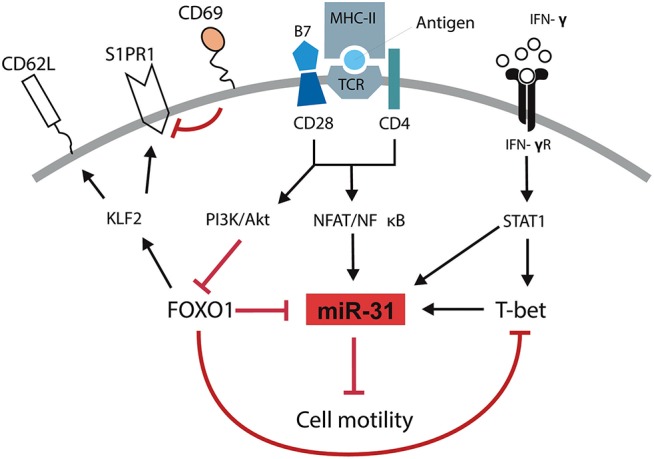
Proinflammatory type 1 T helper (Th1) cells are enriched in inflamed tissues and contribute to the maintenance of chronic inflammation in rheumatic diseases. Here we show that the microRNA- (miR-) 31 is upregulated in murine Th1 cells with a history of repeated reactivation and in memory Th cells isolated from the synovial fluid of patients with rheumatic joint disease. Knock-down of miR-31 resulted in the upregulation of genes associated with cytoskeletal rearrangement and motility and induced the expression of target genes involved in T cell activation, chemokine receptor- and integrin-signaling. Accordingly, inhibition of miR-31 resulted in increased migratory activity of repeatedly activated Th1 cells. The transcription factors T-bet and FOXO1 act as positive and negative regulators of T cell receptor (TCR)-mediated miR-31 expression, respectively. Taken together, our data show that a gene regulatory network involving miR-31, T-bet, and FOXO1 controls the migratory behavior of proinflammatory Th1 cells.

Keywords: CD4; T cell migration; Th1 cells; antagomirs; miR-31; miRNA; regulatory networks; target identification.


Figures

Figure 1
Figure 1
MiR-31 is upregulated in murine Th1 rep cells, and in memory Th cells from the synovial fluid of RA patients. (A) MiR-31 expression in once (day 6) and repeatedly (three rounds of restimulation with 6 day intervals) activated Th1, Th2, Th17, and ex vivo isolated naive CD4+ cells normalized to snU6 determined by qRT-PCR. Each data point represents an independent experiment (n = 12 [naive and Th1], 5 [Th2], 4 [Th17]) (Wilcoxon-Test for paired data, ***p ≤ 0.001). (B) MiR-31 expression normalized to snU6 in CD3+CD4+CD14CD45RO+ T cells isolated from the synovial fluid of patients suffering from RA or blood from healthy control (HC) donors ex vivo or after 3 h of restimulation with PMA/ionomycin (P/I) (n = 5 RA; n = 4 HC) determined by qRT-PCR. Each data point represents an individual donor, horizontal bar: median (Mann-Whitney test for unpaired data, *p ≤ 0.05).
Figure 2
Figure 2
Significant upregulation of miR-31 targets after knock-down of miR-31. (A) Schematic overview of the method to determine the fraction of putative miR-31 target mRNA molecules that contain at least one miR-31 bs in their 3′-UTR. Depicted is the coverage (black bars, middle row) of n exons and the 3′-UTR (upper row) containing the miR-31 bs (indicated in blue). The ratio is calculated from the median coverage of the exons and the coverage of the miR-31 bs in the 3′-UTR (bottom row). (B) 421 putative miR-31 targets were grouped according to the ratio determined in (A). (C) MiR-31 expression in Th1 rep cells 24, 48, and 72 h after activation with αCD3/28 and treatment with Antagomir-31 or Antagomir-SCR normalized to snU6 determined by qRT-PCR. Data is shown as mean +SEM, n = 11, pooled from five independent experiments (Mann-Whitney test for unpaired data, ***p ≤ 0.001). (D) GSEA with the PT- and PT50- gene-sets and the transcriptome data of Th1 rep cells 36, 48, and 72 h after activation with αCD3/28 and treatment with Antagomir-31 or Antagomir-SCR. Data is shown as enrichment curves with each putative target gene (PT, black; PT50, green) in ranked order from most upregulated (left) to most downregulated (right). Nominal p-values are depicted in the figure. (E) Welch's test of nominal enrichment scores (NES) from 1,000 independent GSEA's each using a randomly chosen subset of PT with sizes equal to the size of the PT50 set, p-value is depicted in the figure.
Figure 3
Figure 3
MiR-31 targets a set of genes involved in cytoskeletal rearrangement and miR-31 inhibition increases the motility of Th1 rep cells. (A) GSEA of the transcriptome data obtained from Th1 rep cells 72 h after activation with αCD3/28 and treatment with Antagomir-31 or Antagomir-SCR with the KEGG-pathway database (v. 6.0) used as source for gene-sets. Data of two significantly enriched gene-sets is shown as enrichment curves with all genes in ranked order from most upregulated (left) to most downregulated (right). Nominal p-values are depicted in the figure. (B) Network of validated functional interactions among positively correlated miR-31 targets (green rimmed; Figure 2D) and the genes defining the gene set “regulation of actin cytoskeleton” (red). The resulting network was adapted to T cells (also see methods). Genes without interactions are not included. (C) QRT-PCR of target mRNA expression in reactivated Th1 rep cells 72 h after antagomir treatment relative to Hprt and normalized to Antagomir-SCR treated control. Data is shown as mean +SEM, n = 12 (for Lats2, RhoA, Stk40, Ywhae) pooled from four independent experiments, or n = 6 (for Ablim1, Cd28, Cdc42, Eif4ebp2, LPP, Ppp2r2a, Ppp3ca, Rac1) pooled from two independent experiments (Mann-Whitney test for unpaired data, **p ≤ 0.01, *p ≤ 0.05). (D,E) Transwell migration assays with an ICAM-1 coated membrane (10 μg/ml) and CXCL10 (100 ng/ml) in the lower compartment for once and repeatedly activated Th1 cells, 72 h after reactivation with αCD3/28 (D) and Th1 rep cells, 72 h after antagomir treatment and reactivation with αCD3/28 (E), assessed by flow cytometry, normalized to inserted cell number. Data is shown as mean +SEM, n = 16–18 pooled from four independent experiments (Mann-Whitney test for unpaired data, ***p ≤ 0.001).
Figure 4
Figure 4
TCR/CD28 induced expression of mir-31 is increased by T-Bet and IFN-γ. (A) MiR-31 expression kinetics normalized to snU6 after the first activation of naive CD4+ (left panel) or reactivation of Th1 rep cells (right panel) with αCD3/28, presented relative to values obtained from naive CD4+ cells ex vivo, determined by qRT-PCR. Data is shown as mean ±SEM, n = 8–12 pooled from 3 to 4 independent experiments (One-way Anova with Mann-Whitney test for unpaired data, *p ≤ 0.05, **p ≤ 0.01). (B) RNA-Seq coverage of the miR-31 gene locus in Th1 rep cells (upper row) and analysis of published ChIP-seq data from Th1 cells for p300 (28), H3K4me3 and H3K27me3 (29) using the Cistrome Browser (lower row). (C) Analysis of the putative promoter region as determined in (B) using published ChIP-Seq data obtained from Th1 cells for T-Bet (34), STAT1 (28), and STAT4 (33) and from naive CD4+ T cells (35), as well as predicted conserved binding sites for these transcription factors obtained from ECR Browser. (D) Schematic overview of the murine miR-31 gene locus and the resulting primary transcript as analyzed in (B). (E) MiR-31 expression normalized to Hprt in naive CD4+ cells activated with αCD3/28 in Th1 polarizing conditions for 48 h ± IFN-γ (10 ng/ml), presented relative to values obtained from naive CD4+ cells ex vivo determined by qRT-PCR. Data is shown as mean ±SEM, n = 4–8 pooled from two independent experiments (One-way Anova with Dunn's test for multiple comparison, **p ≤ 0.01).
Figure 5
Figure 5
FOXO1 represses T-bet and miR-31 in Th1 cells. (A) Correlation between miR-31 expression normalized to snU6 and Foxo1 expression normalized to Hprt determined five times in 6 day intervals from naive to Th1 rep cells (qRT-PCR) (n = 15 from one experiment, p value is depicted in the figure). (B) Foxo1, Foxo3 and pri-miR-31 expression normalized to Hprt in repeatedly (two rounds of stimulation) activated Th1 cells, treated with a pool of 8 siRNAs specific for Foxo1 and Foxo3 or a SI-SCR control, analyzed 48 h after siRNA treatment by qRT-PCR, presented relative to the SI-SCR control. Data is shown as mean +SEM, n = 6 pooled from two independent experiments (Mann-Whitney test for unpaired data, *p ≤ 0.05, **p ≤ 0.01) (C) Klf2, Sell, Cd69 and pri-miR-31 expression normalized to Hprt in activated CD4+ cells transduced 36–40 h post activation with a retroviral vector expressing a constitutive active FOXO1 (FOXO1A3) or an empty control vector (RV). Cells were cultured under Th1 polarizing conditions for additional 48 h. Expression was analyzed by qRT-PCR 48 h post transduction and is presented relative to RV. Data is shown as mean +SEM, n = 6 pooled from two independent experiments (Mann-Whitney test for unpaired data, **p ≤ 0.01) (D) Representative intracellular protein staining and T-Bet protein expression in the samples analyzed in (C), presented as MFI of T-Bet, normalized to RV assessed by flow cytometry. Data is shown as mean +SEM, n = 5–11 pooled from three independent experiments (Mann-Whitney test for unpaired data, **p ≤ 0.01). (E) Foxo1 expression normalized to Hprt in Th1 rep cells activated with αCD3/28 under Th1 polarizing conditions for 48 h ±TGFβ, presented relative to values obtained from untreated Th1 rep cells determined by qRT-PCR. Data is shown as mean +SEM, n = 9 pooled from 3 independent experiments (Mann-Whitney test for unpaired data, **p ≤ 0.01, ***p ≤ 0.001). MiR-31 expression normalized to snU6 in the same cells, presented relative to Th1 rep cells before reactivation assessed by qRT-PCR. Data is shown as mean +SEM, n = 9 pooled from three independent experiments (One-way Anova with Dunn's test for multiple comparison, *p ≤ 0.05, ***p ≤ 0.001). (F) Representative intracellular protein staining of Th1 rep cells activated with αCD3/28 under Th1 polarizing conditions for 48 h ±TGFβ and T-Bet protein expression, presented as MFI of T-Bet, normalized to untreated Th1 rep cells. Data is shown as mean +SEM, n = 2–3 pooled from four independent experiments (Mann-Whitney test for unpaired data, ***p ≤ 0.001). Ifng expression normalized to Hprt in the samples analyzed in (A), presented relative to RV. Data is shown as mean +SEM, n = 6 pooled from two independent experiments (Mann-Whitney test for unpaired data, *p ≤ 0.05, **p ≤ 0.01). (G) Representative intracellular FOXP3 protein staining of Th1 rep cells activated with αCD3/28 in Th1 polarizing conditions for 48 h ±TGF-β.
Figure 6
Figure 6
Schematic overview of mechanisms controlling the motility of Th1 rep cells. Antigenic stimulation of the TCR and CD28 leads to the activation of NFAT/NFκB and the PI3K/Akt pathway. IFN-γ induces the activation and expression of STAT1 and T-Bet, respectively. NFAT/NFκB induces the expression of miR-31 which might be amplified by STAT1 and T-bet and reduces the cell motility. PI3K/Akt inactivates FOXO1 which supports the expression of miR-31 either in a direct fashion or by disabling the FOXO1 dependent inhibition of T-bet. Simultaneously, the inhibition of FOXO1 reduces the expression of KLF2, CD62L, and S1PR1 and induces the expression of CD69.

References

    1. Mellado M, Martinez-Munoz L, Cascio G, Lucas P, Pablos JL, Rodriguez-Frade JM. T Cell migration in rheumatoid arthritis. Front Immunol. (2015) 6:384. 10.3389/fimmu.2015.00384 - DOI - PMC - PubMed
    1. Morita Y, Yamamura M, Kawashima M, Harada S, Tsuji K, Shibuya K, et al. . Flow cytometric single-cell analysis of cytokine production by CD4+ T cells in synovial tissue and peripheral blood from patients with rheumatoid arthritis. Arthr Rheum. (1998) 41:1669–76. 10.1002/1529-0131(199809)41:9<1669::AID-ART19>3.0.CO;2-G - DOI - PubMed
    1. Yamada H, Nakashima Y, Okazaki K, Mawatari T, Fukushi JI, Kaibara N, et al. Th1 but not Th17 cells predominate in the joints of patients with rheumatoid arthritis. Ann Rheum Dis. (2008) 67:1299–304. 10.1136/ard.2007.080341 - DOI - PubMed
    1. Niesner U, Albrecht I, Janke M, Doebis C, Loddenkemper C, Lexberg MH, et al. . Autoregulation of Th1-mediated inflammation by twist1. J Exp Med. (2008) 205:1889–901. 10.1084/jem.20072468 - DOI - PMC - PubMed
    1. Haftmann C, Stittrich AB, Zimmermann J, Fang Z, Hradilkova K, Bardua M, et al. . miR-148a is upregulated by Twist1 and T-bet and promotes Th1-cell survival by regulating the proapoptotic gene Bim. Eur J Immunol. (2015) 45:1192–205. 10.1002/eji.201444633 - DOI - PMC - PubMed

Publication types