. 2018 Dec 6:8:555.
doi: 10.3389/fonc.2018.00555. eCollection 2018.

The Polycomb BMI1 Protein Is Co-expressed With CD26+ in Leukemic Stem Cells of Chronic Myeloid Leukemia

Affiliations

The Polycomb BMI1 Protein Is Co-expressed With CD26+ in Leukemic Stem Cells of Chronic Myeloid Leukemia

Sara Galimberti et al. Front Oncol. .

Abstract

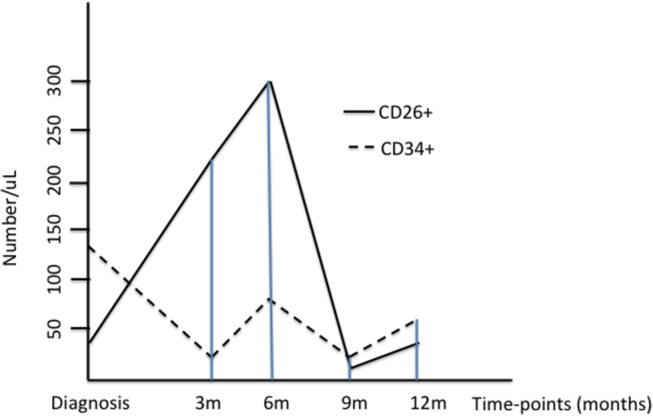
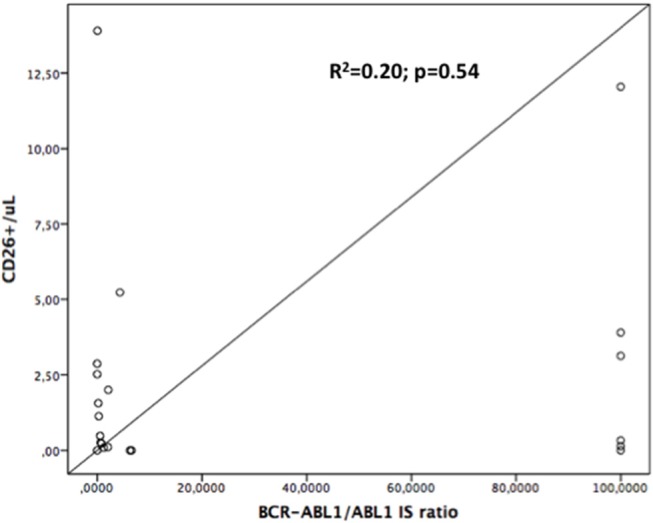
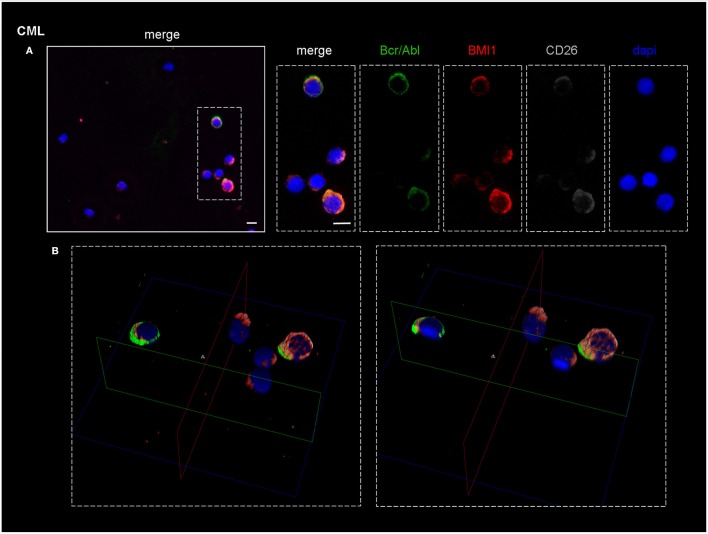
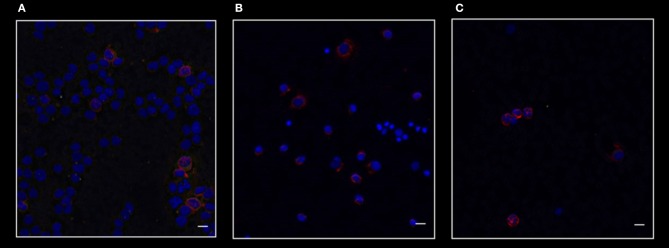
The Polycomb gene BMI1 expression exerts a negative predictive impact on several hematological malignancies, such as acute and chronic myeloid leukemia (CML), myelofibrosis, and follicular lymphoma. As already demonstrated in CML, BMI1 is responsible for the resistance to the tyrosine kinase inhibitors (TKIs) in a BCR-ABL1-independent way. Even if, it is unknown where BMI1 in CML is expressed (in progenitors or more mature cells). We decided, therefore, to evaluate if and where the BMI1 protein is located, focusing mainly on the CD34+/CD38-/CD26+ CML progenitors. To begin we measured, by flow cytometry, the proportion of CD34+/CD26+ cells in 31 bone marrow samples from 20 CML patients, at diagnosis and during treatment with imatinib. After that the bone marrow blood smears were stained with antibodies anti-CD26, BCR-ABL1, and BMI1. These smears were observed by a confocal laser microscope and a 3D reconstruction was then performed. At diagnosis, CD34+/CD26+ cells median value/μL was 0.48; this number increased from diagnosis to the third month of therapy and then reduced during treatment with imatinib. The number and behavior of the CD26+ progenitors were independent from the BCR-ABL1 expression, but they summed up what previously observed about the BMI1 expression modulation. In this work we demonstrate for the first time that in CML the BMI1 protein is co-expressed with BCR-ABL1 only in the cytoplasm of the CD26+ precursors; on the contrary, in other hematological malignancies where BMI1 is commonly expressed (follicular lymphoma, essential thrombocytemia, acute myeloid leukemia), it was not co-localized with CD26 or, obviously, with BCR-ABL1. Once translated into the clinical context, if BMI1 is a marker of stemness, our results would suggest the combination of the BMI1 inhibitors with TKIs as an interesting object of research, and, probably, as a promising way to overcome resistance in CML patients.

Keywords: BCR-ABL1; BMI1; CD26; CML; leukemic stem cell; polycomb.


Figures

Figure 1
Figure 1
The Figure represents the median values of CD34+/CD38- and CD34+/CD26+ progenitors at diagnosis and during treatment with imatinib; for a better understanding, the values of CD26+ cells have been multiplied by ten.
Figure 2
Figure 2
Linear regression curve: CD34+/CD26+ number is not significantly correlated with BCR-ABL1/ABL1 expression, either at diagnosis or during follow-up. R2 = 0.20; p = 0.54.
Figure 3
Figure 3
The Figure represents the median values of CD26+ cells and of the BCR-ABL1/ABL1 transcript at diagnosis and during treatment with imatinib in the whole series (box A), in an “optimal” case (box B), and in a “warning” case (box C).
Figure 4
Figure 4
Confocal laser scanning microscopy: representative images of a bone marrow smear from one of the 9 CML patients enrolled into the study. (A) Bidimensional images of the maximum intensity projection. Scale bars 10 μm. From the right to the left: in blue, the nuclei; in gray, the CD26+ cells; in green, cells expressing BCR-ABL1. The merged imagines show that CD26+ cells co-express both BMI1 and BCR-ABL1. (B) 3D-reconstruction of the merged imagines: BMI1 and BCR-ABL1 are co-expressed in the cytoplasm of the CD26+ cells.
Figure 5
Figure 5
Confocal laser scanning microscopy: representative images of bone marrow smears from patients with acute myeloid leukemia (A), essential thrombocytemia (B), and follicular lymphoma (C). Scale bars 10 μm. Reactions for BMI1 (red), BCR-ABL1 (green), and CD26 (gray). It is clear that in these malignancies only BMI1 is expressed. As expected, these diseases are all CD26- and BCR-ABL1-negative.
Figure 6
Figure 6
Confocal laser scanning microscopy: representative images of a bone marrow smear from one of the 9 CML patients enrolled into the study with a high representation of CD26+ cells. Bidimensional images of the maximum intensity projection. Scale bars 50 μm. From the right to the left: in blue, the nuclei; in pink, the CD26+ cells; in red, the BMI1+ cells. Cluster of cells marked by the arrows co-expressed CD26 and BMI1 antigens.

References

    1. Clark SS, Crist WM, Witte ON. Molecular pathogenesis of Ph-positive leukemias. Annu Rev Med. (1989) 40:113–22. 10.1146/annurev.me.40.020189.000553 - DOI - PubMed
    1. Chereda B, Melo JV. Natural course and biology of CML. Ann Hematol. (2015) 94 (Suppl 2):S107–21. 10.1007/s00277-015-2325-z - DOI - PubMed
    1. Mohammadi M, Cao Y, Glimelius I, Bottai M, Eloranta S, Smedby KE. The impact of comorbid disease history on all-cause and cancer-specific mortality in myeloid leukemia and myeloma–a Swedish population-based study. BMC Cancer (2015) 15:850 10.1186/s12885-015-1857-x - DOI - PMC - PubMed
    1. Soverini S, De Benedittis C, Castagnetti F, Gugliotta G, Mancini M, Bavaro L, et al. In chronic myeloid leukemia patients on second-line tyrosine kinase inhibitor therapy, deep sequencing of BCR-ABL1 at the time of warning may allow sensitive detection of emerging drug-resistant mutants. BMC Cancer (2016) 16:572. 10.1186/s12885-016-2635-0 - DOI - PMC - PubMed
    1. Yang K, Fu LW. Mechanisms of resistance to BCR-ABL TKIs and the therapeutic strategies: a review. Rev Oncol Hematol. (2015) 93:277–92. 10.1016/j.critrevonc.2014.11.001 - DOI - PubMed