. 2019 May;248(1):51-65.
doi: 10.1002/path.5224. Epub 2019 Feb 22.

Inter- and intra-tumoural heterogeneity in cancer-associated fibroblasts of human pancreatic ductal adenocarcinoma

Affiliations

Inter- and intra-tumoural heterogeneity in cancer-associated fibroblasts of human pancreatic ductal adenocarcinoma

Cindy Neuzillet et al. J Pathol. 2019 May.

Abstract

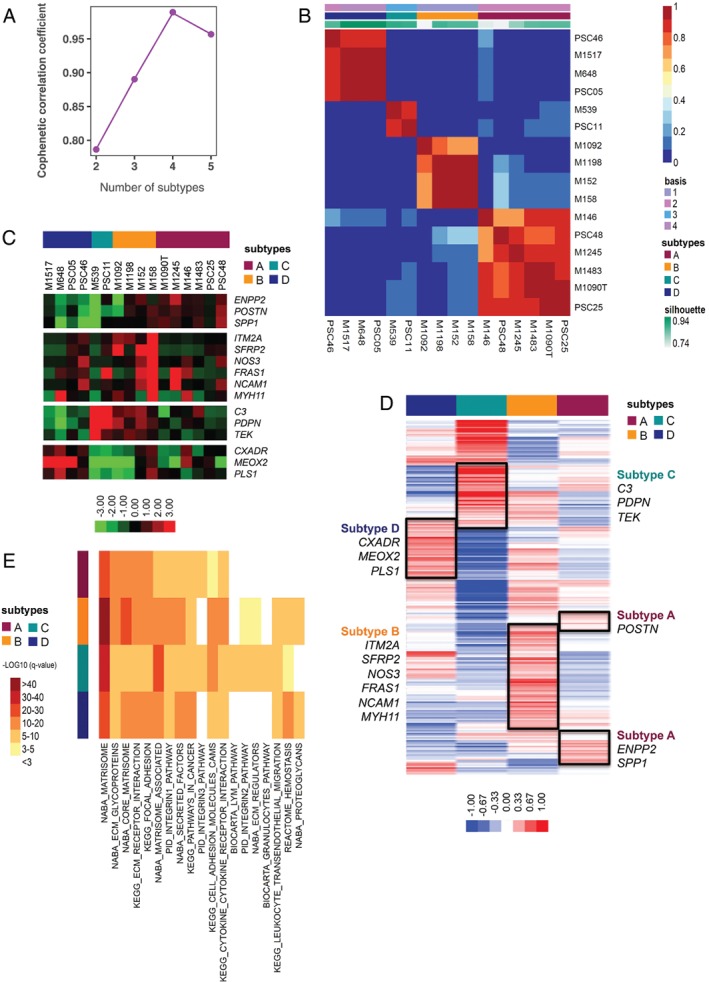
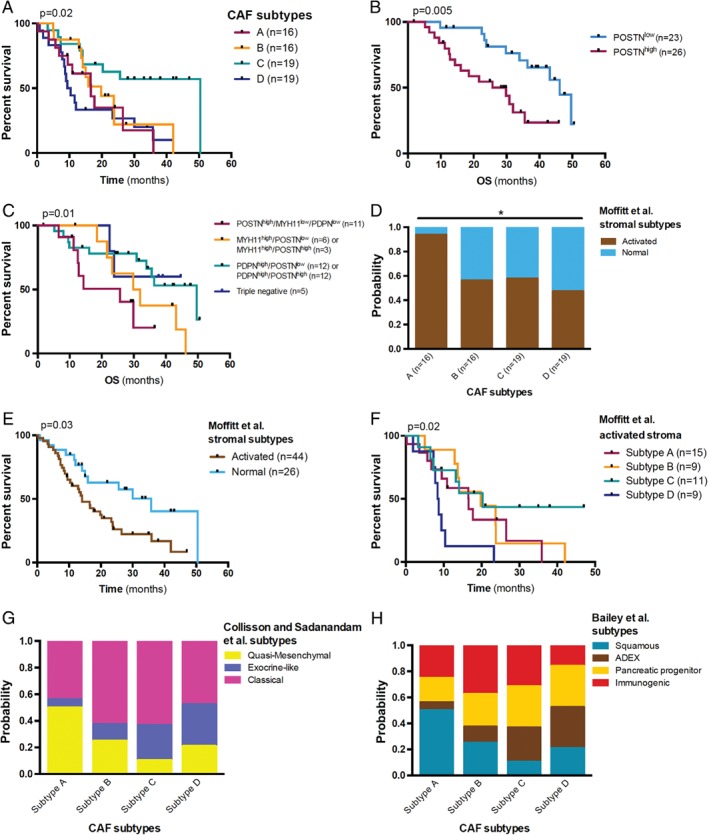
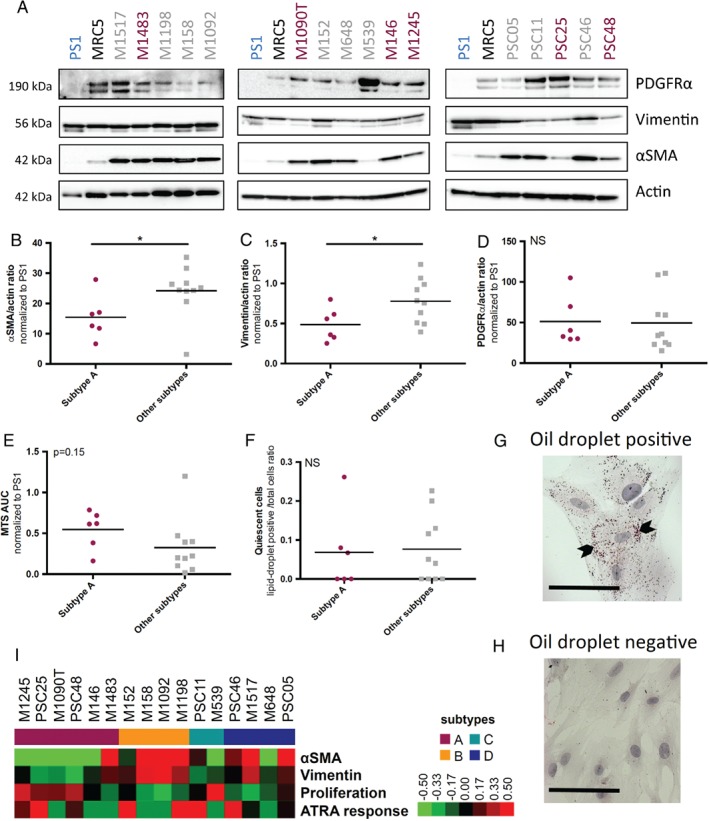
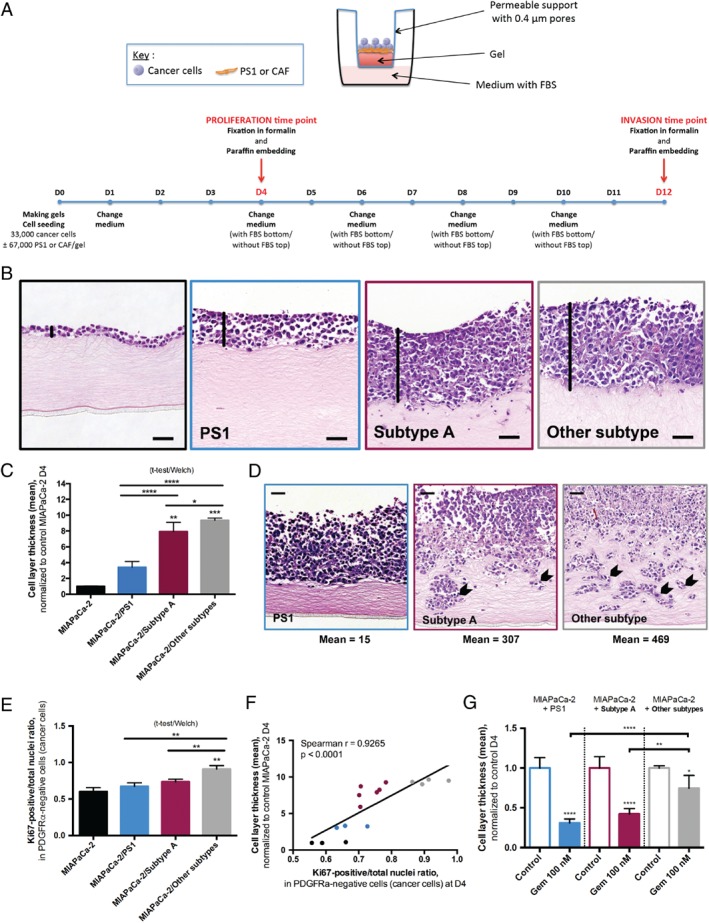
Cancer-associated fibroblasts (CAF) are orchestrators of the pancreatic ductal adenocarcinoma (PDAC) microenvironment. Stromal heterogeneity may explain differential pathophysiological roles of the stroma (pro- versus anti-tumoural) in PDAC. We hypothesised that multiple CAF functional subtypes exist in PDAC, that contribute to stromal heterogeneity through interactions with cancer cells. Using molecular and functional analysis of patient-derived CAF primary cultures, we demonstrated that human PDAC-derived CAFs display a high level of inter- and intra-tumour heterogeneity. We identified at least four subtypes of CAFs based on transcriptomic analysis, and propose a classification for human PDAC-derived CAFs (pCAFassigner). Multiple CAF subtypes co-existed in individual patient samples. The presence of these CAF subtypes in bulk tumours was confirmed using publicly available gene expression profiles, and immunostainings of CAF subtype markers. Each subtype displayed specific phenotypic features (matrix- and immune-related signatures, vimentin and α-smooth muscle actin expression, proliferation rate), and was associated with an assessable prognostic impact. A prolonged exposure of non-tumoural pancreatic stellate cells to conditioned media from cancer cell lines (cancer education experiment) induced a CAF-like phenotype, including loss of capacity to revert to quiescence and an increase in the expression of genes related to CAF subtypes B and C. This classification demonstrates molecular and functional inter- and intra-tumoural heterogeneity of CAFs in human PDAC. Our subtypes overlap with those identified from single-cell analyses in other cancers, and pave the way for the development of therapies targeting specific CAF subpopulations in PDAC. © 2018 The Authors. The Journal of Pathology published by John Wiley & Sons Ltd on behalf of Pathological Society of Great Britain and Ireland.

Keywords: pancreatic stellate cell; stroma; transcriptomics; tumour microenvironment; tumour-stroma interactions.


Figures

Figure 1
Figure 1
PDAC CAF classification (pCAFassigner). (A) Cophenetic correlation plot for k = 2 to k = 5 classes after NMF for transcriptome of the 16 patient‐derived CAF primary cultures. The maximum cophenetic coefficient value was reached for k = 4 classes (>0.99). (B) Consensus matrix clustering after NMF for transcriptome of the 16 patient‐derived CAF primary cultures for k = 4 classes. (C) Heatmap with hierarchical clustering for 15 selected metagenes that were found most discriminating between patient‐derived CAF primary cultures (short pCAFassigner). Significantly higher expression is shown in red and lower expression in green. (D) Heatmap showing 248 metagenes (extended pCAFassigner) between CAF subtypes, based on PAM‐derived centroids. Significantly higher expression is shown in red and lower expression in blue. (E) Gene expression pathways using mSigDB database 54. We selected genes from the extended pCAFassigner with a PAM centroid value >0.10 in each CAF subtype. Top‐10 pathways for each CAF subtype are displayed. Significantly lower q‐value (i.e. FDR‐adjusted P value) is shown in red and higher q‐value in yellow/white.
Figure 2
Figure 2
Molecular markers for PDAC CAF. (A) Heatmap of CAF culture (n = 16) probability of belonging to pCAFassigner subtypes. Significantly higher probability is shown in red and lower probability in blue. (B) Correlation of pCAFassigner subtype PAM centroids with Lambrechts et al 16 fibroblast subtype gene expression. Only positive correlations were shown. (C) PAM centroids (expression levels) of POSTN, MYH11, and PDPN according to pCAFassigner subtypes. (D) H&E stain and immunohistochemical staining for periostin (POSTN), myosin‐11 (MYH11), podoplanin (PDPN), αSMA and PDGFRα on serial sections from a resected PDAC sample. Scale bars: 100 μm. (E) Representative pictures of IHC staining for periostin (POSTN), myosin‐11 (MYH11) and podoplanin (PDPN) in human PDAC samples, showing spatial pattern at the invasive margin and in the juxta‐tumoural stroma and pan‐stroma. Scale bar: 100 μm. (F) Immunofluorescence co‐staining of POSTN (green), MYH11 (red or green), PDPN (red) and DAPI (blue) on PSC25 (subtype A), PSC48 (mixed, subtype A dominant > B) and PSC11 (subtype C) (merged images). Percentages of positive cells for each marker are displayed. Scale bar: 100 μm.
Figure 3
Figure 3
Prognostic impact of PDAC CAF subtypes. (A) Kaplan–Meier curves for OS in the ICGC dataset (n = 70 PDAC samples with RNAseq data from bulk tumour tissue). Subtype A is displayed in red, B in orange, C in green, and D in blue. Log‐rank tests, overall: p = 0.02; subtype C versus others: p = 0.004; subtype D versus others: p = 0.03; other comparisons: N.S. (B) Kaplan–Meier curves for OS according to periostin (POSTN) expression level by IHC (n = 49). High POSTN expression was defined as moderate or strong staining in >50% of stromal surface. Median OS: 29.8 months versus 46.2 months, in POSTNhigh versus POSTNlow group, respectively. Log‐rank test, p = 0.005. (C) Kaplan–Meier curves for OS according to combined POSTN, myosin‐11 (MYH11) and podoplanin (PDPN) expression level by IHC (n = 49). High POSTN expression was defined as moderate or strong staining in >50% of stromal surface. High MYH11 and PDPN expressions were defined as the presence of strong stromal staining. In case of simultaneous high expression of MYH11 and PDPN, the tumour was classified according to the most abundant subpopulation. Median OS in POSTNhigh/MYH11low/PDPNlow (red): 25.7 months, MYH11high/POSTNlow or MYH11high/POSTNhigh (orange): 30.9 months, PDPNhigh/POSTNlow or PDPNhigh/POSTNhigh (green): 49.6 months, triple negative (POSTNlow/MYH11low/PDPNlow, blue): undefined. Log‐rank test for trend, p = 0.01. (D) Association between pCAFassigner subtypes and Moffitt et al stroma subtypes in the ICGC dataset (n = 70) as assessed by NTP analysis. Chi‐square test, p = 0.03. (E) Kaplan–Meier curves for OS according to Moffitt et al stroma subtypes in the ICGC dataset (n = 70). Median OS: 14.1 months versus 35.8 months in activated versus normal stroma, respectively. Log‐rank test, p = 0.03. (F) Kaplan–Meier curves for OS according to CAF subtypes in the Moffitt et al activated stroma group from the ICGC dataset (n = 44). Log‐rank test, p = 0.02. Median OS in subtype A: 16.6 months, subtype B: 19.8 months, subtype C: 20.3 months, and subtype D: 8.6 months. (G) Association between pCAFassigner subtypes and Collisson et al 11 tumour subtypes in the ICGC dataset (n = 70) as assessed by NTP analysis. Chi‐square test, p = 0.12 (overall), p = 0.03 (subtype A versus others). (H) Association between pCAFassigner subtypes and Bailey et al 12 tumour subtypes in the ICGC dataset (n = 70) as assessed by NTP analysis. Chi‐square test, p = 0.24 (overall), p = 0.06 (subtype A versus others).
Figure 4
Figure 4
Phenotypic features of PDAC CAF subtypes. (A) αSMA, vimentin, PDGFRα, and β‐actin (actin) expression in CAF primary cultures (n = 16) and PS1 and MRC5 (human embryonic lung fibroblast) cell lines (used as controls) by western blot. Subtype A CAFs are displayed in red and other subtypes in grey. (B) Quantification of αSMA expression normalised to β‐actin (actin) using ImageJ (National Institute of Health, (Bethesda, MA, USA), according to pCAFassigner subtype (n = 16). αSMA mean expression normalised to PS1: 15.4 ± 7.2 in subtype A versus 24.2 ± 8.5 in other subtypes, unpaired t‐test with Welch's correction, p = 0.048. (C) Quantification of vimentin expression normalised to β‐actin (actin) using ImageJ, according to pCAFassigner subtype (n = 16). Vimentin mean expression normalised to PS1: 0.49 ± 0.21 in subtype A versus 0.78 ± 0.27 in other subtypes, unpaired t‐test with Welch's correction, p = 0.031. (D) Quantification of PDGFRα expression normalised to β‐actin (actin) using ImageJ, according to pCAFassigner subtype (n = 16). PDGFRα mean expression normalised to PS1: 51.2 ± 30.4 in subtype A versus 49.6 ± 35.0 in other subtypes, unpaired t‐test with Welch's correction, p = 0.92. (E) AUC assessed by MTS assay in CAF primary cultures, according to pCAFassigner subtype (n = 16). Mean AUC normalised to PS1: 0.55 ± 0.23 in subtype A versus 0.32 ± 0.34 in other subtypes, unpaired t‐test with Welch's correction, p = 0.15. (F) Ratio of lipid‐droplet‐positive (quiescent) cells over total cells, assessed by Oil Red O staining, in all‐trans retinoic acid (ATRA)‐treated CAF primary cultures (1 μm daily, for 5–7 days, until confluency; n = 16). Mean ratio: 0.068 ± 0.10 in subtype A versus 0.076 ± 0.087 in other subtypes, unpaired t‐test with Welch's correction, p = 0.87. (G,H) Representative images of ATRA‐responsive (positive) cells (G) and ATRA‐non‐responsive (negative) cells (H) after Oil Red O staining. (I) Heatmap summarising primary CAF culture (n = 16) features in terms of αSMA (αSMA/actin ratio by western blot), vimentin (vimentin/actin ratio by western blot) expression, proliferation (AUC of MTS curve), and ATRA response (lipid‐droplet‐positive cells/total cells ratio). All values were normalised to PS1 as a reference. Significantly higher values are shown in red and lower values in green.
Figure 5
Figure 5
Influence of cancer‐associated fibroblast (CAF) subtypes on cancer cells. (A) Overview of the mini‐organotypic experimental system and timelines. (See supplementary material, Supplementary Methods, for detailed description.) (B) Representative images of H&E‐stained sections of mini‐organotypics after 4 days (D4), with MIAPaCa‐2 cells alone (top left), or in co‐culture with PS1 (top right), subtype‐A CAFs (bottom left) or other‐subtype CAFs (bottom right). Black vertical lines highlight the cell layer thickness. Scale bar: 50 μm. (C) Cell proliferation at D4 assessed by the cell layer thickness, measured at two representative points per field in an average of 3 fields with 10 × magnification on H&E‐stained slides (one mean value per gel). Mean cell layer thickness normalised to MIAPaCa‐2 alone: 1.00 ± 0.06 in MIAPaCa‐2 alone (triplicate), 3.41 ± 0.74 in MIAPaCa‐2/PS1 co‐culture (triplicate), 7.93 ± 1.16 in MIAPaCa‐2/subtype A CAF co‐culture (n = 2 distinct CAF cultures) and 9.39 ± 0.27 in MIAPaCa‐2/other‐subtype CAF co‐culture (n = 2 distinct CAF cultures), Kruskal–Wallis: p < 0.0001. Dunn's multiple comparisons: MIAPaCa‐2 alone versus MIAPaCa‐2/subtype A: p < 0.01, MIAPaCa‐2 alone versus MIAPaCa‐2/other subtypes: p < 0.001, other comparisons: N.S. MIAPaCa‐2/subtype A versus MIAPaCa‐2/other subtype comparison, unpaired t‐test with Welch's correction: p = 0.028. MIAPaCa‐2/PS1 versus MIAPaCa‐2/subtype A and MIAPaCa‐2/PS1 versus MIAPaCa‐2/other subtype comparison, unpaired t‐test with Welch's correction: p < 0.001. (D) Representative pictures of H&E‐stained sections for cell invasion at D12 in MIAPaCa‐2/PS1 co‐cultures, MIAPaCa‐2/subtype‐A CAF and MIAPaCa‐2/other‐subtype CAF co‐cultures (n = 1 primary CAF culture per subtype). MIAPaCa‐2 alone: no invasion. Arrows point at invading cells. Scale bar: 50 μm. (E) Cell proliferation at D4 assessed by the ratio of Ki67‐positive nuclei over the total number of nuclei in cancer cells (PDGFRα‐negative). Mean ratio: 0.60 ± 0.05 in MIAPaCa‐2 alone (triplicate), 0.67 ± 0.05 in MIAPaCa‐2/PS1 co‐culture (triplicate), 0.74 ± 0.04 in MIAPaCa‐2/subtype‐A CAF co‐culture (n = 2 distinct CAF cultures) and 0.91 ± 0.05, in MIAPaCa‐2/other‐subtype CAF co‐culture (n = 2 distinct CAF cultures), Kruskal–Wallis: p = 0.0001. Dunn's multiple comparisons: MIAPaCa‐2 alone versus MIAPaCa‐2/other subtypes: p < 0.01, other comparisons: NS. MIAPaCa‐2/subtype A versus MIAPaCa‐2/other subtype comparison, unpaired t‐test with Welch's correction: p = 0.001. MIAPaCa‐2/PS1 versus MIAPaCa‐2/subtype A and MIAPaCa‐2/PS1 versus MIAPaCa‐2/other subtype comparison, unpaired t‐test with Welch's correction: p = 0.13 and p = 0.002, respectively. (F) Correlation plot between cell layer thickness and Ki67‐based proliferation. MIAPaCa‐2 monocultures are displayed in black, MIAPaCa‐2/PS1 co‐cultures in blue, MIAPaCa‐2/subtype‐A CAF co‐cultures in red and MIAPaCa‐2/other‐subtype CAF co‐cultures in grey. Spearman r = 0.9265, p < 0.0001. (G) Cell proliferation at D4 assessed by the cell layer thickness in control or gemcitabine‐treated (concentration: 100 nm = IC50 of MIAPaCa‐2 alone) mini‐organotypics, normalised to control in each group (triplicate for PS1 co‐culture and n = 2 distinct CAF cultures per subtype for primary cultures). One‐way ANOVA with Sidak's multiple comparisons, mean difference gemcitabine‐treated versus control in MIAPaCa‐2/other‐subtype CAF co‐cultures: 0.26 [0.004–0.51]; in MIAPaCa‐2/subtype‐A CAF co‐cultures: 0.58 [0.41–0.74], p ≤ 0.01; in MIAPaCa‐2/PS1: 0.69 [0.55–0.84], p ≤ 0.0001.
Figure 6
Figure 6
Pancreatic stellate cell (PSC)‐ cancer‐associated fibroblasts (CAF) dynamics. (A) Ratio of large cells over total cell number in parental PS1, following 2‐month education (‘Educated’), and after 1‐month wash‐out period in normal medium (reversion, ‘Rev’). Mean ratio in parental PS1 versus educated PS1 (duplicate): 0.050 ± 0.016 versus 0.099 ± 0.026, unpaired t‐test with Welch's correction, p = 0.006. (B) Ratio of lipid‐droplet‐positive (quiescent) cells over total cell number in parental PS1 upon all‐trans retinoic acid (ATRA) treatment (1 μm daily, for 5 days), following 2‐month education, and after 1‐month wash‐out period in normal medium (Rev). Mean ratio in parental PS1 versus educated PS1 (duplicate): 0.11 ± 0.04 versus 0.01 ± 0.01, unpaired t‐test with Welch's correction, p = 0.006. C Quantification of αSMA expression normalised to β‐actin (actin) using ImageJ, in parental PS1, following 2‐month education with MIAPaCa‐2 or AsPC‐1 CM, and after 1‐month wash‐out period in standard medium (Rev). Mean expression in parental PS1 versus educated PS1 (duplicate): 0.89 ± 0.16 versus 0.47 ± 0.21, unpaired t‐test with Welch's correction, p = 0.07. (D) Venn diagram showing the overlap (n = 60 genes) between pCAFassigner metagenes (n = 248) and education‐modulated genes (n = 101, variance <0.25 in parental PS1). (E) Representative pictures of H&E‐stained slides in mini‐organotypics with PS1 embedded in the gel in parental PS1, MIAPaCa‐2‐educated PS1, and AsPC‐1‐educated PS1. Scale bar: 50 μm. (F) Modulation (log10(fold‐change)) of CAF subtype‐specific genes in MIAPaCa‐2‐educated PS1 versus parental PS1. One‐way ANOVA: p = 0.10. (G) Modulation (log(fold‐change)) of CAF‐subtype specific genes in AsPC‐1‐educated PS1 versus parental PS1. One‐way ANOVA: p = 0.16. (H) Pancreatic CAF heterogeneity model. CAF subtypes were associated with distinct molecular and functional features (ECM‐ and immune‐related signatures, intra‐tumoural spatial pattern of expression, vimentin and αSMA expression, proliferation rate, tumour‐promoting and chemoprotective capabilities) and had a prognostic impact. Periostin (POSTN), myosin‐11 (MYH11) and podoplanin (PDPN) were identified as subtype A, B and C markers, respectively.

References

    1. Neesse A, Algul H, Tuveson DA, et al Stromal biology and therapy in pancreatic cancer: a changing paradigm. Gut 2015; 64: 1476–1484. - PubMed
    1. Apte MV, Wilson JS, Lugea A, et al A starring role for stellate cells in the pancreatic cancer microenvironment. Gastroenterology 2013; 144: 1210–1219. - PMC - PubMed
    1. Carapuca EF, Gemenetzidis E, Feig C, et al Anti‐stromal treatment together with chemotherapy targets multiple signalling pathways in pancreatic adenocarcinoma. J Pathol 2016; 239: 286–296. - PMC - PubMed
    1. Apte MV, Haber PS, Applegate TL, et al Periacinar stellate shaped cells in rat pancreas: identification, isolation, and culture. Gut 1998; 43: 128–133. - PMC - PubMed
    1. Erkan M, Adler G, Apte MV, et al StellaTUM: current consensus and discussion on pancreatic stellate cell research. Gut 2012; 61: 172–178. - PMC - PubMed

Publication types

MeSH terms