. 2019 Jul;17(7):1380-1393.
doi: 10.1111/pbi.13062. Epub 2019 Feb 9.

A large nested association mapping population for breeding and quantitative trait locus mapping in Ethiopian durum wheat

Affiliations

A large nested association mapping population for breeding and quantitative trait locus mapping in Ethiopian durum wheat

Yosef G Kidane et al. Plant Biotechnol J. 2019 Jul.

Abstract

The Ethiopian plateau hosts thousands of durum wheat (Triticum turgidum subsp. durum) farmer varieties (FV) with high adaptability and breeding potential. To harness their unique allelic diversity, we produced a large nested association mapping (NAM) population intercrossing fifty Ethiopian FVs with an international elite durum wheat variety (Asassa). The Ethiopian NAM population (EtNAM) is composed of fifty interconnected bi-parental families, totalling 6280 recombinant inbred lines (RILs) that represent both a powerful quantitative trait loci (QTL) mapping tool, and a large pre-breeding panel. Here, we discuss the molecular and phenotypic diversity of the EtNAM founder lines, then we use an array featuring 13 000 single nucleotide polymorphisms (SNPs) to characterize a subset of 1200 EtNAM RILs from 12 families. Finally, we test the usefulness of the population by mapping phenology traits and plant height using a genome wide association (GWA) approach. EtNAM RILs showed high allelic variation and a genetic makeup combining genetic diversity from Ethiopian FVs with the international durum wheat allele pool. EtNAM SNP data were projected on the fully sequenced AB genome of wild emmer wheat, and were used to estimate pairwise linkage disequilibrium (LD) measures that reported an LD decay distance of 7.4 Mb on average, and balanced founder contributions across EtNAM families. GWA analyses identified 11 genomic loci individually affecting up to 3 days in flowering time and more than 1.6 cm in height. We argue that the EtNAM is a powerful tool to support the production of new durum wheat varieties targeting local and global agriculture.

Keywords: GWAS; breeding; multiparental mapping; quantitative trait loci; smallholder farmers; tetraploid wheat.


Conflict of interest statement

The authors declare no conflicts of interest.

Figures
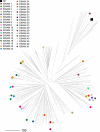
Figure 1
Figure 1
Molecular diversity of the EtNAM founder lines based on 30 155 SNPs reported in Mengistu et al. (2016). The NJ phylogeny represents the molecular diversity of Ethiopian durum wheat. Two main clades are present: the smaller clade of MVs (top right), and the larger clade of FVs (bottom left). EtNAM founder lines with a known genetic makeup are projected on the tree, and are represented as points coloured according to the legend. The recurrent founder (RF), Asassa, is represented by a dark square and groups together with the MV Bidi (EtNAM 51) in the monophyletic cluster top right. Data from Mengistu et al. (2016)
Figure 2
Figure 2
Phenotypic diversity of the EtNAM founder lines based on data reported in Mengistu et al. (2016), Kidane et al. (2017b) and Mancini et al. (2017). (a) Distribution of the EtNAM founder lines according to phenology traits (DB, days to booting; DF, days to flowering; DM, days to maturity). EtNAM founders are represented by points coloured according to the legend and are overlaid on a bar plot reporting the distribution of the trait. (b) Distribution of EtNAM founder lines according to agronomic traits, as depicted in panel (a) (SPL, spike length; SPS, number of seeds per spike; TGW, thousand grain weight; NET, number of effective tillers; GY, grain yield; BM, biomass; PH, plant height). (c) Distribution of EtNAM founder lines according to smallholder farmers’ appreciation measured in Geregera (Amhara, Ethiopia) and Hagreselam (Tigray, Ethiopia). Farmer traits are: Earliness, appreciation of flowering time; Spike, appreciation of the spike traits; Overall, general appreciation of the variety; Tillering, appreciation of tillering capacity. In each scatter plot, the x‐axis reports the value given by farmers in Hagreselam, and the y‐axis reports the value given by farmers in Geregera (from 1, low appreciation, to 5, high appreciation). A regression line is reported in gray in each plot. EtNAM founders are depicted as in panel (a). Details of the linear model run across locations are reported above each graph.
Figure 3
Figure 3
Molecular diversity of the EtNAM subset. (a) NJ phylogeny representing the genetic relationship across EtNAM RILs, coloured according to the EtNAM family of provenance as per the legend. EtNAM founder lines are represented by larger points following the same colouring scheme. (b) Outcome of PCA on genotyping data. PC1 and PC2 are shown on the x‐ and y‐axes, respectively, along with their explained variance. EtNAM RILs and founder lines are represented as in panel A.
Figure 4
Figure 4
Deviation in founder contributions across EtNAM genomes. The binned genomic positions are reported on the x‐axis. The EtNAM families are reported on the y‐axis. The deviation from the expected founder contribution is represented by increasing shades of red (RF overrepresented) or blue (alternative founder overrepresented). The significance of the deviation is represented in negative log scores of chi‐squared test P‐values combined within each genomic bin. The threshold for significance is 13.
Figure 5
Figure 5
Linkage disequilibrium (LD) in the EtNAM subset. (a) LD (y‐axis) decay over physical distance (x‐axis) in each Chr, coloured according to the legend. The distance needed for a lack of LD (r 2 = 0.2) is represented by vertical dashed lines for each Chr. (b) Pairwise LD measures on Chr 3B, the Chr with the slowest LD decay. Markers are ordered according to their physical positions, and black segments are projected onto their map position. Increasing values of r 2 are reported in increasing shades of red according to the legend. (c) LD evolution across Chr 3B. LD measures are averaged within genomic bins and represented as a continuous line coloured as per panel (a). The Mb positions across the Chr are shown on the x‐axis. Molecular markers available on Chr 3B are represented by grey ticks at the bottom of the plot in the corresponding physical positions.
Figure 6
Figure 6
Outcome of the GWA analysis on the EtNAM. (a) Manhattan plot overlapping the GWA scans results on DB, DH, and DM with colours according to legend top left. On the x axis, the physical position of tested markers with a representation of SNP density in colours according to the scale bottom right. On the y axis, the significance of each association reported in negative logarithm of P values. The threshold represents a Bonferroni correction for a nominal P < 0.1. Markers surpassing the threshold (dashed black line) are QTNs. The insert top right represents the QQ plot for all tested traits. (b) Manhattan plot resulting from the GWA for PH, represented as in panel (a). QTNs are highlighted in red.

References

    1. Albrechtsen, A. , Nielsen, F.C. and Nielsen, R. (2010) Ascertainment biases in SNP chips affect measures of population divergence. Mol. Biol. Evol. 27, 2534–2547. - PMC - PubMed
    1. Alvarez, J.B. , Caballero, L. , Nadal, S. , Ramírez, M.C. and Martín, A. (2009) Development and gluten strength evaluation of introgression lines of Triticum urartu in durum wheat. Cereal Res. Commun. 37, 243–248.
    1. Aoun, M. , Kolmer, J.A. , Rouse, M.N. , Chao, S. , Bulbula, W.D. , Elias, E.M. and Acevedo, M. (2017) Inheritance and bulked segregant analysis of leaf rust and stem rust resistance in durum wheat genotypes. Phytopathology, 107, 1496–1506. - PMC - PubMed
    1. Avni, R. , Nave, M. , Eilam, T. , Sela, H. , Alekperov, C. , Peleg, Z. , Dvorak, J. et al. (2014) Ultra‐dense genetic map of durum wheat × wild emmer wheat developed using the 90K iSelect SNP genotyping assay. Mol. Breed. 34, 1549–1562.
    1. Avni, R. , Nave, M. , Barad, O. , Baruch, K. , Twardziok, S.O. , Gundlach, H. , Hale, I. et al. (2017) Wild emmer genome architecture and diversity elucidate wheat evolution and domestication. Science, 357, 93–97. - PubMed

Publication types