. 2018 Dec 21;9(1):5317.
doi: 10.1038/s41467-018-07607-x.

Human genome-wide measurement of drug-responsive regulatory activity

Affiliations

Human genome-wide measurement of drug-responsive regulatory activity

Graham D Johnson et al. Nat Commun. .

Abstract

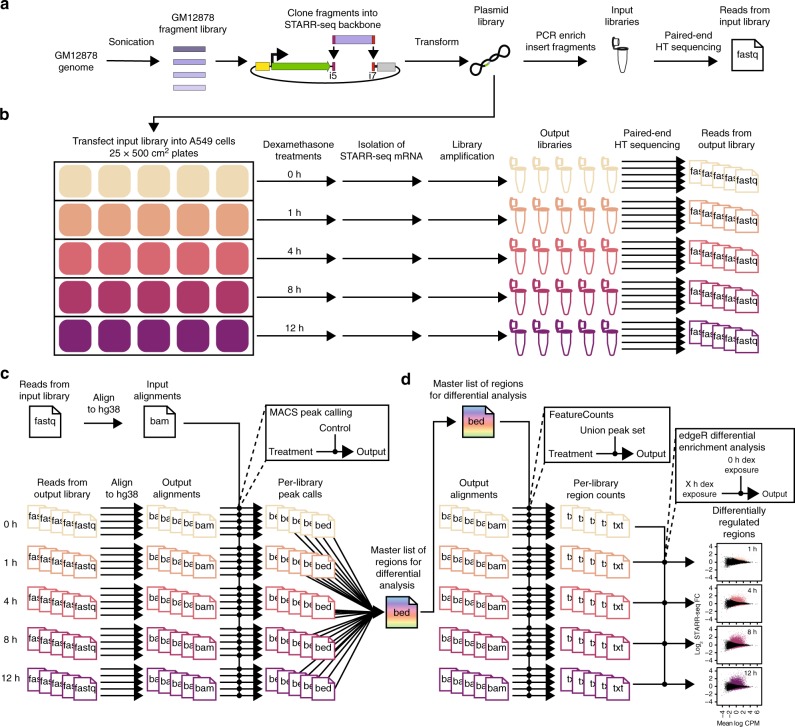
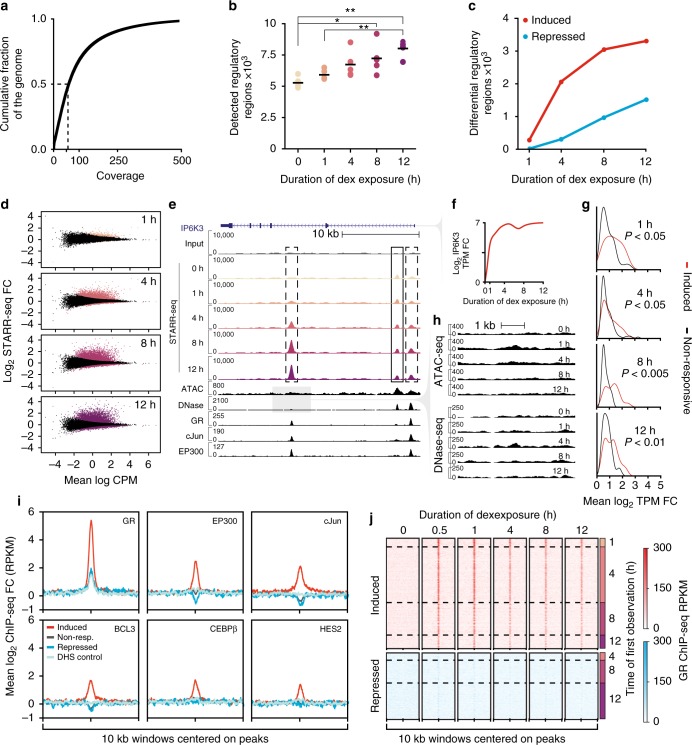
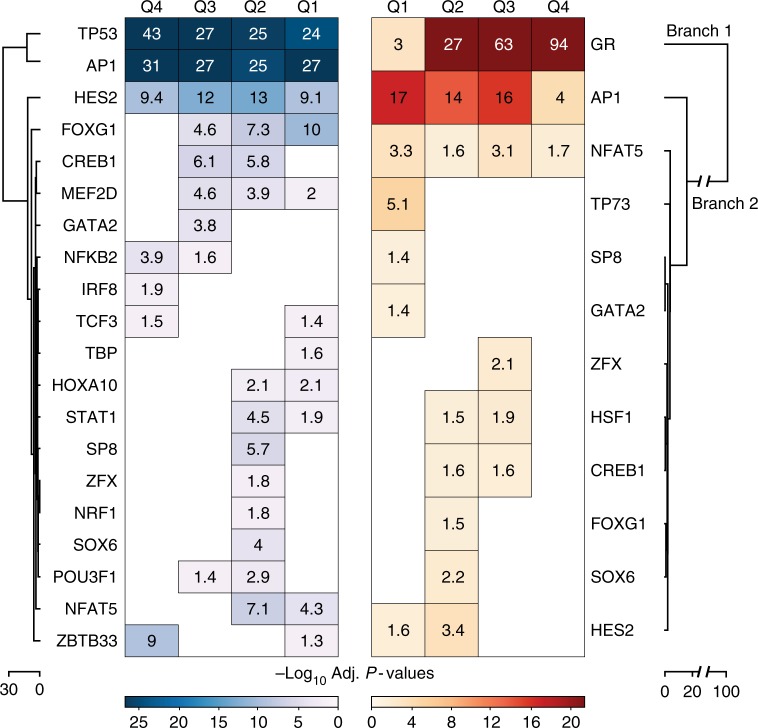
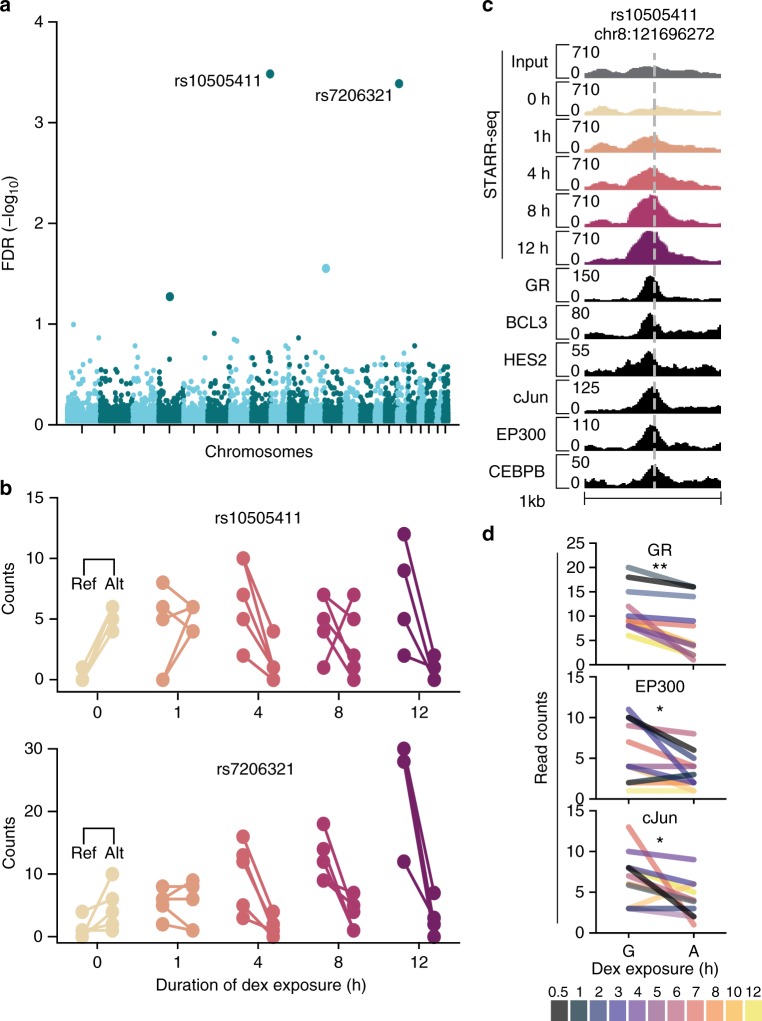
Environmental stimuli commonly act via changes in gene regulation. Human-genome-scale assays to measure such responses are indirect or require knowledge of the transcription factors (TFs) involved. Here, we present the use of human genome-wide high-throughput reporter assays to measure environmentally-responsive regulatory element activity. We focus on responses to glucocorticoids (GCs), an important class of pharmaceuticals and a paradigmatic genomic response model. We assay GC-responsive regulatory activity across >108 unique DNA fragments, covering the human genome at >50×. Those assays directly detected thousands of GC-responsive regulatory elements genome-wide. We then validate those findings with measurements of transcription factor occupancy, histone modifications, chromatin accessibility, and gene expression. We also detect allele-specific environmental responses. Notably, the assays did not require knowledge of GC response mechanisms. Thus, this technology can be used to agnostically quantify genomic responses for which the underlying mechanism remains unknown.


Conflict of interest statement

T.E.R. is a co-founder and consultant for Element Genomics which uses high-throughput reporter assays to study gene regulation. The remaining authors declare no competing interests.

Figures

Fig. 1
Fig. 1
Genome-wide high-throughput reporter library and experimental design. a We sheared GM12878 genomic DNA to ~400 bp and cloned into the 3′-UTR of the STARR-seq reporter gene. STARR-seq input DNA-seq libraries were generated by PCR enrichment of the plasmid library (n = 12). b The whole-genome STARR-seq plasmid library was transfected into 500 cm2 plates of A549 cells (n = 25). Plates were treated with 100 nM dex or vehicle for a specified amount of time. Total RNA was harvested from five replicate plates for each time point. Following purification, each RNA sample was used to construct STARR-seq output libraries. c Following deep sequencing of the input and output libraries, we detected regions of STARR-seq activity with MACS, as is typical for ChIP-seq, to identify regions with significant coverage in each output library relative to the common input library. d All called regions from all replicate output libraries were combined to generate a union set of STARR-seq regions. Per-library read counts in regions in the union set were generated with featureCounts. Differential enrichment analysis for each time point relative to 0 h of dex exposure was performed on the union regions set with edgeR prior to downstream analyses
Fig. 2
Fig. 2
Genome-wide high-throughput reporter assays measure environmentally responsive regulatory element activity. a Cumulative distribution of coverage for the whole-genome STARR-seq library. The median per base coverage is 59× (dashed line). b The number of regulatory regions identified by STARR-seq in each replicate increased with longer dex exposure (one way ANOVA followed by Tukey’s multiple comparison test; *P < 0.05, **P < 0.01). c The number of called DREs (FDR <5%). d Distribution of regulatory responses to dex. The fold change in reporter activity for all regulatory regions is plotted as a function of the mean sequencing coverage at that region. Significant responses are colored by time point. e Induced (dashed boxes) and steady-state (solid box) regulatory regions detected by whole-genome reporter assays correspond to epigenomic features identified by complimentary genomic assays at the dex-induced IP6K3 locus. STARR-seq input library coverage is displayed in the top track. ATAC-seq, DNase-seq, and ChIP-seq data after 4 h of dex treatment. f IP6K3 RNA-seq was measured in transcripts per milion (TPM). g GC-responsive gene induction is greater in TADs containing induced DREs compared to TADs containing non-responsive regulatory elements. The distribution of mean fold changes for all differentially induced genes in the same TAD is plotted for all TADs containing an induced DRE or non-responsive regulatory element in DHS. Median fold changes were compared with the Mann–Whitney U test. h Chromatin accessibility tracks for the 5 kb window centered on the upstream TF-bound induced DRE displayed in e (gray box). i Aggregate profile plots of the mean fold changes in post-dex ChIP-seq signal across 10 kb windows centered on DHS+ regulatory element midpoints. Induced (n = 1646) and repressed (n = 746) DREs are shown in red and blue, respectively. Non-responsive regulatory regions (n = 6531) are displayed in gray and control regions (n = 1646) are shown in pale blue. Control regions are randomly selected 520 bp (median STARR-seq regions length) regions filtered to matched to DHS+ induced DRE accessibility. j Heatmaps showing the average GR ChIP-seq signal in 10 kb windows centered on all dynamic DRE midpoints. Rows are grouped according to the time point for which the DRE was first called significant
Fig. 3
Fig. 3
Dex-responsive regulatory elements are enriched for TF-binding motifs. Dynamic DREs identified after 8 h of dex treatment were binned according to their fold change in reporter activity relative to steady state. Enriched motifs were identified for each quartile and then hierarchically clustered. Bonferroni-corrected log10 P values are displayed for all significant enrichments
Fig. 4
Fig. 4
Genome reporter assays detect drug-responsive allele-specific regulatory activity. a Manhattan plot of genome-wide significance values for the 10,669 heterozygous SNPs overlapping a regulatory element identified in this study. b Replicate read counts at rs10505411 and rs7206321 alleles. c Rs10505411 (dashed line) is associated with active epigenomic features in A549 cells. STARR-seq was measured in RPKM and ChIP-seq was measured in input-subtracted RPKM. d TF binding at the rs10505411 reference allele is greater than that at the alternate allele following dex treatment. Total pre-dex read counts for each factor were two or less. Wilcoxon's signed-rank test, *P < 0.05, **P < 0.001

References

    1. Heintzman ND, et al. Distinct and predictive chromatin signatures of transcriptional promoters and enhancers in the human genome. Nat. Genet. 2007;39:311–318. doi: 10.1038/ng1966. - DOI - PubMed
    1. Johnson DS, Mortazavi A, Myers RM, Wold B. Genome-wide mapping of in vivo protein–DNA interactions. Science. 2007;316:1497–1502. doi: 10.1126/science.1141319. - DOI - PubMed
    1. Boyle AP, et al. High-resolution mapping and characterization of open chromatin across the genome. Cell. 2008;132:311–322. doi: 10.1016/j.cell.2007.12.014. - DOI - PMC - PubMed
    1. Buenrostro JD, Wu B, Chang HY, Greenleaf WJ. ATAC-seq: a method for assaying chromatin accessibility genome-wide. Curr. Protoc. Mol. Biol. 2015;109:21 29 21–21 29 29. - PMC - PubMed
    1. Biddie SC, et al. Transcription factor AP1 potentiates chromatin accessibility and glucocorticoid receptor binding. Mol. Cell. 2011;43:145–155. doi: 10.1016/j.molcel.2011.06.016. - DOI - PMC - PubMed

Publication types

MeSH terms

Substances