. 2018 Dec 21;9(1):5456.
doi: 10.1038/s41467-018-07847-x.

Synthetic mammalian pattern formation driven by differential diffusivity of Nodal and Lefty

Affiliations

Synthetic mammalian pattern formation driven by differential diffusivity of Nodal and Lefty

Ryoji Sekine et al. Nat Commun. .

Abstract

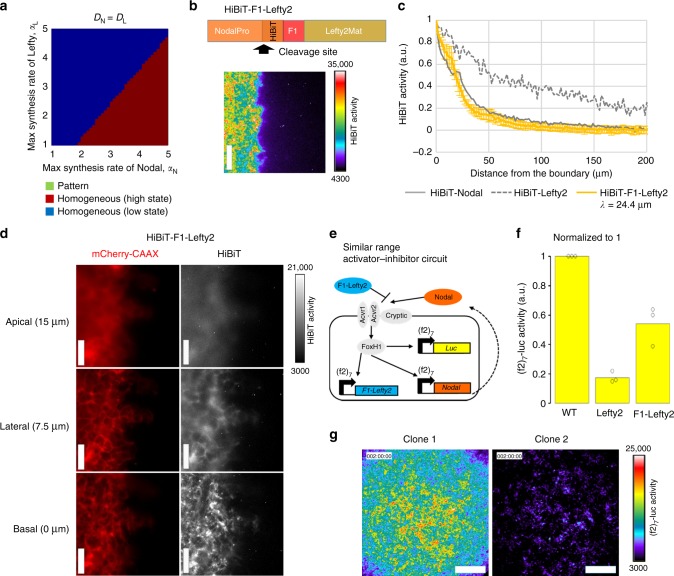
A synthetic mammalian reaction-diffusion pattern has yet to be created, and Nodal-Lefty signaling has been proposed to meet conditions for pattern formation: Nodal is a short-range activator whereas Lefty is a long-range inhibitor. However, this pattern forming possibility has never been directly tested, and the underlying mechanisms of differential diffusivity of Nodal and Lefty remain unclear. Here, through a combination of synthetic and theoretical approaches, we show that a reconstituted Nodal-Lefty network in mammalian cells spontaneously gives rise to a pattern. Surprisingly, extracellular Nodal is confined underneath the cells, resulting in a narrow distribution compared with Lefty. The short-range distribution requires the finger 1 domain of Nodal, and transplantation of the finger 1 domain into Lefty shortens the distribution of Lefty, successfully preventing pattern formation. These results indicate that the differences in localization and domain structures between Nodal and Lefty, combined with the activator-inhibitor topology, are sufficient for reaction-diffusion patterning.


Conflict of interest statement

The authors declare no competing interests.

Figures

Fig. 1
Fig. 1
Cells with an activator–inhibitor circuit spontaneously give rise to a pattern. a The activator circuit. b Time-lapse imaging of the HEK293 cells engineered with the activator circuit. See also Supplementary Movie 1. c The bright field and luciferase images of the cells with the activator circuit at 48 h. d The activator–inhibitor circuit. e Time-lapse imaging of the HEK293 cells engineered with the activator-inhibitor circuit. See also Supplementary Movie 1. f The bright field and luciferase images of the cells with the activator–inhibitor circuit at 48 h. g Repeated experiments of f. h The luciferase image of an activator-inhibitor cell line at 48 h that was re-cloned from the cells shown in f. i The width of positive domains was measured at each time point as described in Supplementary Fig. 3. j The structural similarity (SSIM) index between two images at time t and t + 6 h was calculated as described in Supplementary Fig. 3. A higher index means a more stable pattern. The gray dot at 48 h indicates the SSIM index of a control static sample, where the cells that constitutively express luciferase were mixed with wild-type cells. Scale bars: 400 μm (b, c, eh). Source data are provided as a Source Data file (i, j)
Fig. 2
Fig. 2
The distribution range of Nodal is shorter than that of Lefty. a Culture insert assay. Ligand-producing cells (labeled with mCherry-CAAX) and receptor cells (wild-type cells) are cultured separately in a culture insert. After removal of the culture insert, the two cell types fill the cell-free gap, establishing a straight boundary. b HiBiT system to visualize the extracellular distribution of ligands. The small tag, HiBiT, is fused to the ligand, whereas the LgBiT and substrate are added to the medium. The HiBiT and LgBiT reconstitute NanoLuc only outside the cells. c Top: the HiBiT tag was inserted into the N-terminus of the Nodal mature domain. Bottom left: the boundary of the HiBiT-Nodal-producing cells (ligand cells, labeled with mCherry-CAAX) and receptor cells. The mCherry-CAAX image was merged with the bright field image. Bottom right: HiBiT-mediated luminescence image showing the extracellular distribution of HiBiT-Nodal. d Top: the HiBiT tag was inserted into the N-terminus of the Lefty2 mature domain. Bottom left: the boundary of the HiBiT-Lefty2-producing cells and receptor cells. Bottom right: the extracellular distribution of HiBiT-Lefty2. e Quantified distribution profiles of HiBiT-Nodal and HiBiT-Lefty2. Each distribution was fitted to exp(-x/λ) to estimate the characteristic distance λ. f Top: a signal sequence (ss) and the HiBiT tag were fused to the N-terminus of the Nodal mature domain. Bottom: the extracellular distribution of ss-HiBiT-NodalMat. g Top: the HiBiT tag was fused to the C-terminus of the Nodal prodomain. Bottom: the extracellular distribution of HiBiT-NodalPro. h Quantified distribution profiles of ss-HiBiT-NodalMat and HiBiT-NodalPro. The HiBiT-Nodal distribution shown in e is displayed as a control. i The Nodal mature domain consists of three subdomains: the finger 1 (F1), heel (H) and finger 2 (F2). j Left: the finger 1 domain was deleted from ss-HiBiT-NodalMat. Right: the extracellular distribution of ss-HiBiT-NodalΔF1. k Quantified distribution profiles of ss-HiBiT-NodalΔF1. The distributions of HiBiT-Nodal and HiBiT-Lefty2 shown in e are displayed as a control. l, m Higher magnification view of HiBiT-Nodal (l) and HiBiT-Lefty2 (m). The mCherry-CAAX images were normalized differently between l and m. Data are means and s.e.m. (n = 3) (e, h, k). Scale bars: 200 μm (c, d, f, g, j); 50 μm (l, m). Source data are provided as a Source Data file (e, h, k)
Fig. 3
Fig. 3
Mathematical models of the activator-inhibitor circuit. ad The competitive inhibition model. a A scheme of competitive inhibition. b The parameter region for pattern formation (green). The competitive inhibition model was simulated in one dimension. See also Methods. The parameter combination used in d is indicated by the character d. c The parameter region that meets the Turing instability condition (green). d Two-dimensional simulation with (αN, αL) = (0.8, 4.0). A typical Turing pattern was formed with this model and parameter set. ej The competitive inhibition + direct inhibition model. e A scheme of competitive inhibition and direct inhibition. f The parameter region for pattern formation (green). The competitive inhibition + direct inhibition model was simulated in one dimension. The parameter combinations used in hj are indicated in the inset. g The Turing instability condition was not satisfied in the entire parameter regions tested. hj Two-dimensional simulation with different combinations of the parameters αN and αL. Solitary patterns, not Turing patterns, were formed with this model and parameter range. k To increase αL, a construct containing (f2)7-Lefty2 and PGK-mCherry was added to the parental activator–inhibitor circuit shown in Fig. 1d. l To increase αN, a construct containing (f2)7-Nodal and PGK-GFP was added to the parental activator–inhibitor circuit. m FACS plots confirming the introduction of the additional constructs. The mCherry signal indicates extra copies of (f2)7-Lefty2 (αL increase), and the GFP signal indicates extra copies of (f2)7-Nodal (αN increase). n Patterns resulting from the activator–inhibitor circuit with the increased αL or αN. The pattern of the parental activator-inhibitor cells shown in Fig. 1f is displayed as a control. Scale bars: 400 μm
Fig. 4
Fig. 4
Different diffusivity of Nodal and Lefty is crucial for the pattern formation. a The parameter region for pattern formation does not exist with the same diffusion coefficients for Nodal and Lefty (DN = DL = 1.96 μm2 min−1). The competitive inhibition + direct inhibition model was simulated in one dimension. b Top: the finger 1 domain of Nodal was fused to Lefty2. Bottom: the culture insert assay showing the extracellular distribution of HiBiT-F1-Lefty2. c Quantified distribution profile of HiBiT-F1-Lefty2. The distributions of HiBiT-Nodal and HiBiT-Lefty2 shown in Fig. 2e are displayed as a control. Data are means and s.e.m. (n = 3). d Higher magnification view of HiBiT-F1-Lefty2. e The similar range activator-inhibitor circuit. F1-Lefty2 was used instead of Lefty2 in the activator-inhibitor circuit to make the diffusion coefficients of Nodal and Lefty similar. f Inhibitory activity of F1-Lefty2. Wild-type cells, Lefty2-producing cells or F1-Lefty2-producing cells were co-cultured with the cells engineered with the activator circuit, and the (f2)7-luc activities were measured. Data are means and individual points (n = 3). g The image of two representative clones of the cells engineered with the similar range activator–inhibitor circuit at 48 h. Scale bars: 200 μm (b); 50 μm (d); 400 μm (g). Source data are provided as a Source Data file (c, f)

References

    1. Elowitz M, Lim WA. Build life to understand it. Nature. 2010;468:889–890. doi: 10.1038/468889a. - DOI - PMC - PubMed
    1. Matsuda, M., Koga, M., Woltjen, K., Nishida, E. & Ebisuya, M. Synthetic lateral inhibition governs cell-type bifurcation with robust ratios. Nat. Commun. 6, 10.1038/ncomms7195 (2015). - PubMed
    1. Davies J. Using synthetic biology to explore principles of development. Development. 2017;144:1146–1158. doi: 10.1242/dev.144196. - DOI - PubMed
    1. Solé R, Ollé-Vila A, Vidiella B, Duran-Nebreda S, Conde-Pueyo N. The road to synthetic multicellularity. Curr. Opin. Syst. Biol. 2018;7:60–67. doi: 10.1016/j.coisb.2017.11.007. - DOI
    1. Teague, B. P., Guye, P. & Weiss, R. Synthetic Morphogenesis. CSH Perspect. Biol. 8, 10.1101/cshperspect.a023929 (2016). - PMC - PubMed

Publication types