. 2018 Dec 21;9(1):5450.
doi: 10.1038/s41467-018-07824-4.

Identification of ADAR1 adenosine deaminase dependency in a subset of cancer cells

Affiliations

Identification of ADAR1 adenosine deaminase dependency in a subset of cancer cells

Hugh S Gannon et al. Nat Commun. .

Erratum in

Abstract

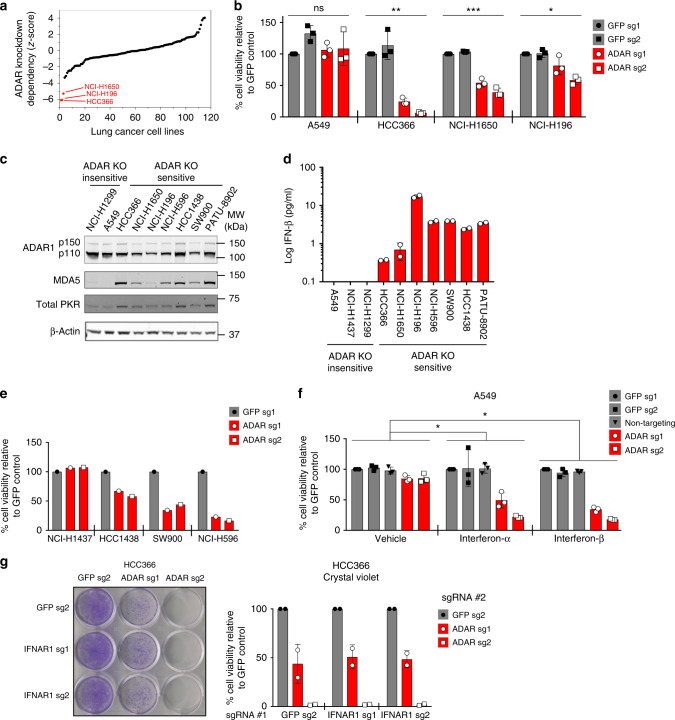
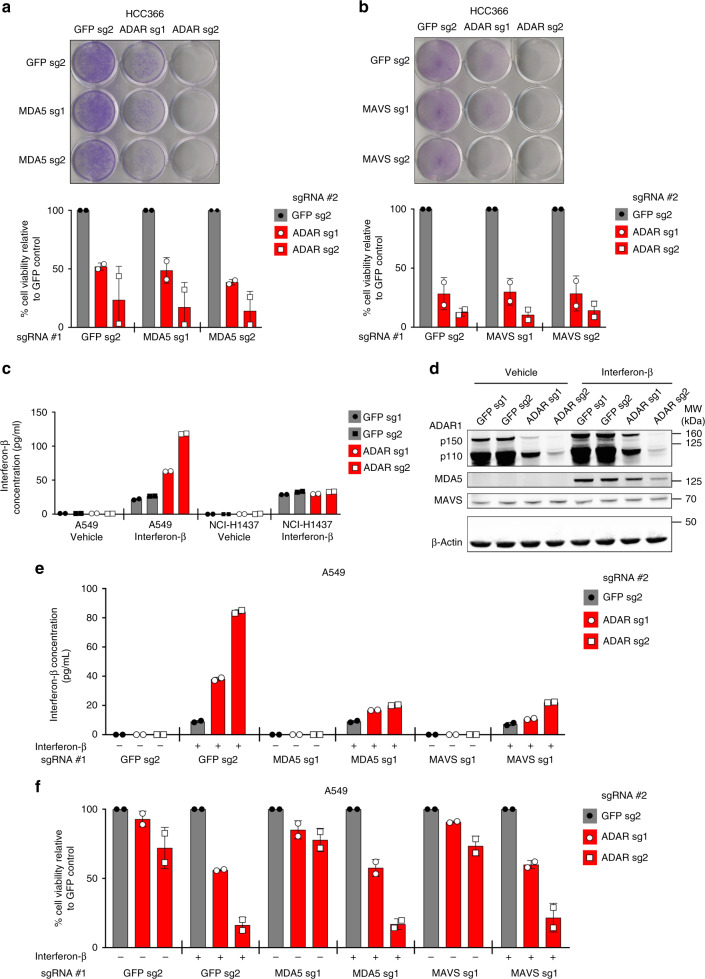
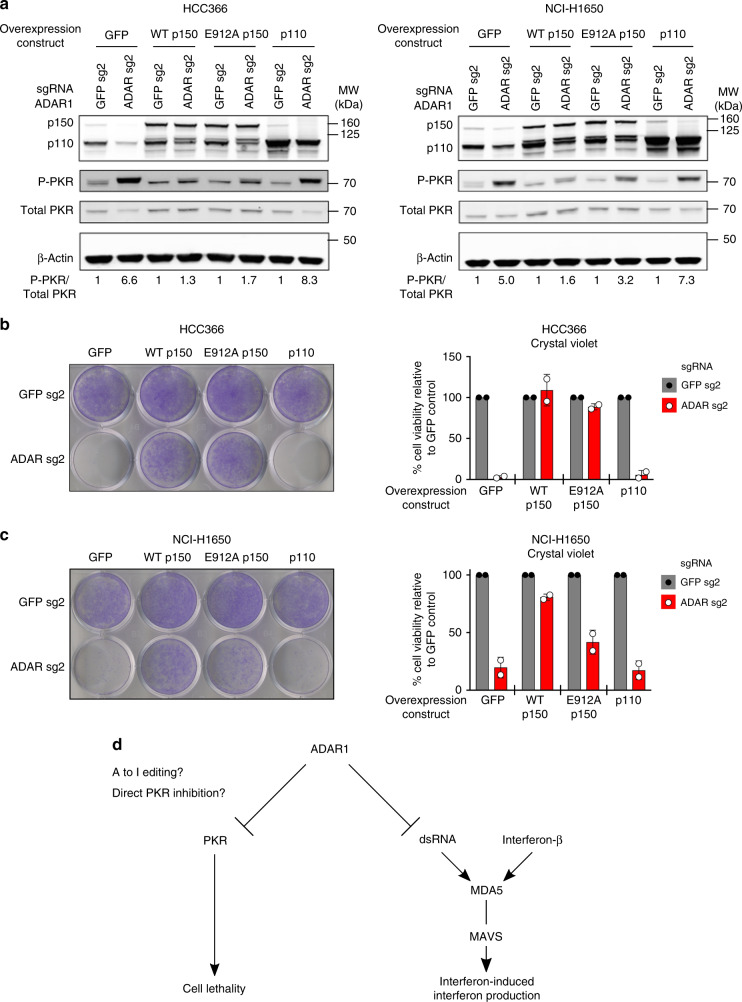
Systematic exploration of cancer cell vulnerabilities can inform the development of novel cancer therapeutics. Here, through analysis of genome-scale loss-of-function datasets, we identify adenosine deaminase acting on RNA (ADAR or ADAR1) as an essential gene for the survival of a subset of cancer cell lines. ADAR1-dependent cell lines display increased expression of interferon-stimulated genes. Activation of type I interferon signaling in the context of ADAR1 deficiency can induce cell lethality in non-ADAR1-dependent cell lines. ADAR deletion causes activation of the double-stranded RNA sensor, protein kinase R (PKR). Disruption of PKR signaling, through inactivation of PKR or overexpression of either a wildtype or catalytically inactive mutant version of the p150 isoform of ADAR1, partially rescues cell lethality after ADAR1 loss, suggesting that both catalytic and non-enzymatic functions of ADAR1 may contribute to preventing PKR-mediated cell lethality. Together, these data nominate ADAR1 as a potential therapeutic target in a subset of cancers.


Conflict of interest statement

H.S.G. is now an employee of KSQ Therapeutics, Inc. in Cambridge, MA. W.C.H. is a founder of and consultant for KSQ Therapeutics, Inc. in Cambridge, MA. M.M. receives research funding from Bayer; had equity interest in Foundation Medicine (former, partially sold to Roche); had a consulting or advisory role with Foundation Medicine (former) and OrigiMed; and received patent royalties on intellectual property from Dana-Farber Cancer Institute licensed to LabCorp. M.M. and H.S.G. are inventors on a patent application for the use of ADAR1 inhibitors in cancer treatment. The remaining authors declare no competing interests.

Figures

Fig. 1
Fig. 1
High expression of ISGs in cancer cell lines is predictive of sensitivity to ADAR deletion. aZ-scores representing the degree of cell lethality after ADAR knockdown in lung cancer cell lines included in published genome-scale loss-of-function screens. Z-scores represent the number of standard deviations from the mean for each data point. b Cell viability was assessed by ATP bioluminescence 11 days after GFP or ADAR KO with CRISPR-Cas9. ATP bioluminescence values were normalized to the GFP sg1 control within each cell line. Three independent biological replicates were performed for each cell line. *p = 0.0054, **p = 0.0008, and ***p < 0.0001 as calculated by the Kruskal–Wallis test. c Immunoblots showing protein levels of ISGs and β-actin (loading control) in ADAR KO-sensitive and KO-insensitive cancer cell lines (n = 3). d Spontaneous IFN-β secretion by ADAR KO-sensitive and KO-insensitive cancer cell lines as measured by ELISA 24 h after replacement of culture media. Technical replicates from one representative experiment are shown (n = 2). e Cell viability was assessed by ATP bioluminescence 11 days after GFP or ADAR KO with CRISPR-Cas9 in additional lung cancer cell lines. ATP bioluminescence values were normalized to the GFP sg1 control within each cell line (n = 1). f Cell viability of control or ADAR1-deficient A549 cells was assessed by ATP bioluminescence 3 days after vehicle or IFN-I treatment (10 ng/mL). ATP bioluminescence values were normalized to the GFP sg1 control within each treatment group. Three independent biological replicates were performed. Two-way ANOVA showed a significant interaction between ADAR KO and IFN-I treatment (*p < 0.0001, degrees of freedom = 8, F-ratio = 10.51). Dunnett’s multiple comparisons post-test showed a significant difference between vehicle and IFN-I treatment groups and between control and ADAR KO groups (*p < 0.0001). g Cell viability of control or IFNAR1-deficient HCC366 cells was assessed by crystal violet staining 11–13 days after GFP or ADAR KO with CRISPR-Cas9. A representative image of crystal violet staining (left) and quantitation of cell viability (right) from two independent biological replicates are shown. Cell viability values were normalized to the GFP sg2 control #2 within each group of isogenic cells. Error bars represent standard deviation in all graphs
Fig. 2
Fig. 2
MDA5 and MAVS are required for IFN-induced IFN-β production, but not cell lethality, after ADAR deletion. a, b Cell viability of control and MDA5-deficient (a) or MAVS-deficient (b) HCC366 cells was assessed by crystal violet staining 8–13 days after GFP or ADAR KO with CRISPR-Cas9. A representative image of crystal violet staining (top) and quantitation of cell viability (bottom) from two independent biological replicates (for both a and b) are shown. Cell viability values were normalized to the GFP sg2 control #2 within each group of isogenic cell lines. c IFN-β secretion by control or ADAR1-deficient A549 cells was measured by ELISA after treatment with either vehicle or IFN-β (10 ng/mL) for 24 h. NCI-H1437 cells harbor a homozygous deletion of the IFNB1 locus. Technical replicates from one representative experiment are shown. Three independent biological replicates were performed for A549 cells and one experiment was performed for NCI-H1437 cells. d Immunoblots showing MDA5 and MAVS protein levels in control (GFP sgRNAs) and ADAR1-deficient A549 cells 24 h after treatment with vehicle or IFN-β (10 ng/mL). β-Actin served as a loading control. One representative immunoblot from two independent biological replicates is shown. e IFN-β secretion by the indicated A549 cells was measured by ELISA after treatment with vehicle or IFN-β (10 ng/mL). Technical replicates from one representative experiment out of two independent biological replicates are shown. f Cell viability of the indicated A549 cells from e was assessed by cell counting 2 days after treatment with vehicle or IFN-β (10 ng/mL). Cell viability values were normalized to the GFP sg2 control #2 within each group of vehicle or IFN-β-treated isogenic cell lines. Two independent biological replicates are shown. Error bars represent standard deviation in all graphs
Fig. 3
Fig. 3
Cell lethality after ADAR deletion is partially mediated through activation of PKR signaling. a Analysis of differentially expressed genes between ADAR KO-sensitive and KO-insensitive cancer cell lines using gene expression data from CCLE. Differentially expressed genes are plotted by −log(q-value) on the y-axis versus log2(fold change) on the x-axis. b Immunoblots showing phosphorylated (Thr-446) and total PKR protein levels 5 days after ADAR deletion by CRISPR-Cas9 for the indicated cell lines (n = 5). β-Actin served as a loading control. c Heat maps showing standardized t-statistics of normalized expression values for the indicated genes (rows) after deletion of GFP (control) or ADAR (columns) in the indicated cancer cell lines (n = 1). Color scales show relative normalized expression between ADAR and GFP KO samples. d Cell viability of control or PKR-deficient HCC366 cells was assessed by crystal violet staining 8 days after GFP or ADAR KO with CRISPR-Cas9. A representative image of crystal violet staining (left) and quantitation of cell viability (right) from two independent biological replicates are shown. Cell viability values were normalized to the GFP sg2 control #2 within each group of isogenic cell lines. e Cell viability of control, PKR-deficient, ADAR1-deficient, or ADAR1/PKR double-deficient A549 cells was assessed by ATP bioluminescence 3 days after treatment with vehicle or IFN-β (10 ng/mL). ATP bioluminescence values were normalized to the vehicle-treated control within each isogenic cell line. Data from two biological replicates are shown. Note: ADAR sg2 was used in this experiment. Error bars represent standard deviation in all graphs
Fig. 4
Fig. 4
Both non-enzymatic and catalytic functions of ADAR1-p150 may be important to prevent cell lethality in cancer cell lines. a GFP control, WT ADAR1-p150, E912A ADAR1-p150, or WT ADAR1-p110 proteins were overexpressed in HCC366 (right) or NCI-H1650 cells (left) prior to transduction with lentivirus that co-expressed Cas9 and sgRNAs targeting GFP or ADAR. Protein lysates were collected 6 days after GFP or ADAR KO and were probed with antibodies against ADAR1, phospho-PKR, total PKR, and β-Actin (loading control) in HCC366 (left) or NCI-H1650 cells (right). The fold change in the phospho-PKR to total PKR ratio (P-PKR/Total PKR) relative to the corresponding GFP sgRNA control is shown in each lane (n = 2). b Cell viability of GFP control or ADAR1-overexpressing HCC366 cells was assessed by crystal violet staining 11–13 days after GFP or ADAR KO (using ADAR sg2) with CRISPR-Cas9. A representative image of crystal violet staining (left) and quantitation of cell viability (right) from two independent biological replicates are shown. Cell viability values were normalized to the GFP sg2 control within each pair of isogenic cell lines. c Cell viability of GFP-overexpressing (control) or ADAR1-overexpressing NCI-H1650 cells was assessed by crystal violet staining 13–16 days after GFP or ADAR KO (using ADAR sg2) with CRISPR-Cas9. A representative image of crystal violet staining (left) and quantitation of cell viability (right) from two independent biological replicates are shown. Cell viability values were normalized to the GFP sg2 control within each pair of isogenic cell lines. d Model of the pathways that mediate cell lethality and interferon-induced interferon production after ADAR deletion in cancer cell lines. Error bars represent standard deviation in all graphs

References

    1. Paez JG, et al. EGFR mutations in lung cancer: correlation with clinical response to gefitinib therapy. Science. 2004;304:1497–1500. doi: 10.1126/science.1099314. - DOI - PubMed
    1. Kwak EL, et al. Anaplastic lymphoma kinase inhibition in non-small-cell lung cancer. N. Engl. J. Med. 2010;363:1693–1703. doi: 10.1056/NEJMoa1006448. - DOI - PMC - PubMed
    1. Topalian SL, et al. Safety, activity, and immune correlates of anti-PD-1 antibody in cancer. N. Engl. J. Med. 2012;366:2443–2454. doi: 10.1056/NEJMoa1200690. - DOI - PMC - PubMed
    1. Reck M, et al. Pembrolizumab versus chemotherapy for PD-L1-positive non-small-cell lung cancer. N. Engl. J. Med. 2016;375:1823–1833. doi: 10.1056/NEJMoa1606774. - DOI - PubMed
    1. Paz-Ares, L. et al. Pembrolizumab plus chemotherapy for squamous non-small-cell lung cancer. N. Engl. J. Med.10.1056/NEJMoa1810865 (2018). - PubMed

Publication types