. 2018 Dec 21;9(1):5435.
doi: 10.1038/s41467-018-07825-3.

Impaired immune surveillance accelerates accumulation of senescent cells and aging

Affiliations

Impaired immune surveillance accelerates accumulation of senescent cells and aging

Yossi Ovadya et al. Nat Commun. .

Abstract

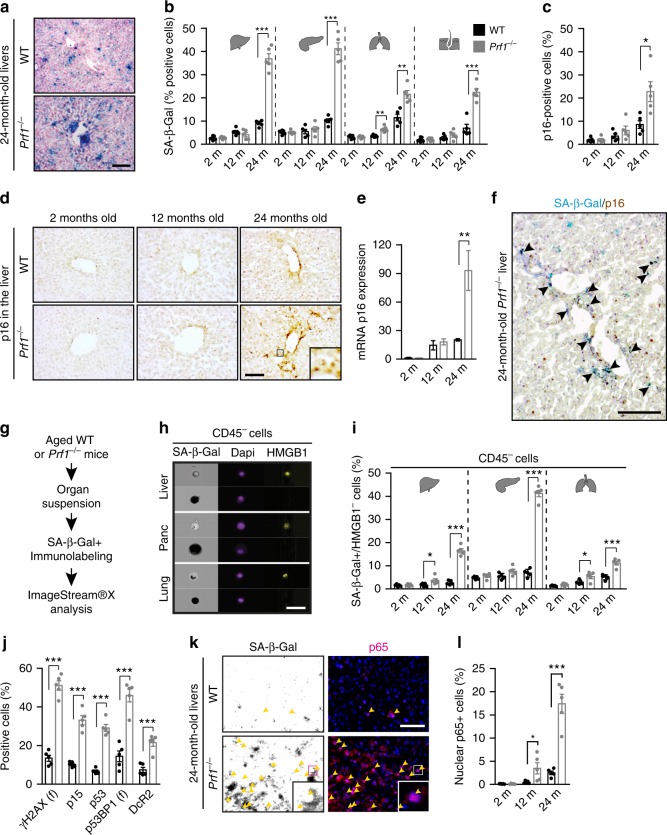
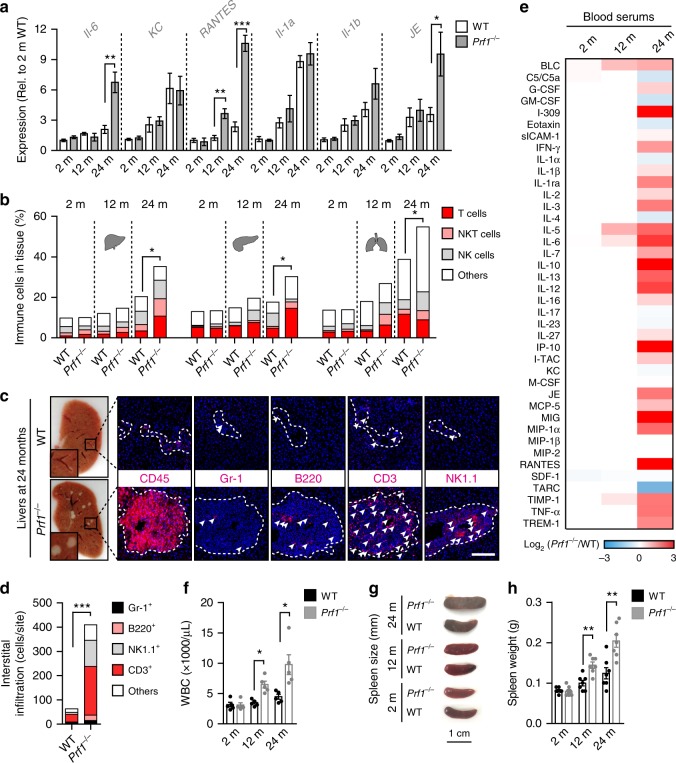
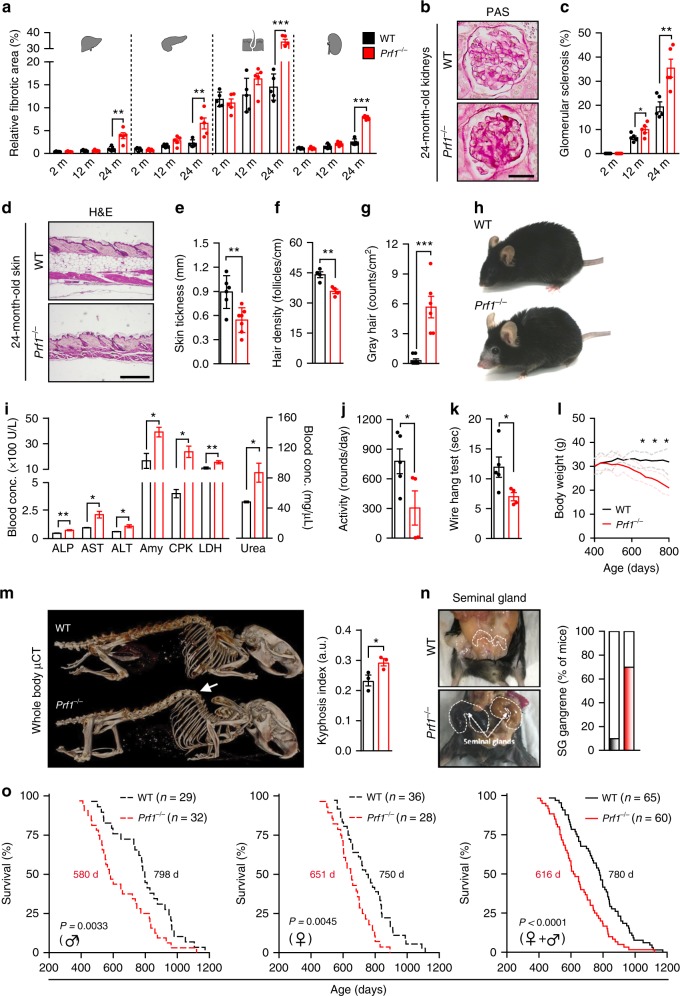
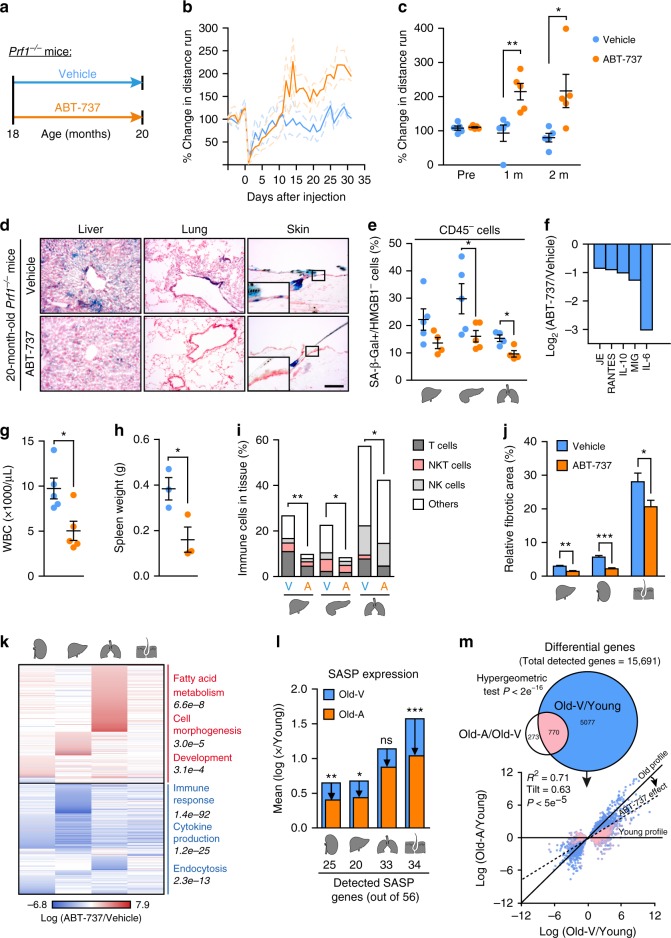
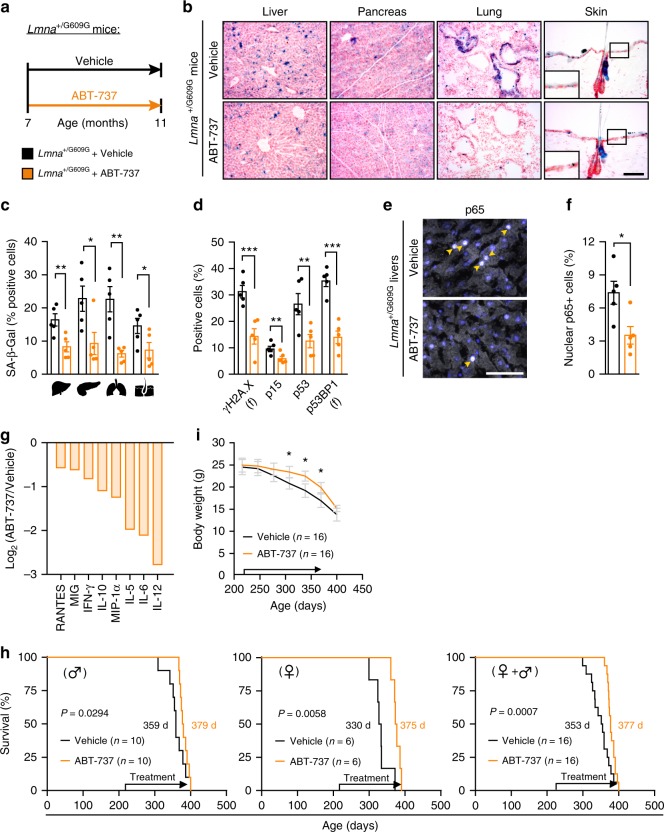
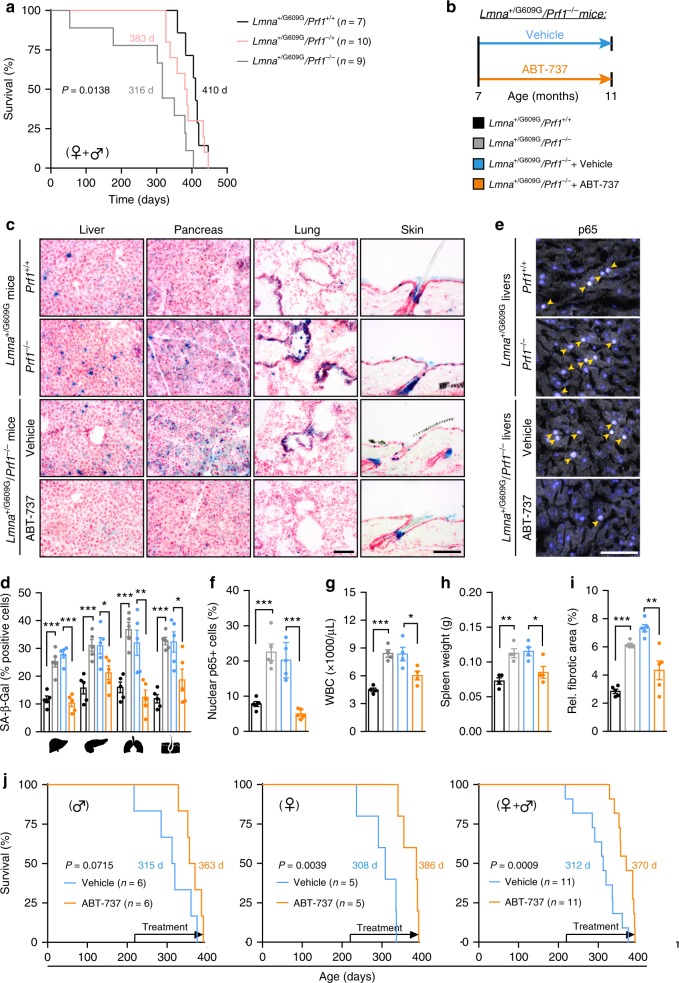
Cellular senescence is a stress response that imposes stable cell-cycle arrest in damaged cells, preventing their propagation in tissues. However, senescent cells accumulate in tissues in advanced age, where they might promote tissue degeneration and malignant transformation. The extent of immune-system involvement in regulating age-related accumulation of senescent cells, and its consequences, are unknown. Here we show that Prf1-/- mice with impaired cell cytotoxicity exhibit both higher senescent-cell tissue burden and chronic inflammation. They suffer from multiple age-related disorders and lower survival. Strikingly, pharmacological elimination of senescent-cells by ABT-737 partially alleviates accelerated aging phenotype in these mice. In LMNA+/G609G progeroid mice, impaired cell cytotoxicity further promotes senescent-cell accumulation and shortens lifespan. ABT-737 administration during the second half of life of these progeroid mice abrogates senescence signature and increases median survival. Our findings shed new light on mechanisms governing senescent-cell presence in aging, and could motivate new strategies for regenerative medicine.


Conflict of interest statement

The authors declare no competing interests.

Figures

Fig. 1
Fig. 1
Old Prf1−/− mice accumulate more senescent cells then old WT mice. Cohorts of Prf1−/− and wild type (WT) C57BL/6 female mice at the age of 2, 12, and 24 months were sacrificed and their livers, pancreas, lungs, and skin were examined for the presence of senescent cells. a SA-β-Gal activity representative frozen sections of livers from 24-months-old mice. Scale bar, 100 µm. b Quantification of cells with marked SA-β-Gal activity, based on Nuclear Fast Red counterstaining, in liver, pancreas, bronchial epithelia, and skin epidermis. (n = 5 mice per group). c Percentages of cells stained positively for p16 in the liver. Values are means ± SEM, (n = 5 mice per group). d Representative images of IHC staining for p16 on liver frozen section. Scale bar, 100 µm. e Real-time qPCR analysis for expression of p16 in livers. Values are means ± SEM, (n = 5 mice per group). f Representative image of SA-β-Gal activity combined with IHC staining for p16 on liver frozen section from 24 old Prf1−/− mice. Scale bar, 100 µm. g Scheme of examination of senescence by ImageStreamX. h Representative ImageStreamX images of CD45 negative cells derived from indicated organs that were stained for HMGB1 and SA-β-Gal. Scale bar, 50 µm. i Quantification of CD45/SA-β-Gal + /HMGB1 population in each organ, as analyzed in (h). (n = 5 mice per group). j Percentages of cells stained positively for γH2AX, p15, p53, p53BP1, and DcR2 in livers from old mice. (n = 5 mice per group). k Immunofluorescence staining for p65 (pink) in SA-β-Gal + cells (indicated by arrows in black/white photos) in livers from old mice. Scale bar, 50 µm. l Percentages of nuclei positive for p65 in livers. For all graphs, values are means ± SEM, (n = 5 mice per group). Student’s t-test was used for all comparisons between Prf1−/ and WT female mice (*P < 0.05, **P < 0.01, ***P < 0.001)
Fig. 2
Fig. 2
Prf1−/− mice develop chronic systemic and local inflammation. a Real-time qPCR analysis for expression of p16 and SASP components in livers from 2, 12, and 24-months-old Prf1−/− and WT female mice. (n = 5 mice per group). b Flow-cytometric quantification of total immune cells (CD45+), T cells (CD45+/CD3+/NK1.1), NKT cells (CD45+/CD3+/NK1.1+), and NK cells (CD45+/CD3-/NK1.1+) in livers, pancreas, and lungs of 2, 12, and 24-months-old Prf1−/− and WT mice. (n 5 mice per group). c Immune foci observed (indicated in squares, left panel) in liver cryosections from old Prf1−/− and WT mice. The immune foci were analyzed on sections stained immunofluorescently for CD45, Gr-1, B220, CD3, and NK1.1. Scale bar, 100 µm. d Numbers of the different immune subsets in livers from old Prf1−/− mice and WT mice, based on the immunofluorescence staining presented in (c). e Array of serum cytokine levels in 2, 12, and 24-months-old Prf1−/− female mice relative to WT female mice at the corresponding age. Colors represent increase (red) or decrease (blue) in the average intensity of 3 pooled samples. Values are shown in log2 according to the legend panel. f White blood cell counts of 2, 12, and 24-months-old Prf1−/− and WT female mice. (n = 5 mice per group). g Representative photos of spleens from 2, 12, and 24-months-old Prf1−/− and WT female mice. h Spleen weights of 2, 12, and 24-months-old Prf1−/− and WT female mice. (n = 7 mice per group). For all graphs, values are means ± SEM. Student’s t-test was used for all comparisons between Prf1−/− and WT mice. (*P < 0.05, **P < 0.01, ***P < 0.001)
Fig. 3
Fig. 3
Prf1−/− mice exhibit reduced fitness, higher rates of age-related disorders and a shorter lifespan. Cohorts of Prf1−/− and WT male mice were followed for survival and analyzed at the age of 2, 12, and 24 months. a Percentages of fibrotic areas in indicated tissues based on the Sirius red-staining in Supplementary Figure 4a. (n ≥ 5 mice per group). b PAS staining of glomeruli from kidneys of 24-months-old Prf1−/− and WT mice. Scale bar, 25 µm. c Percentages of sclerotic glomeruli, based on PAS-stained kidney sections. (n = 5 mice per group). d H&E-stained sections of lower-back skin. Scale bar, 200 µm. e Quantification of skin thickness of old mice. (n ≥ 6 mice per group). f Hair density on the lower back of old male mice. (n = 4 mice per group). g Numbers of gray-hair follicles per square centimeter of skin on the lower back of old mice. (n ≥ 6 mice per group). h Representative photos of the old mice with considerable differences in skin and in hair between the two genotypes. i Levels of common markers of damage in the sera of old mice. (n = 3 mice per group). j Average activity levels based on voluntary exercise of old mice. (n ≥ 4 mice per group). k Grip strength analysis based on a hang-wire test in old mice. Values indicate time that a mouse managed to hold on the wire. (n ≥ 4 mice per group). l Weight curves of Prf1−/− and WT male mice. Values are means, dashed lines represent ± SEM (n ≥ 20 mice per group). m µCT-3D images of old mice. The arrow indicates dorsal kyphosis. Kyphotic index, (n = 3 mice per group). n The prevalence of seminal gland (shown) gangrene in old Prf1−/− and WT male mice. o Kaplan–Meier curves for Prf1−/− and WT mice. Chi square Gehan–Breslow-Wilcoxon test was used for statistical analysis. For all graphs, values are means ± SEM. Student’s t-test was used for all other comparisons between Prf1−/− mice and WT mice. (*P < 0.05, **P < 0.01, ***P < 0.001)
Fig. 4
Fig. 4
Treatment with ABT-737 counteract accelerated aging process of Prf1−/− male mice. a Starting from 18 months, ABT-737 or vehicle were administered to Prf1−/− mice at the beginning of each month, the mice were analyzed at the age of 20 months. b Change in distance run on a voluntary exercise test. Values are means and dashed lines represent ± SEM for each curve (n = 5 mice per group). c Average voluntary exercise levels during the last 3 days of the two months (n = 5 mice per group). d SA-β-Gal activity in indicated organs. Scale bar, 100 µm. (n = 5 mice per group). e CD45/SA-β-Gal + /HMGB1 population in indicated organs (n ≥ 4 mice per group). f Relative cytokine levels in the serum for top five altered cytokines. Bars represent average intensity of 3 pooled samples. g WBC counts. (n = 5 mice per group). h Spleen weights. (n = 3 mice per group). i Flow-cytometry quantification of total immune cells (CD45+), T cells (CD45+/CD3+/NK1.1-), NKT cells (CD45+/CD3+/NK1.1+), and NK cells (CD45+/CD3-/NK1.1+) in indicated organs (n ≥ 4 mice per group). j Fibrotic areas in indicated organs based on the Sirius Red-stained sections in Supplementary Figure 6b. (n = 5 mice per group). Student’s t-test was used for all comparisons between Prf1−/− mice and WT mice. k Differentially expressed genes in indicated organs. Notable enriched GO terms are highlighted (n ≥ 3 mice per group). l SASP genes score, presented as expression mean log ratio of old ABT-737 and Vehicle treated over young Prf1−/− mice (Supplementary Figure 6c). The bottom panel depicts number of detected SASP genes. (n ≥ 3 mice per group). m Upper panel: Euler diagram of differentially expressed genes from all analyzed tissues. Lower panel: Log ratio of gene expression for 20-months-old ABT-737 (y axis) and Vehicle (x axis)-treated over young Prf1−/− mice. Dashed line represents linear regression fitted to the data; p value computed against the null hypothesis that tilt = 1; (n ≥ 3 mice per group). For all graphs, values are means ± SEM. Student’s t-test was used for all other comparisons. (*P < 0.05, **P < 0.01, ***P < 0.001)
Fig. 5
Fig. 5
Treatment with ABT-737 increases median lifespan of progeroid mice. Starting the age of 7 months ABT-737 or DMSO-based vehicle solution was administered to LMNA+/G609G mice. a Scheme of drug administration to LMNA+/G609G mice. b Representative images depicting SA-β-Gal activity in frozen sections of livers, pancreas, lungs, and skin from ABT-737-treated and vehicle-treated LMNA+/G609G female mice at the age of 11 months. Scale bar, 100 µm. c Percentage of cells with SA-β-Gal activity in liver, pancreas, lungs, and skin from ABT-737-treated and vehicle-treated LMNA+/G609G female mice. (n = 5 mice per group). d Percentages of cells stained positively for γH2AX, p15, p53, p53BP1, and DcR2 in ABT-737-treated and vehicle-treated LMNA+/G609G female mice at the age of 11 months. (n = 5 mice per group). e Representative images of immunofluorescence staining for p65 (arrows) in liver sections from ABT-737-treated and vehicle-treated LMNA+/G609G female mice at the age of 11 months. Scale bar, 50 µm. f Percentage of p65 + nuclei in livers from ABT-737-treated and vehicle-treated LMNA+/G609G female mice at the age of 11 months. (n = 5 mice per group). g Serum cytokine levels in ABT-737-treated LMNA+/G609G female mice relative to age-matched vehicle -treated LMNA+/G609G female mice. Bars represent the average intensity of 3 pooled samples (log2). Values are shown for cytokines that were decreased by more than 2-fold. h Kaplan–Meier survival curves of ABT-737-treated and vehicle-treated LMNA+/G609G mice. Data is shown for males (n = 10), females (n = 6), and both genders combined (n = 16). Chi square Gehan–Breslow–Wilcoxon Test was used for statistical analysis. i Weight curves of ABT-737-treated and vehicle-treated LMNA+/G609G mice. (n = 16 mice per group). For all graphs, values are means ± SEM. Student’s t-test was used for all comparisons between the two groups. (*P < 0.05, **P < 0.01, ***P < 0.001)
Fig. 6
Fig. 6
Treatment with ABT-737 increases median lifespan of progeroid mice with perforin deficiency. LMNA+/G609G/Prf1−/− mice, LMNA+/G609G/Prf1+/−, and LMNA+/G609G/Prf1+/+ mice from both genders underwent a survival test. a Kaplan–Meier curves of LMNA+/G609G/Prf1−/− mice, LMNA+/G609G/Prf1+/− mice and LMNA+/G609G/Prf1+/+ mice. Chi square Gehan–Breslow-Wilcoxon test was used for statistical analysis. Additional cohorts of LMNA+/G609G/Prf1+/+, LMNA+/G609G/Prf1−/−, ABT-737-treated and Vehicle-treated LMNA+/G609G/Prf1−/− female mice were raised. b Scheme of drug administration to LMNA+/G609G/Prf1−/− mice. Starting the age of 7 months ABT-737 or DMSO-based vehicle solution was administered to LMNA+/G609G/Prf1−/− female mice as described above. At the age of 11 months, mice from all groups were sacrificed and selected organs examined for the presence of senescent cells. c Representative images depicting SA-β-Gal activity in frozen sections of livers, pancreas, lungs, and skin from all groups of mice at the age of 11 months. Scale bar, 100 µm. d Percentage of SA-β-Gal + cells in livers, pancreas, lungs, and skin from all groups of mice. (n = 4 mice per group). e Representative images depicting immunofluorescence staining of p65 in livers from all mice groups. Scale bar, 100 µm. f Percentage of p65 + nuclei in livers from all groups. (n = 4 mice per group). g White blood cell counts of mice from all groups. (n = 4 mice per group). h Spleen weights of from all mice groups. (n = 4 mice per group). i Percentage of fibrotic area in livers paraffin-embedded sections of 11 month mice from all groups. (n = 4 mice per group). For all graphs, values are means ± SEM. Student’s t-test was used for all comparisons between mice groups. j Kaplan–Meier survival curves of ABT-737-treated and vehicle-treated LMNA+/G609G/Prf1−/− mice. Data is shown for males (n = 6), females (n = 5), and both genders combined (n = 11). Chi square Gehan–Breslow–Wilcoxon test was used for statistical analysis. (*P < 0.05, **P < 0.01, ***P < 0.001)

References

    1. Hoeijmakers JH. DNA damage, aging, and cancer. N. Engl. J. Med. 2009;361:1475–1485. doi: 10.1056/NEJMra0804615. - DOI - PubMed
    1. Campisi J. Aging, cellular senescence, and cancer. Annu. Rev. Physiol. 2013;75:685–705. doi: 10.1146/annurev-physiol-030212-183653. - DOI - PMC - PubMed
    1. Lopez-Otin C, Blasco MA, Partridge L, Serrano M, Kroemer G. The hallmarks of aging. Cell. 2013;153:1194–1217. doi: 10.1016/j.cell.2013.05.039. - DOI - PMC - PubMed
    1. van Deursen JM. The role of senescent cells in ageing. Nature. 2014;509:439–446. doi: 10.1038/nature13193. - DOI - PMC - PubMed
    1. Munoz-Espin D, Serrano M. Cellular senescence: from physiology to pathology. Nat. Rev. Mol. Cell Biol. 2014;15:482–496. doi: 10.1038/nrm3823. - DOI - PubMed

Publication types

MeSH terms