. 2018 Dec 21;9(1):5416.
doi: 10.1038/s41467-018-07901-8.

Optimized libraries for CRISPR-Cas9 genetic screens with multiple modalities

Affiliations

Optimized libraries for CRISPR-Cas9 genetic screens with multiple modalities

Kendall R Sanson et al. Nat Commun. .

Abstract

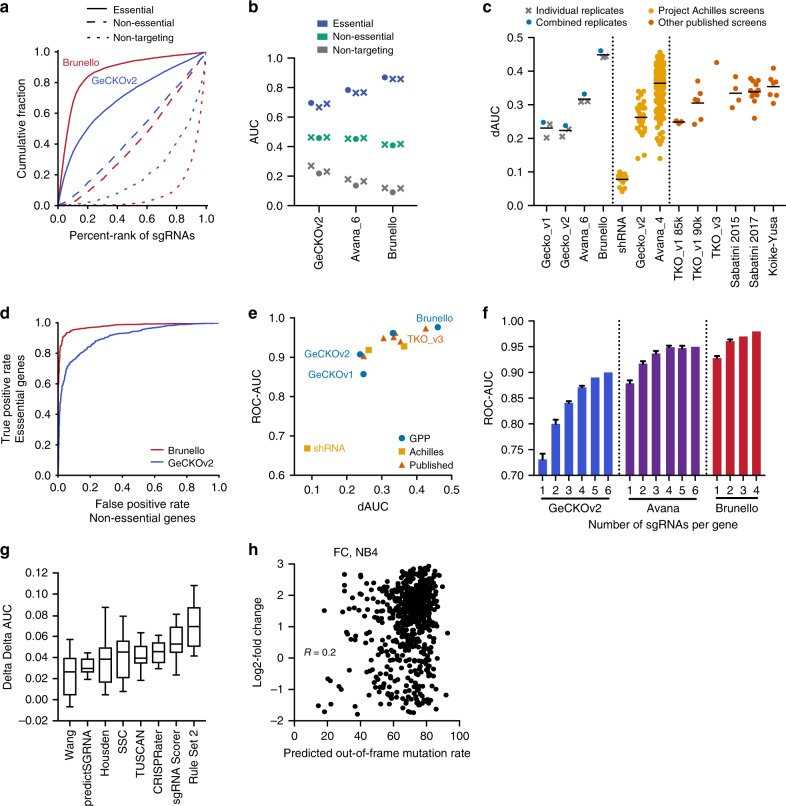
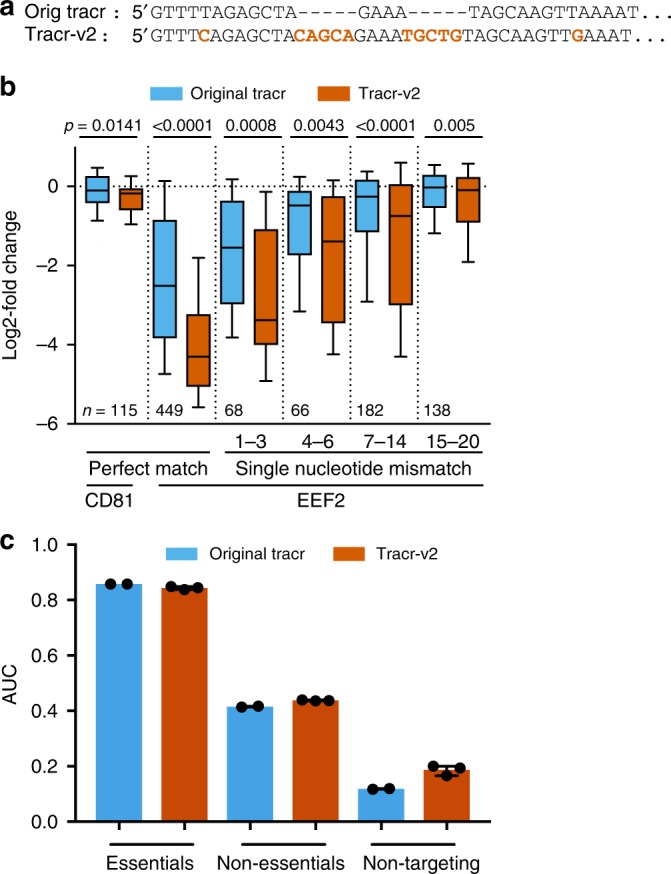
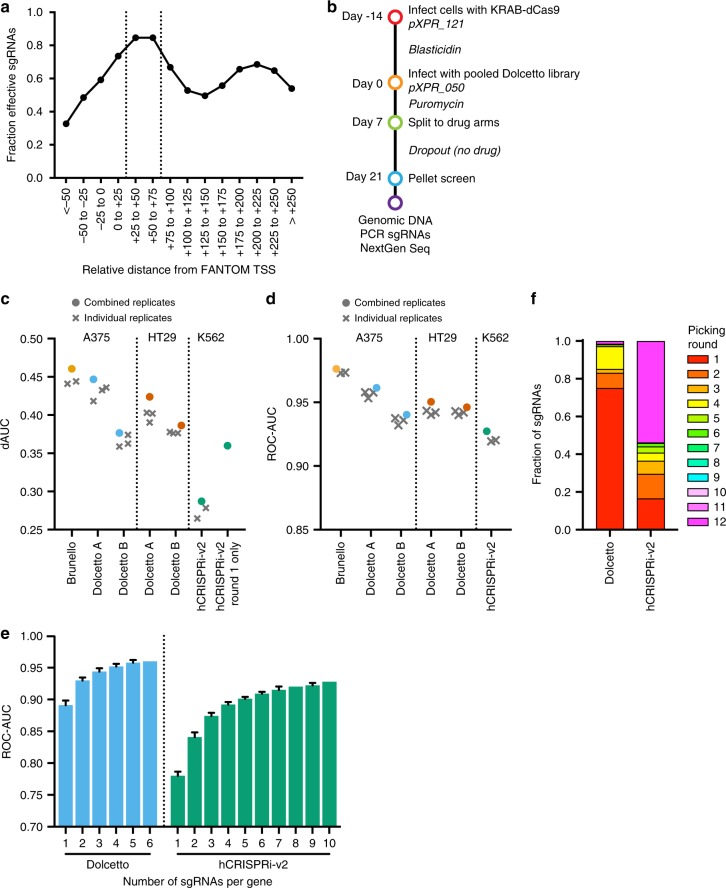
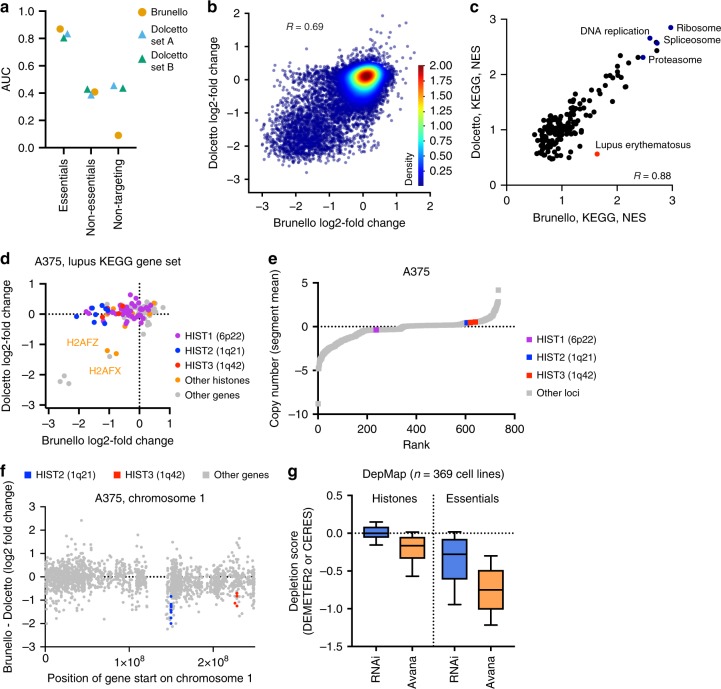
The creation of genome-wide libraries for CRISPR knockout (CRISPRko), interference (CRISPRi), and activation (CRISPRa) has enabled the systematic interrogation of gene function. Here, we show that our recently-described CRISPRko library (Brunello) is more effective than previously published libraries at distinguishing essential and non-essential genes, providing approximately the same perturbation-level performance improvement over GeCKO libraries as GeCKO provided over RNAi. Additionally, we present genome-wide libraries for CRISPRi (Dolcetto) and CRISPRa (Calabrese), and show in negative selection screens that Dolcetto, with fewer sgRNAs per gene, outperforms existing CRISPRi libraries and achieves comparable performance to CRISPRko in detecting essential genes. We also perform positive selection CRISPRa screens and demonstrate that Calabrese outperforms the SAM approach at identifying vemurafenib resistance genes. We further compare CRISPRa to genome-scale libraries of open reading frames (ORFs). Together, these libraries represent a suite of genome-wide tools to efficiently interrogate gene function with multiple modalities.


Conflict of interest statement

J.G.D. consults for Tango Therapeutics. The remaining authors declare no competing interests.

Figures

Fig. 1
Fig. 1
Improved performance of genome-wide CRISPRko libraries. a Area under the curve analysis of cell viability screens for core essential (solid line), non-essential (dashed line), and non-targeting (dotted line) gene sets in the Brunello and GeCKOv2 library screened in A375 cells. b Comparison of AUCs for essential, non-essential, and non-targeting sgRNAs across the generations of libraries screened by this group. The AUC of individual replicates are plotted as X’s, while the AUC values calculated from the averaged log2-fold change of the replicates are plotted as circular points. The Avana library was screened with 6 sgRNAs per gene. c Comparison of the dAUC across different CRISPRko libraries. All published libraries are plotted as circular points from the combination of replicates, if provided. Black line represents the average of the dAUCs. For Project Achilles, a version of the Avana library with 4 sgRNAs per gene was used; the shRNA data are shown for the same 33 cell lines that were screened with GeCKOv2. d Receiver operating characteristic analysis of cell viability screening data for the Brunello and GeCKOv2 libraries screened in A375 cells. False positive rates are determined by non-essential genes and plotted against the true positive rate, determined by essential genes. e Comparison of the dAUC and ROC-AUC values for different libraries; when multiple cell lines of data were available, the mean is plotted. GPP refers to screens described here and previously by this group. f Subsampling analysis calculating the ROC-AUC of n sgRNAs per gene in three different libraries. Error bars represent s.d. calculated from different iterations of library sampling. g Difference in the dAUC (ddAUC) for various scoring schemes when applied to the 33 cell lines screened with GeCKOv2. The box represents the 25th, 50th, and 75th percentiles; whiskers show 10th and 90th percentiles. h Comparison of the predicted out-of-frame mutation rate to the previously measured log2-fold change of sgRNAs in the flow cytometry (FC) dataset targeting cell surface genes in the NB4 cell line
Fig. 2
Fig. 2
Evaluation of an alternative tracrRNA. a Comparison of the sequence of the original tracrRNA and tracr-v2. b Comparison of the log2-fold-change of perfectly matched sgRNAs and single base mismatches targeting the essential gene EEF2 for the original tracrRNA and tracr-v2. CD81-targeting sgRNAs serve as the control. Mismatched sgRNAs are binned by position, and are numbered such that nt 20 is PAM-proximal. The box represents the 25th, 50th, and 75th percentiles, and whiskers show 10th and 90th percentiles. Two-tailed Welch’s t-test was used to compare the distributions within each bin and p-values are indicated.The number of sgRNAs in each comparison is shown at the bottom. c AUC values for essential, non-essential, and non-targeting gene sets with the original tracrRNA and tracr-v2 in genome-wide viability screens. Error bars represent the range of two or three biological replicates for screens with the original and modified tracrRNA, respectively
Fig. 3
Fig. 3
CRISPRi screening with Dolcetto. a Comparison of sgRNA activity as a function of distance from the FANTOM-annotated transcription start site (TSS). Vertical dotted lines indicate the preferred targeting site. b Schematic of viability screens performed with Dolcetto in two cell lines. c dAUC comparison of sgRNA-level performance across CRISPRi libraries by cell line. dAUC values of individual replicates are plotted as X’s while dAUCs calculated using the average log2-fold change of replicates are plotted as circular points. For hCRISPR-v2 Round 1 only, the dAUC of the hCRISPR-v2 sgRNAs that would be picked in round 1 of our selection heuristic is plotted. Brunello dAUC values are plotted for comparison. d ROC-AUC comparison of gene-level performance across CRISPRi libraries by cell line. ROC-AUC values of individual replicates are plotted as X’s while ROC-AUCs calculated using the average log2-fold change of replicates are plotted as circular points. Brunello ROC-AUC values are plotted for comparison. e Subsampling analysis, calculating the ROC-AUC of n sgRNAs per gene in Dolcetto and hCRISPRi-v2. Error bars represent s.d. calculated from different iterations of library sampling. f Fraction of sgRNAs selected in each round using the heuristics described in Supplementary Table 2 for Dolcetto and hCRISPRi-v2
Fig. 4
Fig. 4
Comparison of CRISPRko and CRISPRi. a Comparison of AUCs for essential, non-essential and non-targeting sgRNAs across CRISPRko and CRISPRi libraries screened in A375 cells. CRISPRko is plotted as circular points and CRISPRi is plotted as triangles. b Comparison of the log2-fold change of genes in Brunello and Dolcetto (average of Sets A and B). Pearson correlation is reported. c Scatter plot comparing the GSEA normalized enrichment scores (NES) for KEGG genes sets for Brunello and Dolcetto. Selected gene sets are annotated. d Scatter plot comparing log2-fold change of genes from the KEGG Systemic Lupus Erythematosus gene set for Brunello and Dolcetto in A375 cells. Histone genes are colored based on their chromosomal location. e Segmented copy number (segment mean; log2-fold change from average) of genetic loci in A375 cells. f Position of gene start along chromosome 1 compared to the difference in log2-fold change between Brunello and Dolcetto in A375 cells. g Depletion of histone genes and essential genes in data from the Project Achilles screens in 369 cell lines screened with both RNAi and CRISPR (Avana library). The box represents the 25th, 50th, and 75th percentiles; whiskers show 10th and 90th percentiles
Fig. 5
Fig. 5
CRISPRa screening with Calabrese. a Schematic of CRISPRa components. b Comparison of sgRNA activity as a function of distance from annotated transcription start site (TSS). Vertical dotted lines indicate the preferred targeting window. c Schematic of screens performed with Calabrese. d Distribution of the p-values calculated using a hypergeometric distribution equivalent to a one-sided Fisher’s exact test for the top 50 genes in vemurafenib resistance screens in A375 cells with the SAM and Calabrese libraries. e Comparison of the primary screen p-values calculated as in d and secondary screen false discovery rates (FDR). All genes shown scored with p-value < 10−3 in either the Calabrese or SAM primary screen, and are grouped accordingly. f Comparison of the average log2-fold change values for all sgRNAs targeting a gene for each of two dCas9 constructs screened with a secondary pool. Sets of non-targeting control sgRNAs are gray; dotted lines represent a 5% FDR cutoff. The gene-level Pearson correlation is indicated. g Validation rate for genes grouped by the primary screen(s) in which they scored. Dotted line indicates FDR <5%. The fraction of genes above this cutoff is reported, as well as the total number of genes in each category. The box represents the 25th, 50th, and 75th percentiles; whiskers show 10th and 90th percentiles. For the category with 5 genes, individual values are plotted and the mean indicated
Fig. 6
Fig. 6
Comparison of CRISPRa and ORF technology. a Comparison of log2-fold change values for Calabrese Set A and Set B. Each dot represents the average of the 3 sgRNAs per gene. Top scoring genes are annotated. b Distribution of the p-values for the top 50 genes in each set of Calabrese, as well as both sets combined, for selumetinib resistance screens in MelJuSo cells. P-values were calculated using a hypergeometric distribution equivalent to a one-sided Fisher’s exact test. c Comparison of log2-fold change for MEK inhibition screens in MelJuSo cells, for an ORF library screened with trametinib and the Calabrese library screened with selumetinib. Dotted lines indicate the top 100 genes in each screen. d Comparison of the average log2-fold change values for all sgRNAs targeting a gene in the secondary pool screened with either selumetinib or trametinib. Sets of non-targeting control sgRNAs are colored in gray; dotted lines represent a 5% FDR cutoff. e Validation rate of genes in the secondary screen grouped by their p-value in the primary screen (combined sets; see (b)) for selumetinib resistance in MelJuSo cells. Number of genes per category is indicated. f Validation rate for genes grouped by the primary screen in which they scored. Dotted line indicates FDR <5%. The fraction of genes pass this cutoff is reported, as well as the total number of genes in each category. The box represents the 25th, 50th, and 75th percentiles; whiskers show 10th and 90th percentiles. For the category with 12 genes, the individual values are plotted and the mean indicated. g Secondary screen results for sgRNAs targeting BRAF. Black points are sgRNAs present in both the primary (Calabrese) and secondary pools; red points are sgRNAs that were only included in the secondary pool. h Area under the curve calculated for STOP genes in CRISPRa and held-out ORF screens. For each plot, a different ORF screen cell line (HMEC, IMR90, or HPNE) was held out, and the other two, indicated at the top of each graph, were used to generate a list of STOP genes

References

    1. Doench JG. Am I ready for CRISPR? A user’s guide to genetic screens. Nat. Rev. Genet. 2018;19:67–80. doi: 10.1038/nrg.2017.97. - DOI - PubMed
    1. Shalem O, et al. Genome-scale CRISPR-Cas9 knockout screening in human cells. Science. 2014;343:84–87. doi: 10.1126/science.1247005. - DOI - PMC - PubMed
    1. Zalatan JG, et al. Engineering complex synthetic transcriptional programs with CRISPR RNA scaffolds. Cell. 2015;160:339–350. doi: 10.1016/j.cell.2014.11.052. - DOI - PMC - PubMed
    1. Gilbert LA, et al. CRISPR-mediated modular RNA-guided regulation of transcription in eukaryotes. Cell. 2013;154:442–451. doi: 10.1016/j.cell.2013.06.044. - DOI - PMC - PubMed
    1. Perez-Pinera P, et al. RNA-guided gene activation by CRISPR-Cas9-based transcription factors. Nat. Methods. 2013;10:973–976. doi: 10.1038/nmeth.2600. - DOI - PMC - PubMed

Publication types

Substances