. 2018 Dec 21;8(1):18045.
doi: 10.1038/s41598-018-35936-w.

Flavin-based metabolic cycles are integral features of growth and division in single yeast cells

Affiliations

Flavin-based metabolic cycles are integral features of growth and division in single yeast cells

Bridget L Baumgartner et al. Sci Rep. .

Abstract

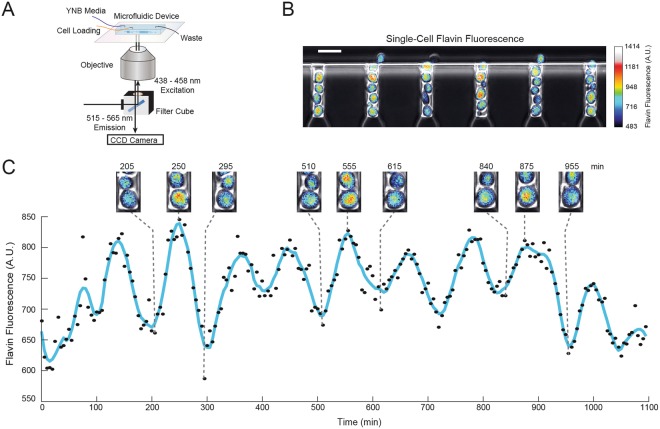
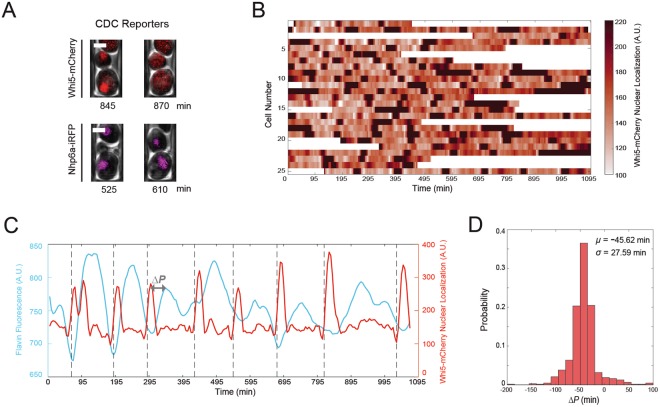
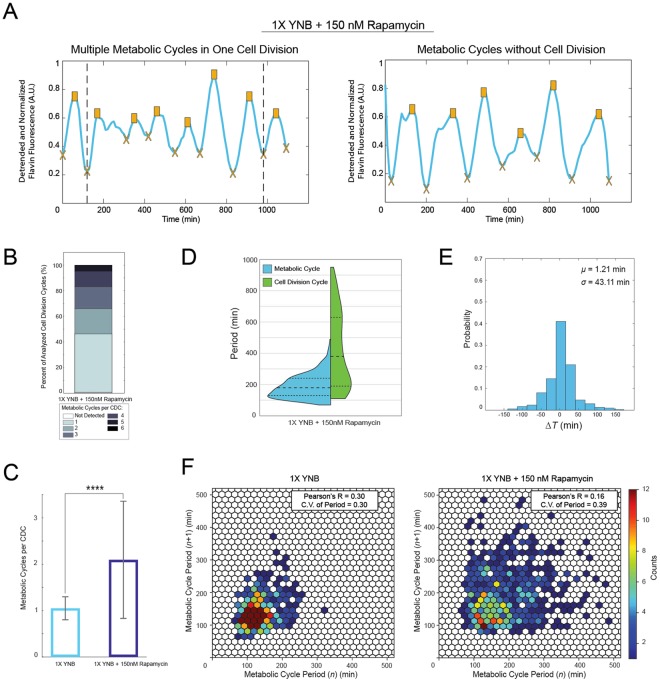
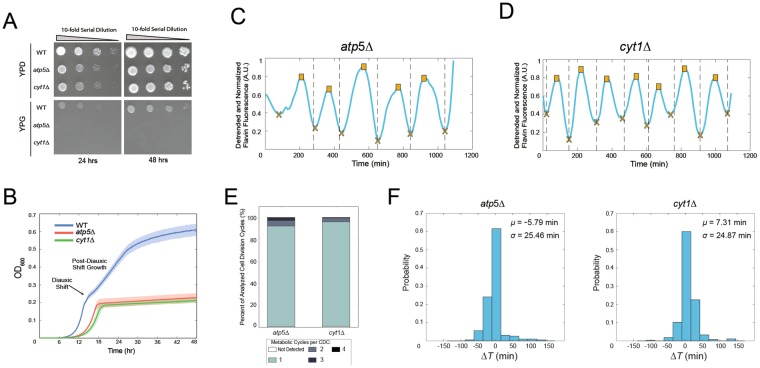
The yeast metabolic cycle (YMC) is a fascinating example of biological organization, in which cells constrain the function of specific genetic, protein and metabolic networks to precise temporal windows as they grow and divide. However, understanding the intracellular origins of the YMC remains a challenging goal, as measuring the oxygen oscillations traditionally associated with it requires the use of synchronized cultures growing in nutrient-limited chemostat environments. To address these limitations, we used custom-built microfluidic devices and time-lapse fluorescence microscopy to search for metabolic cycling in the form of endogenous flavin fluorescence in unsynchronized single yeast cells. We uncovered robust and pervasive metabolic cycles that were synchronized with the cell division cycle (CDC) and oscillated across four different nutrient conditions. We then studied the response of these metabolic cycles to chemical and genetic perturbations, showing that their phase synchronization with the CDC can be altered through treatment with rapamycin, and that metabolic cycles continue even in respiratory deficient strains. These results provide a foundation for future studies of the physiological importance of metabolic cycles in processes such as CDC control, metabolic regulation and cell aging.


Conflict of interest statement

The authors declare no competing interests.

Figures

Figure 1
Figure 1
Flavin oscillations in single yeast cells. (A) Experimental setup for observing flavin oscillations in single cells. (B) Snapshot of flavin fluorescence in single cells growing in the microfluidic device during an experiment. The phase and flavin fluorescence channels were overlayed and false coloring using the ImageJ ‘royal’ colormap was applied to the flavin channel in order to increase visual contrast for presentation. The colorbar to the right indicates the intensity of the measured flavin signal. The scale bar is 10 μm. (C) Single-cell trajectory of measured flavin fluorescence including snapshots of the cell undergoing oscillations at the labeled time points. The color bar is the same as in panel B. The scale bar is 2 μm.
Figure 2
Figure 2
Tracking the dynamics of flavin fluorescence relative to the cell division cycle. (A) Snapshots of the dynamics of fluorescent reporters of the cell division cycle in single cells. Fluorescently tagged proteins Whi5-mCherry and Nhp6a-iRFP were used for demarcating the early and late phases of the cell cycle respectively. All scale bars are 2 μm. (B) Representative heatmap of Whi5-mCherry nuclear localization from 25 single cells, demonstrating a lack of CDC synchrony. (C) Example trace of flavin fluorescence and the Whi5-mCherry nuclear localization signal in the same single-cell. Pulses of the Whi5-mCherry signal correspond to nuclear localization. The lag time between the Whi5-mCherry and flavin peaks was denoted as ΔP and was calculated as the difference between the time of the Whi5-mCherry peak and the flavin fluorescence peak within each cell division cycle. The black dotted vertical lines indicate separation of the mother and daughter nuclei as visualized by the Nhp6a-iRFP reporter. (D) Distribution of the time difference between flavin and Whi5-mCherry peaks (n = 156 cells, the mean (μ) and standard deviation (σ) for the distribution are ΔP = −45.62 ± 27.59 minutes).
Figure 3
Figure 3
Phase synchronization and coupling between the metabolic cycle and CDC in different nutrient environments. (A) Summary of the information collected from each single-cell. Across four media conditions we recorded the peaks and troughs (yellow squares and ‘X’ marks respectively) of normalized and detrended metabolic cycles, the separation of the mother and daughter nuclei (black dotted lines), and the time difference between each mother-daughter nuclear separation event and the nearest metabolic cycle trough. Thus for each condition we could quantify the metabolic cycle period (both the peak-to-peak (TP) and min-to-min (TM) period), the CDC period (TCDC) and the coupling or lag (ΔT) between the metabolic cycle and CDC. (B) Number of observed metabolic cycles occurring during each cell division. (C) Split violin plots of the distributions of peak-to-peak periods (TP) of the metabolic cycle and the CDC periods (TCDC) for cells in each nutrient condition. Dotted lines represent the quartiles of the distributions. (D) Single-cell data of each ΔT scaled by the metabolic cycle period (min-to-min period TM) versus the CDC period (TCDC) shows that regardless of the length of the cell division cycle, division is completed near a metabolic cycle trough in most cases. Data from all four media conditions is displayed. The ΔT was calculated for every CDC in each cell, a total of 2989 cell divisions from 732 individual cells. The mean ΔT/TM value is μ (blue dashed line) and σ is the standard deviation. (E) Distributions of the absolute lag time ΔT for each media condition. The number of cells analyzed for the 1X YNB, 0.25X YNB, 0.05X YNB and 10 mM urea conditions are as follows: 156 cells, 225 cells, 175 cells and 176 cells.
Figure 4
Figure 4
Rapamycin alters the periodicity of the metabolic cycle and its phase synchronization with the CDC. (A) Examples of metabolic cycles in cells treated with 150 nM rapamycin. There was an increased occurrence of multiple metabolic cycles during each cell division cycle (left panel). Further, some cells displayed metabolic cycles in the absence of complete CDC progression (right panel). (B) Number of observed metabolic cycles occurring during each cell division cycle. Metabolic cycles not occurring during a division event were not included here. (C) Comparison of the number of metabolic cycles during each CDC in 1X YNB media and 1X YNB media with 150 nM rapamycin, showing a significant increase for the rapamycin treated cells (Kolmogorov-Smirnov test; ****P < 0.0001, P = 2.89 × 10−25). Error bars are the standard deviation. (D) Split violin plot of the metabolic cycle (TP) and CDC (TCDC) periods for rapamycin treated cells. The number of cells used to calculate metabolic cycle periods was 180 and the number used to calculate CDC periods (cells that divided at least twice) was 85. Dotted lines represent the quartiles of the distributions. (E) Distribution of ΔT values for rapamycin treated cells that divided at least once during the experiment (n = 151 cells). ΔT is defined the same as in Fig. 3. (F) Hexagonal binning plot of each peak-to-peak metabolic cycle period n versus the next period n + 1. Colors correspond to the number of values within each hexagon.
Figure 5
Figure 5
Metabolic cycles continue in respiratory deficient mutants. (A) The atp5Δ and cyt1Δ mutants do not exhibit noticeable growth on YPG plates containing the non-fermentable carbon source glycerol (bottom panels). Cells growing on YPD served as a control (top panels). (B) Growth curves demonstrating that cultures of atp5Δ and cyt1Δ strains display no post-diauxic shift growth, indicating an inability to conduct respiratory metabolism. Solid lines and shaded regions represent the means and standard deviations, respectively, from four replicates for each strain. (C) Representative metabolic cycling in the atp5Δ strain. (D) Representative metabolic cycling in the cyt1Δ strain. (E) The number of metabolic cycles occurring per cell division cycle for each strain (n = 54 cells for atp5Δ, and n = 52 cells for cyt1Δ). (F) Distributions of ΔT, the time between the metabolic cycle trough and separation of the mother and daughter nuclei for each strain.

References

    1. Bell-Pedersen D, et al. Circadian rhythms from multiple oscillators: lessons from diverse organisms. Nat. Rev. Genet. 2005;6:544–556. doi: 10.1038/nrg1633. - DOI - PMC - PubMed
    1. Liu J, et al. Coupling between distant biofilms and emergence of nutrient time-sharing. Science. 2017;356:638–642. doi: 10.1126/science.aah4204. - DOI - PMC - PubMed
    1. Mirollo RE, Strogatz SH. Synchronization of pulse-coupled biological oscillators. SIAM J. on Appl. Math. 1990;50:1645–1662. doi: 10.1137/0150098. - DOI
    1. Chen KC, et al. Integrative analysis of cell cycle control in budding yeast. Mol. biology cell. 2004;15:3841–3862. doi: 10.1091/mbc.e03-11-0794. - DOI - PMC - PubMed
    1. Hirata H, et al. Oscillatory expression of the bhlh factor hes1 regulated by a negative feedback loop. Science. 2002;298:840–843. doi: 10.1126/science.1074560. - DOI - PubMed

Publication types

MeSH terms