. 2018 Dec 21;13(12):e0209713.
doi: 10.1371/journal.pone.0209713. eCollection 2018.

Effects of RNA structure and salt concentration on the affinity and kinetics of interactions between pentatricopeptide repeat proteins and their RNA ligands

Affiliations

Effects of RNA structure and salt concentration on the affinity and kinetics of interactions between pentatricopeptide repeat proteins and their RNA ligands

James J McDermott et al. PLoS One. .

Abstract

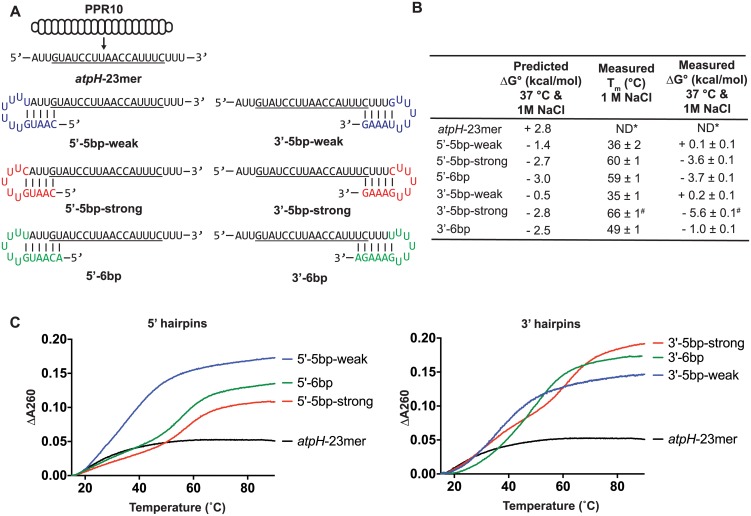
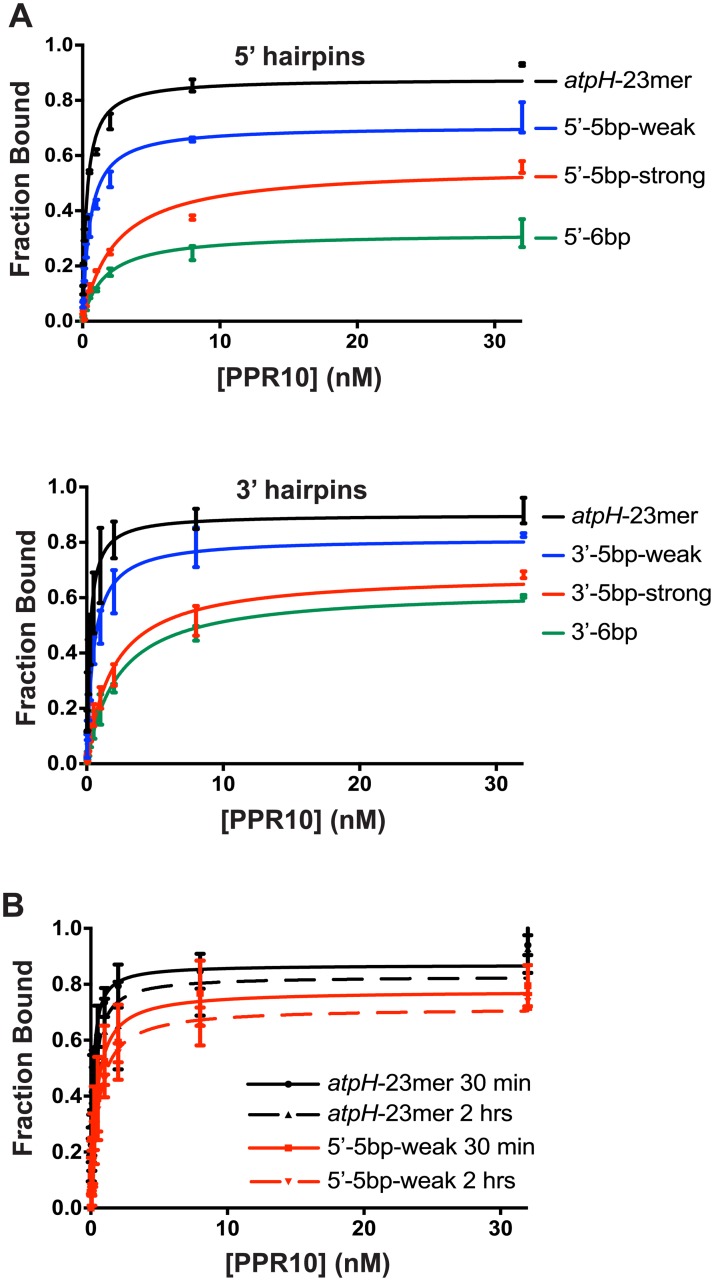
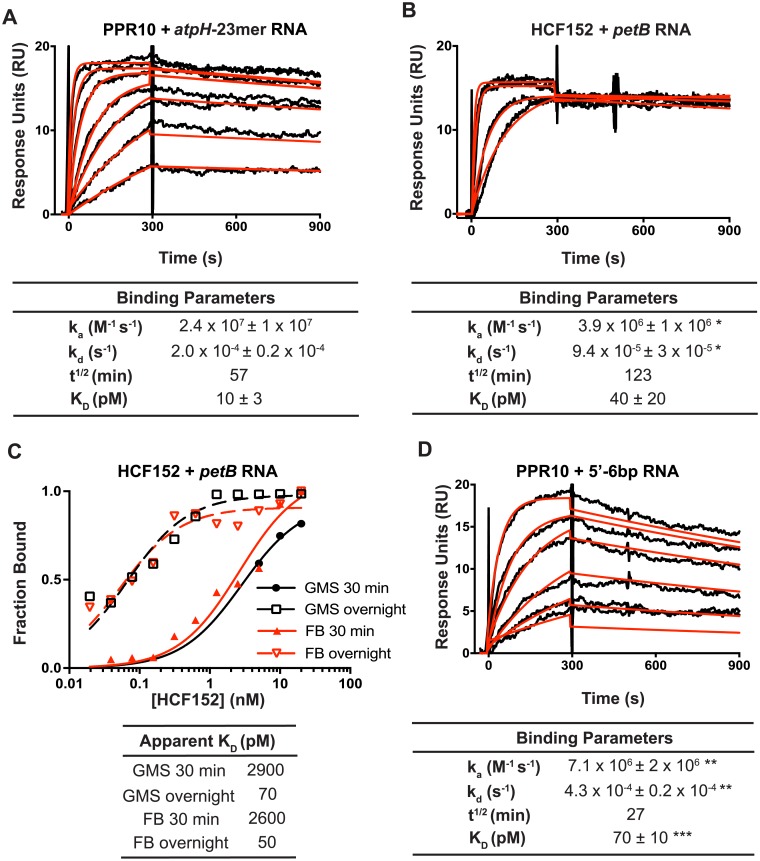
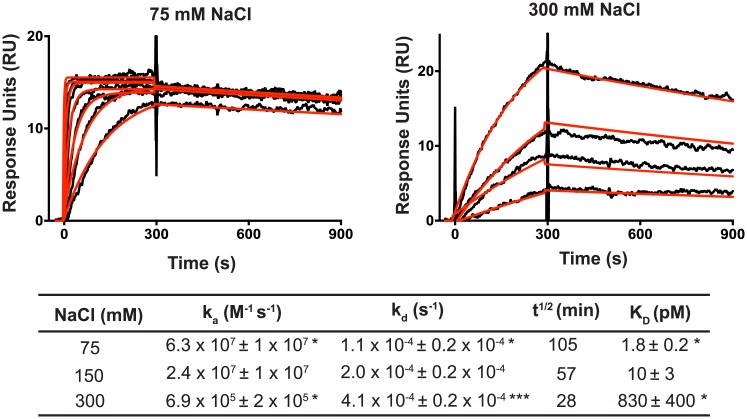
Pentatricopeptide repeat (PPR) proteins are helical repeat proteins that bind specific RNA sequences via modular 1-repeat:1-nucleotide interactions. Binding specificity is dictated, in part, by hydrogen bonds between the amino acids at two positions in each PPR motif and the Watson-Crick face of the aligned nucleobase. There is evidence that PPR-RNA interactions can compete with RNA-RNA interactions in vivo, and that this competition underlies some effects of PPR proteins on gene expression. Conversely, RNA secondary structure can inhibit the binding of a PPR protein to its specific binding site. The parameters that influence whether PPR-RNA or RNA-RNA interactions prevail are unknown. Understanding these parameters will be important for understanding the functions of natural PPR proteins and for the design of engineered PPR proteins for synthetic biology purposes. We addressed this question by analyzing the effects of RNA structures of varying stability and position on the binding of the model protein PPR10 to its atpH RNA ligand. Our results show that even very weak RNA structures (ΔG° ~ 0 kcal/mol) involving only one nucleotide at either end of the minimal binding site impede PPR10 binding. Analysis of binding kinetics using Surface Plasmon Resonance showed that RNA structures reduce PPR10's on-rate and increase its off-rate. Complexes between the PPR proteins PPR10 and HCF152 and their respective RNA ligands have long half-lives (one hour or more), correlating with their functions as barriers to exonucleolytic RNA decay in vivo. The effects of salt concentration on PPR10-RNA binding kinetics showed that electrostatic interactions play an important role in establishing PPR10-RNA interactions but play a relatively small role in maintaining specific interactions once established.


Conflict of interest statement

The authors have declared that no competing interests exist.

Figures

Fig 1
Fig 1. RNAs used to assess the effects of RNA secondary structure on PPR10 binding.
(A) Sequences and predicted secondary structures of the RNA ligands. PPR10 is shown aligned to its 23-nt in vivo footprint near atpH (atpH-23mer). PPR10’s minimal binding site is underlined [9]. The atpH-23mer is not predicted to form any structure. Nucleotides that are appended to the PPR10 footprint to introduce RNA structure are colored. (B) Predicted and measured stabilities of each RNA structure at 1 M NaCl and 2.5 μM RNA. Predictions were made with mFold [16], which predicted only one structure for each RNA. The measured Tm and ΔG° values were calculated based on thermal melting curves (n = 3, +/- standard error of the mean). Values obtained at 180 mM NaCl, at different RNA concentrations, and from assays performed in reverse (transitions from high to low temperature) are shown in S1A Fig. *ND- Not determined due to lack of detectable structure. #The measured values for the 3’-5bp-strong RNA are based on a single inflection point at 66°C, but the melting curve is biphasic (see panel C). Therefore, these values exaggerate the stability of this structure. (C) Representative melting curves at 1 M NaCl and 2.5 μM RNA.
Fig 2
Fig 2. Gel mobility shift assays demonstrating effects of RNA structure on PPR10 binding.
The RNAs (5 pM) are diagrammed in Fig 1A. PPR10 was used at concentrations of 32 nM, 8 nM, 2 nM, and six additional 2-fold dilutions. Data for replicate assays (n = 2) are shown as separate points connected by a vertical line. (A) Summary of binding data for reactions incubated for 30 minutes. Representative gels are shown in S1B Fig. (B) Comparison of results for binding reactions incubated for 30 minutes and 2 hours.
Fig 3
Fig 3. Analysis of PPR-RNA interactions by SPR.
(A) SPR analysis of PPR10-atpH RNA interactions. Representative sensorgrams are shown at top. The data (black) were fit with a 1:1 Langmuir binding model (red). The RNAs are diagrammed in Fig 1A. PPR10 was used at a concentration of 5 nM and 2-fold dilutions thereof. Values in the table (+/- standard error of the mean) were calculated from data from three replicate experiments. A negative control demonstrating specificity of PPR10 for atpH RNA is shown in S2A Fig. Residuals are shown in S2C Fig. (B) SPR analysis of interactions between HCF152 and petB RNA. HCF152 was used at a concentration of 40 nM and 2-fold dilutions thereof. Representative sensorgrams are shown. Values in the table (+/- standard error of the mean) were calculated from four replicate experiments. A negative control demonstrating the specificity of HCF152 for petB RNA is shown in S2A Fig. Residuals are shown in S2C Fig. * Significantly different from data for the PPR10-atpH RNA interaction (P<0.05 according to a students t-test). (C) HCF152-petB RNA binding curves generated from gel mobility shift (GMS) and filter binding (FB) assays, comparing results from 30 min or overnight (~13 h) binding reactions. Examples of the raw data are shown in S2D Fig. (D) Effects of RNA structure on PPR10-RNA binding kinetics. The data are displayed as in panel (A). Values that are significantly different from those for the atpH-23mer are indicated (** = P<0.01, *** = P<0.001, according to a ratio paired t-test).
Fig 4
Fig 4. Effect of salt concentration on the kinetics of PPR10-atpH RNA interactions.
Representative sensorgrams are shown at top. PPR10 was used at 5 nM and two-fold dilutions thereof. The data (black) were fit with a 1:1 Langmuir binding model (red). Residuals are shown in S2C Fig. The table below shows the binding parameters inferred from the data (average of three replicate experiments +/- standard error). Values that show a significant difference from those at 150 mM NaCl (see Fig 3A) are indicated (* = P<0.05, *** = P<0.001, according to a students t-test).

References

    1. Small I, Peeters N. The PPR motif—a TPR-related motif prevalent in plant organellar proteins. Trends Biochem Sci 2000; 25: 46–7. - PubMed
    1. Barkan A, Small I. Pentatricopeptide Repeat Proteins in Plants. Annu Rev Plant Biol 2014; 65: 415–42. 10.1146/annurev-arplant-050213-040159 - DOI - PubMed
    1. Barkan A, Rojas M, Fujii S, Yap A, Chong YS, Bond CS, et al. A combinatorial amino acid code for RNA recognition by pentatricopeptide repeat proteins. PLoS Genet 2012; 8: e1002910 10.1371/journal.pgen.1002910 - DOI - PMC - PubMed
    1. Yin P, Li Q, Yan C, Liu Y, Liu J, Yu F, et al. Structural basis for the modular recognition of single-stranded RNA by PPR proteins. Nature 2013; 504: 168–71. 10.1038/nature12651 - DOI - PubMed
    1. Shen C, Zhang D, Guan Z, Liu Y, Yang Z, Yang Y, et al. Structural basis for specific single-stranded RNA recognition by designer pentatricopeptide repeat proteins. Nat Commun 2016; 7: 11285 10.1038/ncomms11285 - DOI - PMC - PubMed

Publication types