. 2019 May 20;123(5):901-915.
doi: 10.1093/aob/mcy228.

Heterochronic reproductive developmental processes between diploid and tetraploid cytotypes of Paspalum rufum

Affiliations

Heterochronic reproductive developmental processes between diploid and tetraploid cytotypes of Paspalum rufum

Mariano Soliman et al. Ann Bot. .

Abstract

Background and aims: Apomixis is an asexual reproductive mode via seeds that generate maternal clonal progenies. Although apomixis in grasses is mainly expressed at the polyploid level, some natural diploid genotypes of Paspalum rufum produce aposporous embryo sacs in relatively high proportions and are even able to complete apomixis under specific conditions. However, despite the potential for apomixis, sexuality prevails in diploids, and apomixis expression is repressed for an as yet undetermind reason. Apomixis is thought to derive from a deregulation of one or a few components of the sexual pathway that could be triggered by polyploidy and/or hybridization. The objectives of this work were to characterize and compare the reproductive development and the timing of apospory initial (AI) emergence between diploid genotypes with potential for apomixis and facultative apomictic tetraploid cytotypes of P. rufum.

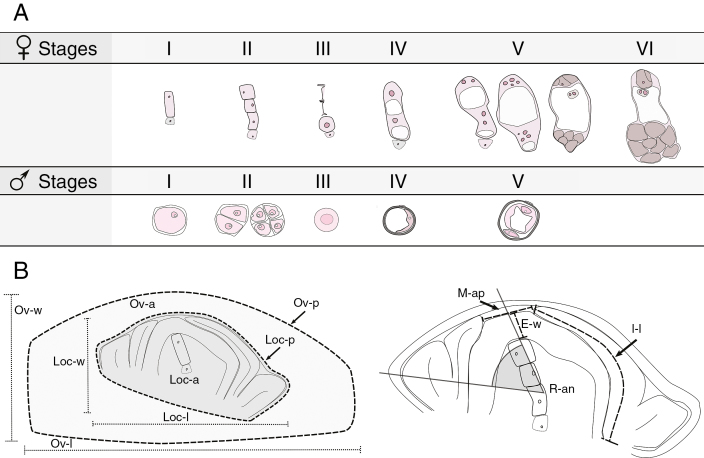
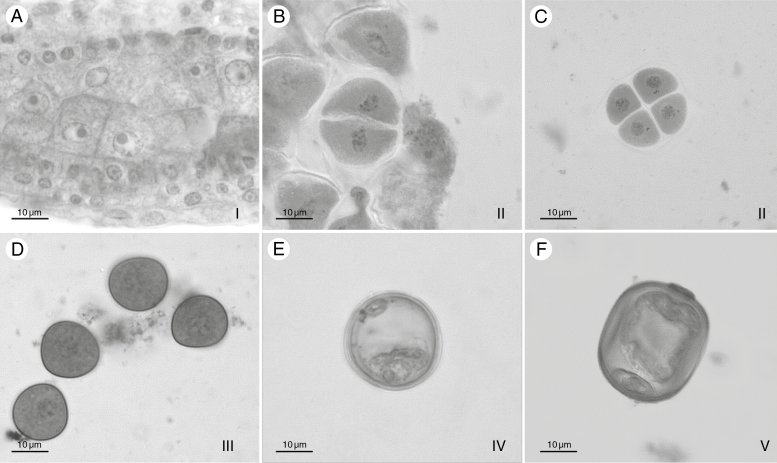
Methods: Reproductive characterization was performed by cytoembryological observations of cleared ovaries and anthers during all reproductive development steps and by quantitative evaluation of the ovule growth parameters.

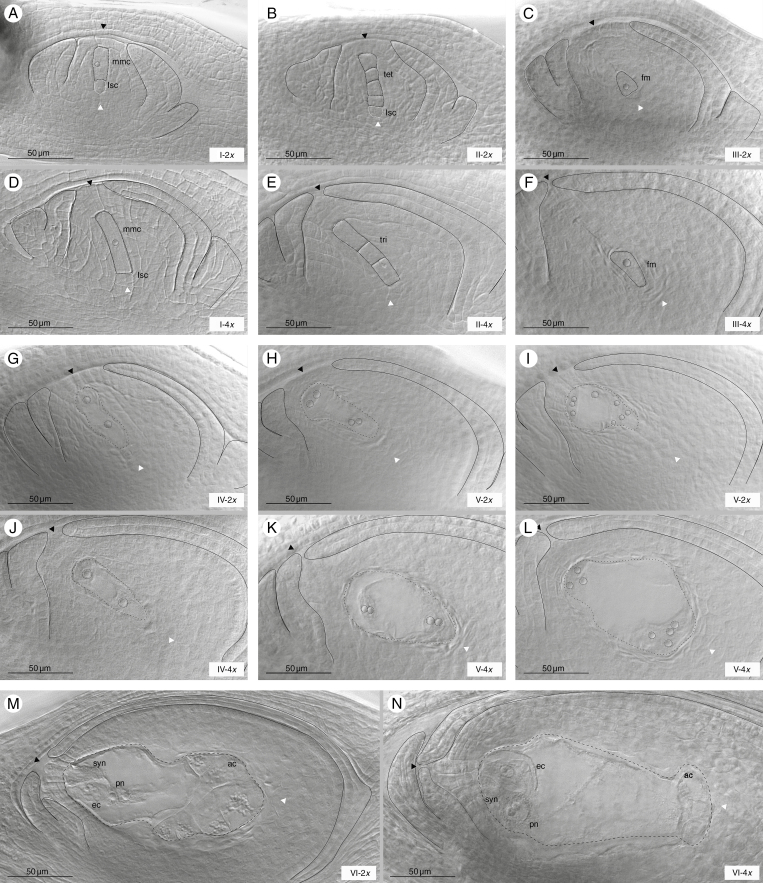
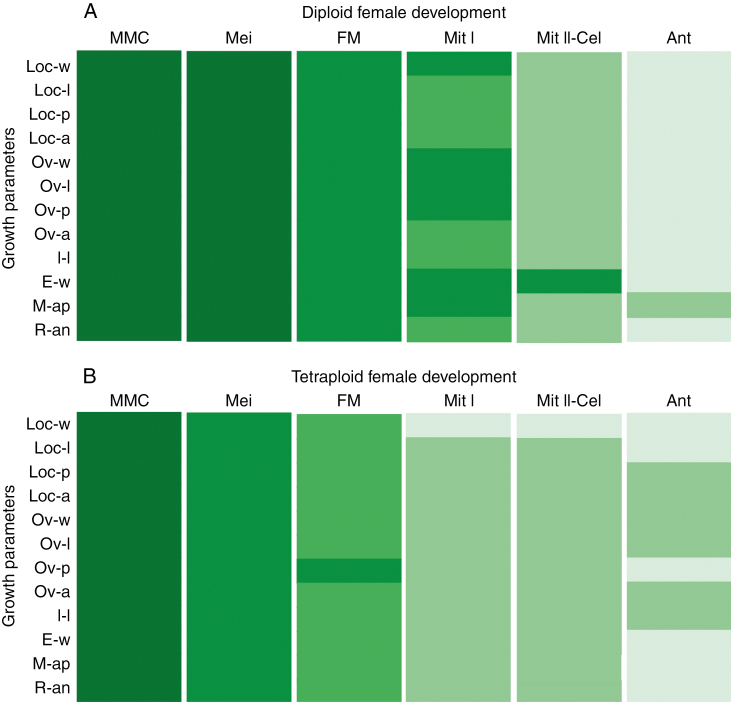
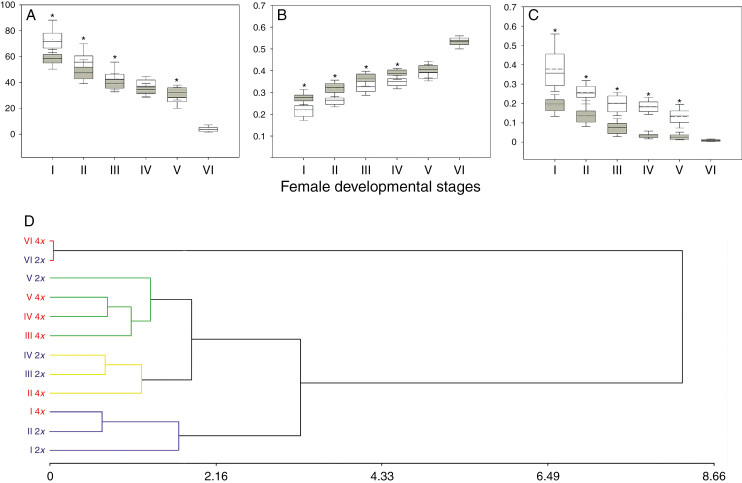
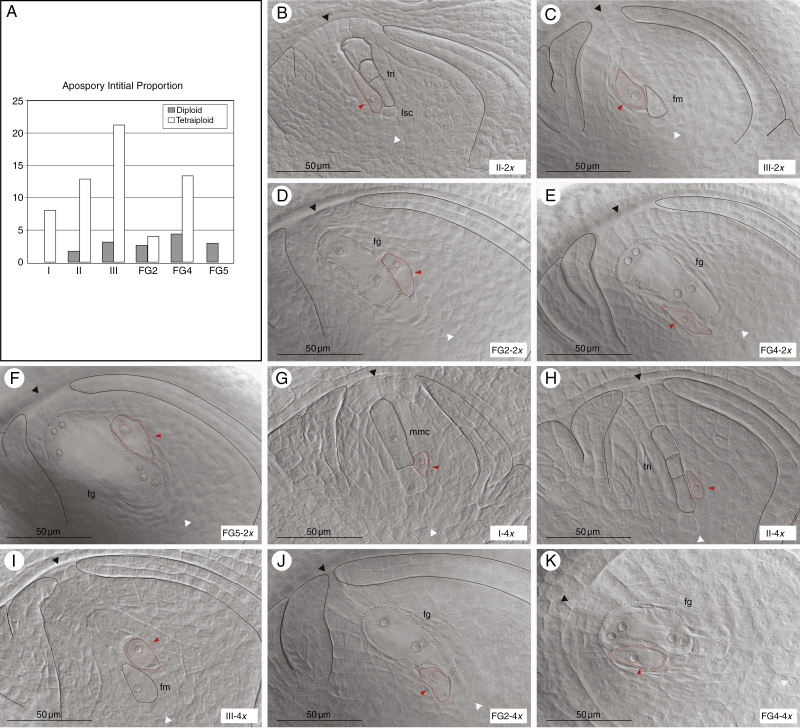
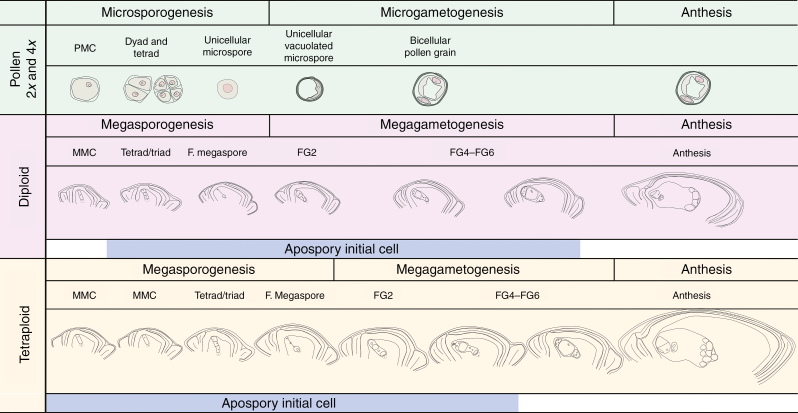
Key results: Cytoembryological observations showed that in diploids, both female and male reproductive development is equally synchronized, but in tetraploids, megasporogenesis and early megagametogenesis are delayed with respect to microsporogenesis and early microgametogenesis. This delay was also seen when ovary growth was taken as a reference parameter. The analysis of the onset of AIs revealed that they emerge during different developmental periods depending on the ploidy level. In diploids, the AIs appeared along with the tetrad (or triad) of female meiocytes, but in tetraploids they appeared earlier, at the time of the megaspore mother cell. In both cytotypes, AIs can be seen even during megagametogenesis.

Conclusions: Overall observations reveal that female sexual reproductive development is delayed in tetraploids as compared with diploid genotypes, mainly at meiosis. In tetraploids, AIs appear at earlier sexual developmental stages than in diploids, and they accumulate up to the end of megasporogenesis. The longer extension of megasporogenesis in tetraploids could favour AI emergence and also apomixis success.

Keywords: Paspalum rufum; Apomixis; apospory; apospory initial; heterochrony; polyploidy; reproductive development; sexuality.


Figures

Fig. 1.
Fig. 1.
Scheme of female and male reproductive developmental stages and quantitative ovule developmental parameters analysed. (A) The upper panel describes the six female developmental stages considered: megaspore mother cell (I), tetrad or triad just after meiosis has occurred (II), functional and degenerated megaspores (III) and the two nucleate megagametophyte just after the first mitosis (IV; FG2). Subsequent stages include four and eight nucleate megagametophytes after the second and third mitosis, and megagametophyte cellularization (V; FG4–FG6) and finally the mature megagametophyte at anthesis (VI) (from stages I to IV, LSCs are shown with dashed lines and micropylar and chalazal ends are in the top and in the lower sides, respectively). Nucleoli are shown in dark pink, vacuoles in white and megagametophyte cells in brown. In the lower panel, the five male reproductive developmental stages considered are specified: microspore mother cell (I), dyad and tetrads (II), unicellular microspore (III), vacuolated unicellular microspore (IV) and bicellular pollen grain (V). Nucleoli and vacuoles are shown in white and the nucleus is in dark pink. (B) Diagram describing ovary growth variables: locule width, Loc-w; locule length, Loc-l; locule perimeter, Loc-p; locule area, Loc-a (dark grey); ovary width, Ov-w; ovary length, Ov-l; ovary perimeter, Ov-p; ovary area, Ov-a (light grey); integument length, I-l; epidermis width, E-w; micropyle aperture, M-ap; and rotation angle, R-an.
Fig. 2.
Fig. 2.
Female sexual reproductive development in diploid and tetraploid cytotypes. Megasporogenesis in diploid (A–C) and tetraploid (D–F) cytotypes. (A and D) MMC (mmc); (B and E) tetrad/triad after meiosis (tet/tri); (C and F) functional megaspore (fm). Megagametogenesis in diploid (G–I) and tetraploid (J–L) cytotypes. (G and J) Two nucleate FGs after the first mitosis; (H and K) a four nucleate FG after the second mitosis and (I and L) an eight nucleate FG (outlined by short dashed black lines) after the third mitosis; (M and N) a mature female megagameophyte (outlined by large dashed black lines) containing one egg cell (ec), synergid cells (syn), a binucleate central cell (pn) and a group of antipodal cells (ac) at the anthesis developmental stage of diploid and tetraploid cytotypes, respectively. Structures and cells indicated are marked with black dashed lines, while the nucleolus is marked with black pointed lines. Large stack cells (lscs) are marked with white dashed lines. Micropylar and chalazal ends are indicated by black and white arrows respectively, and integuments are marked with black lines. Scale bars indicate 50 μm. Stages of development and ploidy levels are specified at the bottom right of each image. Genotypes shown in each image are: R5#49 (A, B), H#39 (C, G, H, I, M), Q3756 (D, N), Q3785 (E, L) and Q4485 (F, J, K).
Fig. 3.
Fig. 3.
Typical examples of the male sexual reproductive developmental stages observed. Anther showing (A) tapetum and MiMCs; (B) dyads just after the first meiotic division; (C) tetrads after the second meiotic division; (D) a recently formed unicellular microspore; (E) a vacuolated unicellular microspore; and (F) a bicellular pollen grain. Microspore and microgametophyte developmental stages are specified at the bottom right of each image. Scale bars indicate 10 μm. All images are of genotype H#39.
Fig. 4.
Fig. 4.
Variation of ovary growth parameters throughout female sexual reproductive development in diploid and tetraploid cytotypes. Diagrams show 12 ovary growth parameters analysed during the six female developmental stages. Different cell colours indicate that the ovary growth parameters corresponding to different female sexual developmental stages are statistically significantly different (P < 0.01). Ovary parameters are specified: locule width, Loc-w; locule length, Loc-l; locule perimeter, Loc-p; locule area, Loc-a; ovary width, Ov-w; ovary length, Ov-l; ovary perimeter, Ov-p; ovary area, Ov-a; integument length, I-l; epidermis width, E-w; micropyle aperture, M-ap; and rotation angle, R-an. Female developmental stages are specified as described in the Materials and Methods.
Fig. 5.
Fig. 5.
Comparative analysis of ovule growth throughout female sexual development between diploid and tetraploid cytotypes. The first three panels (A–C) show box plot graphics of three size-independent (SI) ovary growth parameters of diploid (white) and tetraploid (grey) cytotypes: (A) rotation angle, (B) relative integument length and (C) relative micropyle aperture. Box limits represent the 25th and 75th percentiles; the full line inside the box designates the mean value, and dashed line the median value. Asterisks mark statistically significant differences between average values of SI ovule growth parameters. (D) Dendrograms derived from the UPGMA based on Euclidean distance include all the ovary SI parameters analysed at the six sexual female developmental stages scored in diploid and tetraploid cytotypes (cophenetic correlation coefficient: 0.939). The main clusters are shown in different colours (Euclidean distance cut-off, 1.75). Diploid and tetraploid cytotypes are expressed as 2x (blue) and 4x (red); sexual developmental stages are named as described before.
Fig. 6.
Fig. 6.
AI emergence during sexual reproductive development in diploid and tetraploid cytotypes. (A) The proportion of ovaries containing AIs at each female reproductive developmental stage in diploid (grey) and tetraploid (white) cytotypes. (B–K) Cleared ovaries containing AIs at different female sexual developmental stages. In diploids: (B) triad (tri) after meiosis, (C) functional megaspore (fm); megagametogenesis stages after (D) the first mitosis, (E) the second mitosis and (F) the third mitosis (FG2, FG4 and FG5, respectively). In tetraploids: (G) MMC (mmc), (H) triad after meiosis, (I) functional megaspore, megagametogenesis stages after (J) the first mitosis and (K) the second mitosis. Red dashed lines and arrows indicate AIs. Structures and cells are marked with red/black dashed lines, while nucleoli are marked with black/red pointed lines. Large stack cells (lsc) are marked with white dashed lines. Micropylar and chalazal ends are indicated by black and white arrowheads, respectively, integuments are marked with black lines. Scale bars indicate 50 μm. Stages of development and ploidy levels are specified at the bottom right of each image. Genotypes of each image are: R5#49 (B), #31 (C), #39 (D–F), Q3756 (G–I), Q3785 (J) and Q4485 (K).
Fig. 7.
Fig. 7.
Comparison of reproductive developmental processes in both diploid and tetraploid cytotypes. Diploid and tetraploid male reproductive development is described in the upper part of the panel (light green). Female sexual developmental stages for diploid (lilac) and tetraploid (light yellow) cytotypes are represented separately according to their synchronization with male reproductive development. The period during which AIs are present is also specified by a light blue coloured line at the bottom of each panel. LSCs are shown by dashed lines.

Similar articles

Cited by

References

    1. Acuña CA, Martínez EJ, Quarin CL. 2005. Sexual diploid and apomictic tetraploid races in Thrasya petrosa (Gramineae). Australian Journal of Botany 53: 479–484.
    1. Acuña CA, Blount AR, Quesenberry KH, Kenworthy KE, Hanna WW. 2009. Bahiagrass tetraploid germplasm: reproductive and agronomic characterization of segregating progeny. Crop Science 49: 581.
    1. Acuña C, Blount AR, Quesenberry KH, Kenworthy KE, Hanna WW. 2011. Tetraploid bahiagrass hybrids: breeding technique, genetic variability and proportion of heterotic hybrids. Euphytica 179: 227–235.
    1. Albertini E, Marconi G, Reale L, et al. . 2005. SERK and APOSTART. Candidate genes for apomixis in Poa pratensis. Plant Physiology 138: 2185–2199. - PMC - PubMed
    1. Aliyu OM, Schranz ME, Sharbel TF. 2010. Quantitative variation for apomictic reproduction in the genus Boechera (Brassicaceae). American Journal of Botany 97: 1719–1731. - PubMed

Publication types