

sRNA-FISH: versatile fluorescent in situ detection of small RNAs in plants
- PMID: 30577085
- PMCID: PMC6465150
- DOI: 10.1111/tpj.14210
sRNA-FISH: versatile fluorescent in situ detection of small RNAs in plants
Abstract
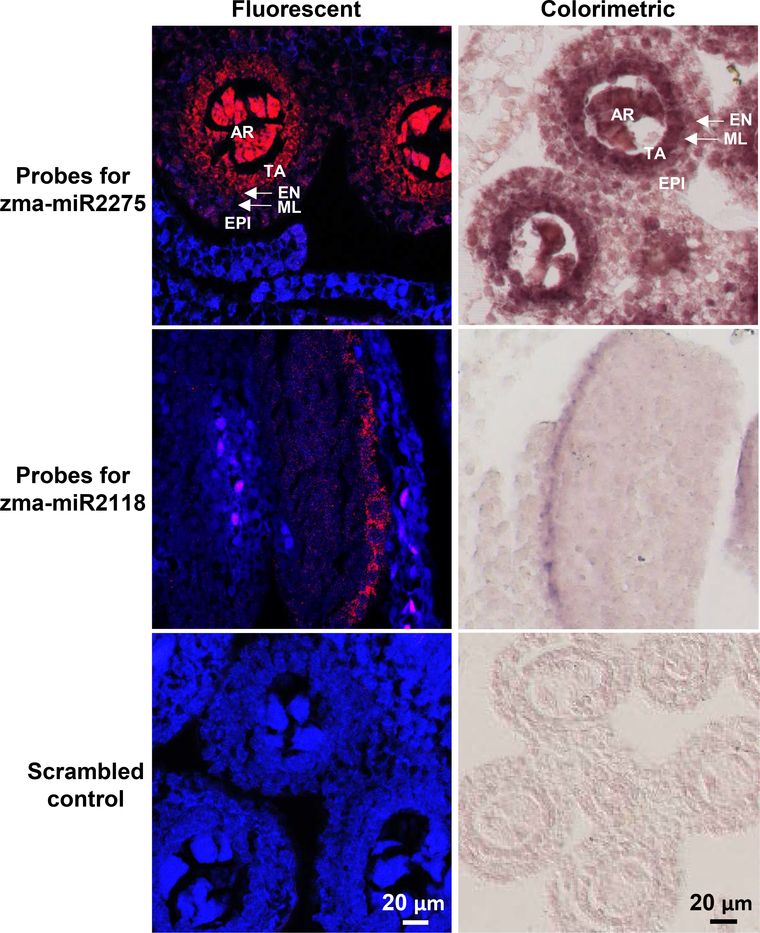
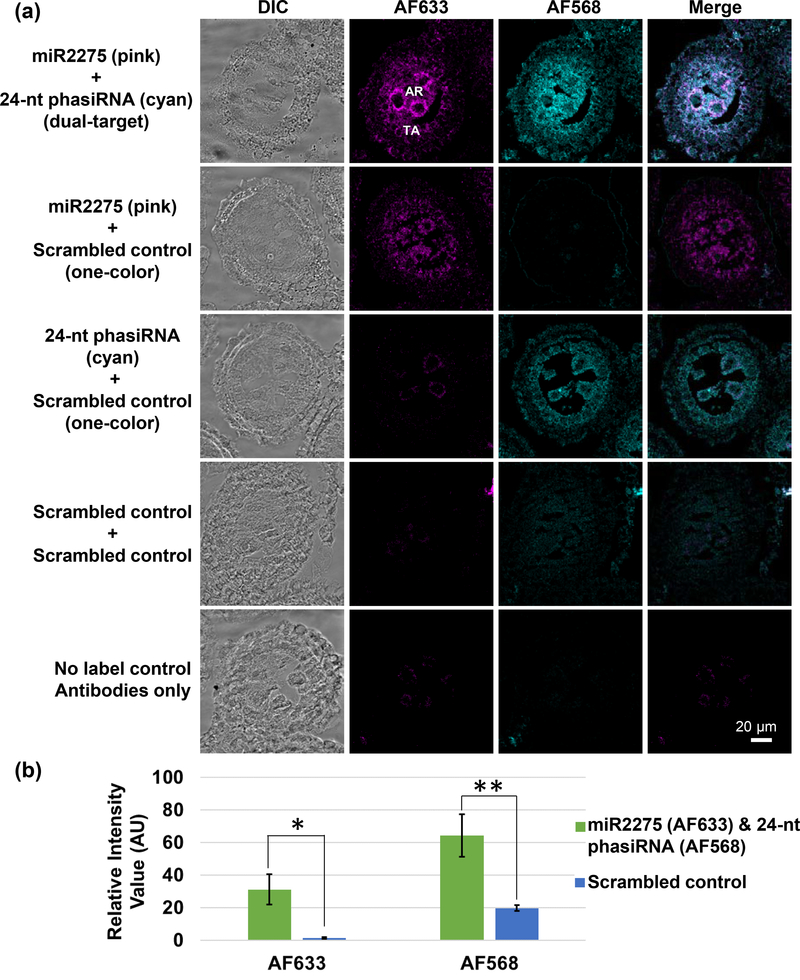
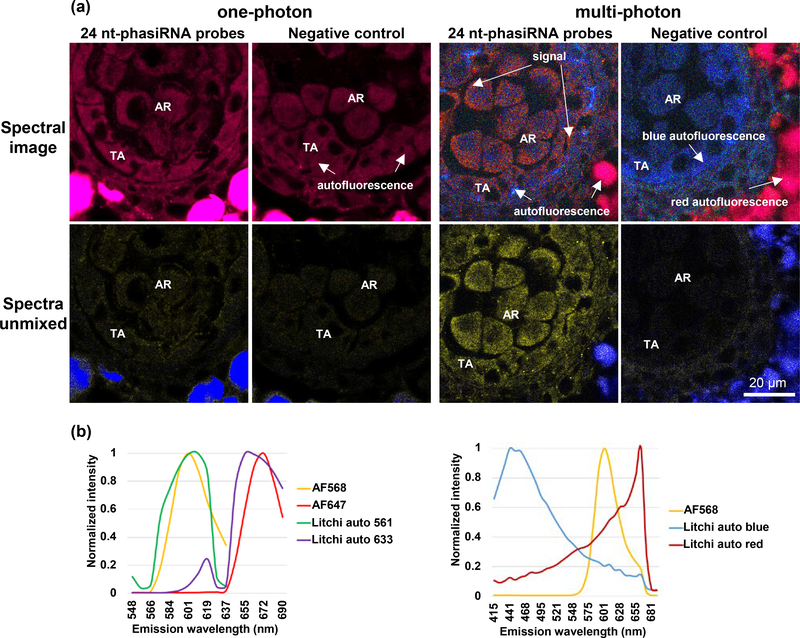
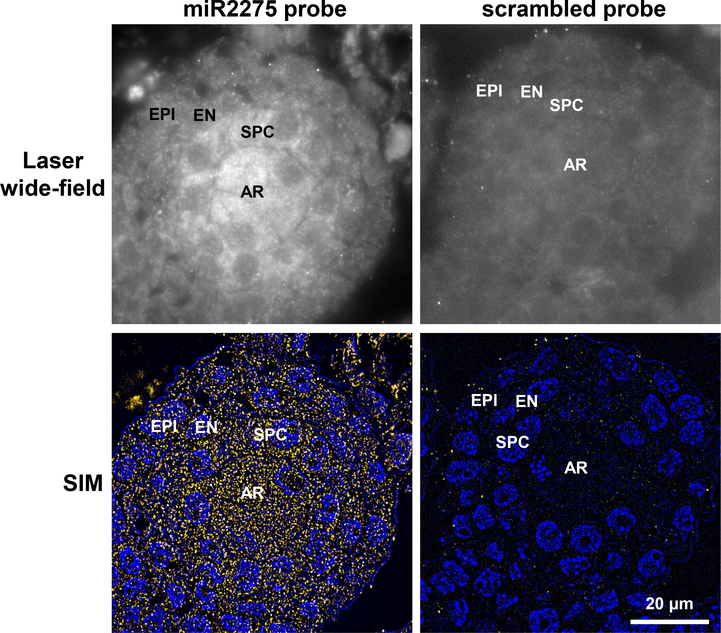
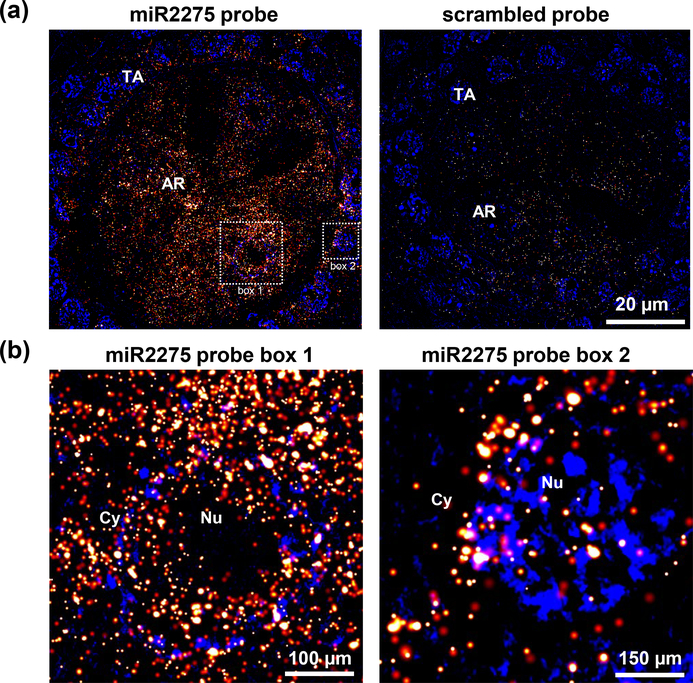
Localization of mRNA and small RNAs (sRNAs) is important for understanding their function. Fluorescent in situ hybridization (FISH) has been used extensively in animal systems to study the localization and expression of sRNAs. However, current methods for fluorescent in situ detection of sRNA in plant tissues are less developed. Here we report a protocol (sRNA-FISH) for efficient fluorescent detection of sRNAs in plants. This protocol is suitable for application in diverse plant species and tissue types. The use of locked nucleic acid probes and antibodies conjugated with different fluorophores allows the detection of two sRNAs in the same sample. Using this method, we have successfully detected the co-localization of miR2275 and a 24-nucleotide phased small interfering RNA in maize anther tapetal and archesporial cells. We describe how to overcome the common problem of the wide range of autofluorescence in embedded plant tissue using linear spectral unmixing on a laser scanning confocal microscope. For highly autofluorescent samples, we show that multi-photon fluorescence excitation microscopy can be used to separate the target sRNA-FISH signal from background autofluorescence. In contrast to colorimetric in situ hybridization, sRNA-FISH signals can be imaged using super-resolution microscopy to examine the subcellular localization of sRNAs. We detected maize miR2275 by super-resolution structured illumination microscopy and direct stochastic optical reconstruction microscopy. In this study, we describe how we overcame the challenges of adapting FISH for imaging in plant tissue and provide a step-by-step sRNA-FISH protocol for studying sRNAs at the cellular and even subcellular level.
Keywords: Litchi chinensis; Oryza sativa; Zea mays; sRNA; LNA probes; fluorescent in situ hybridization; immunofluorescence; microRNA; multi-photon microscopy; technical advance.
© 2018 The Authors The Plant Journal © 2018 John Wiley & Sons Ltd.
Conflict of interest statement
CONFLICTS OF INTEREST
The authors declare no conflicts of interest.
Figures

Similar articles
-
Fluorescent In Situ Detection of Small RNAs in Plants Using sRNA-FISH.Methods Mol Biol. 2024;2784:101-111. doi: 10.1007/978-1-0716-3766-1_7. Methods Mol Biol. 2024. PMID: 38502481
-
Quantitative, super-resolution localization of small RNAs with sRNA-PAINT.Nucleic Acids Res. 2020 Sep 18;48(16):e96. doi: 10.1093/nar/gkaa623. Nucleic Acids Res. 2020. PMID: 32716042 Free PMC article.
-
Locked nucleic acid flow cytometry-fluorescence in situ hybridization (LNA flow-FISH): a method for bacterial small RNA detection.J Vis Exp. 2012 Jan 10;(59):e3655. doi: 10.3791/3655. J Vis Exp. 2012. PMID: 22258228 Free PMC article.
-
Small RNA-mediated regulation in bacteria: A growing palette of diverse mechanisms.Gene. 2018 May 20;656:60-72. doi: 10.1016/j.gene.2018.02.068. Epub 2018 Mar 1. Gene. 2018. PMID: 29501814 Review.
-
Computational tools for plant small RNA detection and categorization.Brief Bioinform. 2019 Jul 19;20(4):1181-1192. doi: 10.1093/bib/bbx136. Brief Bioinform. 2019. PMID: 29059285 Free PMC article. Review.
Cited by
-
Genome-Wide Identification and Characterization of Small Peptides in Maize.Front Plant Sci. 2021 Jun 16;12:695439. doi: 10.3389/fpls.2021.695439. eCollection 2021. Front Plant Sci. 2021. PMID: 34220917 Free PMC article.
-
Simultaneous detection of miRNA and mRNA at the single-cell level in plant tissues.Plant Biotechnol J. 2023 Jan;21(1):136-149. doi: 10.1111/pbi.13931. Epub 2022 Oct 20. Plant Biotechnol J. 2023. PMID: 36148792 Free PMC article.
-
Analysing the loss of embryogenic competence in long-term cell lines of Solanum betaceum Cav.: involvement of miR827, phosphate and sugar.BMC Plant Biol. 2025 Jul 3;25(1):851. doi: 10.1186/s12870-025-06786-2. BMC Plant Biol. 2025. PMID: 40610861 Free PMC article.
-
Tapetum-Dependent Male Meiosis Progression in Plants: Increasing Evidence Emerges.Front Plant Sci. 2020 Jan 16;10:1667. doi: 10.3389/fpls.2019.01667. eCollection 2019. Front Plant Sci. 2020. PMID: 32010157 Free PMC article. Review.
-
Biogenesis, Trafficking, and Function of Small RNAs in Plants.Front Plant Sci. 2022 Feb 17;13:825477. doi: 10.3389/fpls.2022.825477. eCollection 2022. Front Plant Sci. 2022. PMID: 35251095 Free PMC article.
References
-
- Barroso-Chinea P, Aymerich MS, Castle MM, Perez-Manso M, Tunon T, Erro E and Lanciego JL (2007) Detection of two different mRNAs in a single section by dual in situ hybridization: a comparison between colorimetric and fluorescent detection. J Neurosci Meth, 162, 119–128. - PubMed
-
- Beliveau BJ, Boettiger AN, Avendano MS, Jungmann R, McCole RB, Joyce EF, Kim-Kiselak C, Bantignies F, Fonseka CY, Erceg J, Hannan MA, Hoang HG, Colognori D, Lee JT, Shih WM, Yin P, Zhuang X and Wu CT (2015) Single-molecule super-resolution imaging of chromosomes and in situ haplotype visualization using Oligopaint FISH probes. Nat Commun, 6, 7147. - PMC - PubMed
-
- Berezikov E (2011) Evolution of microRNA diversity and regulation in animals. Nat Rev Gen, 12, 846–860. - PubMed
-
- Clay H and Ramakrishnan L (2005) Multiplex fluorescent in situ hybridization in zebrafish embryos using tyramide signal amplification. Zebrafish, 2, 105–111. - PubMed
