Review
. 2018 Dec 20;7(1):2.
doi: 10.3390/medsci7010002.

Neuroimaging of Traumatic Brain Injury

Affiliations
Review

Neuroimaging of Traumatic Brain Injury

David B Douglas et al. Med Sci (Basel). .

Abstract

The purpose of this article is to review conventional and advanced neuroimaging techniques performed in the setting of traumatic brain injury (TBI). The primary goal for the treatment of patients with suspected TBI is to prevent secondary injury. In the setting of a moderate to severe TBI, the most appropriate initial neuroimaging examination is a noncontrast head computed tomography (CT), which can reveal life-threatening injuries and direct emergent neurosurgical intervention. We will focus much of the article on advanced neuroimaging techniques including perfusion imaging and diffusion tensor imaging and discuss their potentials and challenges. We believe that advanced neuroimaging techniques may improve the accuracy of diagnosis of TBI and improve management of TBI.

Keywords: TBI; concussion; diffusion tensor imaging; perfusion imaging; traumatic brain injury.


Conflict of interest statement

The authors declare no conflicts of interest. The views expressed in this article are those of the authors and do not reflect the official policy or position of the US Government, the Department of Defense, or the Department of the Air Force.

Figures

Figure 1
Figure 1
Extra-axial hemorrhage patterns. (A) Epidural hematoma. Thirty-three-year-old man was brought in by ambulance after a motor vehicle accident. Axial image demonstrates a biconvex shaped extra-axial fluid collection superficial to the left occipital lobe with hyperdense and hypodense components. Adjacent left temporal bone fracture not seen on this axial image. (B) Bilateral subdural hematomas. Seventy-three-year-old woman presented after a fall out of bed with dizziness. Axial image demonstrates bilateral crescentic shaped fluid collections, which were found to cross the coronal sutures. (C) Massive subarachnoid hemorrhage. Ninety-seven-year-old man on anticoagulation fell while walking. Axial image demonstrates a subarachnoid hemorrhage within the basal cisterns. Patient expired five days later due to cardiorespiratory failure. (D) Subdural hematoma with developing subfalcine herniation. Sixty-nine-year-old man on anticoagulation fell and struck his head. Coronal image demonstrates subdural hematoma along the right cerebral convexity with mass effect on adjacent lateral ventricle, midline shift, and subfalcine herniation.
Figure 2
Figure 2
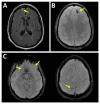
Intra-axial injury patterns. (A) Nonhemorrhagic brain surface contusion. Sixty-six-year-old male fell and hit head on concrete with subsequent loss of consciousness. Axial T2-weighted fluid-attenuated inversion recovery (FLAIR) image demonstrates focal increased signal within the right frontal lobe cortex. (B) Hemorrhagic brain contusion. Twenty-four-year-old male who fell and hit his head after playing basketball with subsequent loss of consciousness. Axial T2*-weighted gradient echo (GRE) image demonstrates focal region of hypointense signal in the left front lobe. (C) Diffuse axonal injury. Forty-year-old male after falling from multiple flights of stairs. Two axial T2* susceptibility-weighted imaging (SWI) images demonstrate multiple foci of hypointensity consistent with punctate hemorrhage at the gray-white junctions. This is a consequence of shearing forces.
Figure 3
Figure 3
This figure illustrates the relationship between the volume of the intracranial mass (e.g., epidural hematoma), the volume of the intracranial venous blood, the volume of intracranial arterial blood, the volume of brain, the volume of cerebrospinal fluid (CSF), and the intracranial pressure (ICP). Initially, as the mass enlarges, venous blood and CSF are expelled out of the intracranial space and the ICP remains normal, which is referred to as the compensated state. If the extra-axial hematoma continues to increase, a decompensated state will be reached and the ICP will elevate with increasing mass volume. Reprint from the Advanced Trauma Life Support Tenth Edition Head Trauma lecture with permission from the American College of Surgeons [17].
Figure 4
Figure 4
This figure illustrates the relationship between the volume of the mass (e.g., an epidural hematoma) and the ICP. Initially, as the mass enlarges, the ICP remains normal. This is referred to as the compensated state. If the volume of mass hematoma continues to increase beyond the point of decompensation, the ICP will rapidly elevate with increasing mass volume. This is referred to as the decompensated state and, in the absence of urgent intervention, will ultimately result in herniation. Reprint from the Advanced Trauma Life Support Tenth Edition Head Trauma lecture with permission from the American College of Surgeons [17].
Figure 5
Figure 5
Noncontrast and perfusion computed tomography (PCT) images from a patient with severe traumatic brain injury (TBI). (A) Noncontrast CT at admission revealed a small hemorrhagic contusion in the right frontal lobe (arrow). Admission PCT images demonstrates a large territory of decreased regional cerebral blood volume (rCBV) (B), increased mean transit time (MTT) (C) and decreased regional cerebral blood flow (rCBF) (D). Follow-up noncontrast CT at 24 h (E) demonstrates increased areas of hemorrhagic contusion in the right frontal lobe where the perfusion abnormality was seen. Follow-up noncontrast CT at 15-days (F) demonstrates evolving hemorrhagic contusion and encephalomalacia in the right frontal lobe, which corresponds to the same distribution that is seen on the perfusion-CT on admission. Reprinted with permission from [35].
Figure 6
Figure 6
Contrast-enhanced and PCT images from a patient with severe TBI. (A) Contrast-enhanced CT imaging at admission demonstrates a right-sided subdural hematoma causing mass effect on the underlying brain and midline shift. (B) rCBF PCT imaging at admission demonstrates decreased rCBF in the right temporal lobe. (C) Contrast-enhanced CT image after surgical evacuation of the hematoma demonstrates resolution of the right-sided subdural hematoma, mass effect and midline shift. (D) rCBF PCT imaging after surgical evacuation of the right-sided hematoma demonstrates normalization of the rCBF in the right temporal lobe. Reprinted with permission from [35].
Figure 7
Figure 7
Contrast-enhanced and PCT images of a case of TBI with intracranial hypertension. The contrast enhanced CT (A) demonstrated left-sided scalp hematoma. The rCBF (B) and rCBV (C) trended toward lower values especially in the occipital lobes. The MTT (D) demonstrated significantly higher values, reflecting altered cerebral autoregulation after TBI. Reprinted with permission from [35].
Figure 8
Figure 8
T1-weighted and diffusion tensor imaging (DTI). (A) Contrast-enhanced T1-weighted image. Note that the white matter is all the exact same grayscale and the direction of each white matter tract cannot be discerned. (B) Grayscale DTI anisotropy map for one diffusion-sensitizing gradient. Note that there are varying grayscales within the white matter, which correspond to the amount of diffusion signal for the particular directional diffusion-sensitizing gradient applied during the acquisition. (C) Color DTI anisotropy map overlaid onto a T1 post-contrast image. The Color DTI anisotropy is based on the composite of multiple diffusion-sensitizing gradient images. Note that there are multiple colors within the white matter map with red indicating transverse direction, blue indicating superior–inferior direction and green indicating anterior-posterior direction.
Figure 9
Figure 9
Illustration of 3D ellipsoid and formulas for mean diffusivity (MD) and fractional anisotropy (FA). The 3D ellipsoid is characterized with three eigenvectors that define the axes and with three associated eigenvalues (λ) that define the lengths.
Figure 10
Figure 10
Example of Q-ball imaging (QBI). (A) QBI type DTI with color anisotropy map full field of view. (B) Zoomed in region from the white rectangle in (A) with probability distributions in each voxel superimposed on a grayscale FA map. QBI acquisition parameters: 112 × 112 matrix; 22.4 × 22.4 cm field-of-view; 70 axial slices of 2 mm thickness; 6 b.0 images; 60 gradient directions at b.2500 s/mm2; SENSE acceleration factor 2; TE/TR.107 ms/10.3 s; and, acquisition time 11 m 20 s.

References

    1. Marr A.L., Coronado V.G. Central Nervous System Injury Surveillance Data Submission Standards—2002. Centers for Disease Control and Prevention, National Center for Injury Prevention and Control; Atlanta, GA, USA: 2004.
    1. Faul M. Traumatic Brain Injury in the United States: Emergency Department Visits, Hospitalizations, and Deaths, 2002–2006. Volume vii. National Center for Injury Prevention and Control (USA); Atlanta, GA, USA: 2010. 70p
    1. Marin J.R., Weaver M.D., Yealy D.M., Mannix R.C. Trends in visits for traumatic brain injury to emergency departments in the United States. Jama. 2014;311:1917–1919. doi: 10.1001/jama.2014.3979. - DOI - PubMed
    1. Centers for Disease Control and Prevention Nonfatal traumatic brain injuries related to sports and recreation activities among persons aged ≤19 years-United States, 2001–2009. MMWR Morb. Mortal. Wkl. Rep. 2011;60:1337–1342. - PubMed
    1. Bass E., Golding H. The Veterans Health Administration’s Treatment of PTSD and Traumatic Brain Injury among Recent Combat Veterans. Volume ix. Congressional Budget Office; Washington, DC, USA: 2012. 39p