

Liquid Chromatography Analysis of Common Nutritional Components, in Feed and Food
- PMID: 30577557
- PMCID: PMC6352167
- DOI: 10.3390/foods8010001
Liquid Chromatography Analysis of Common Nutritional Components, in Feed and Food
Abstract
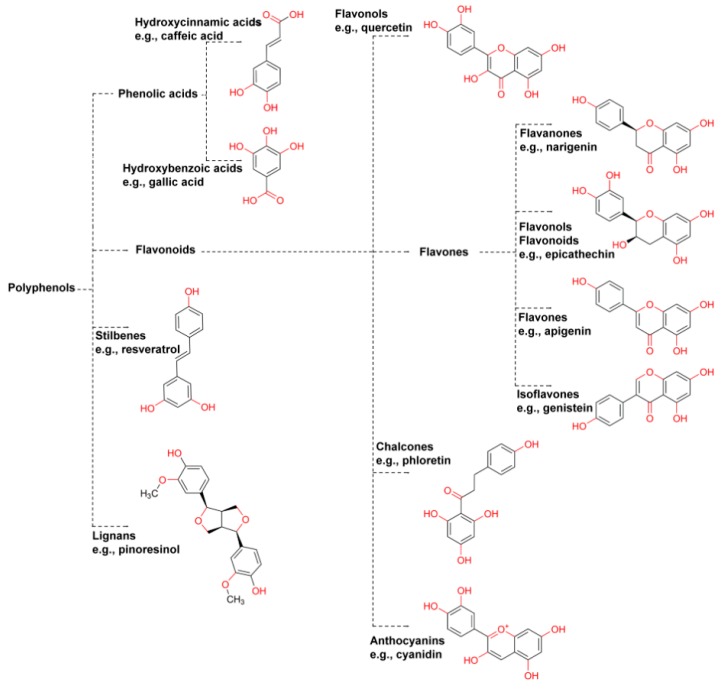
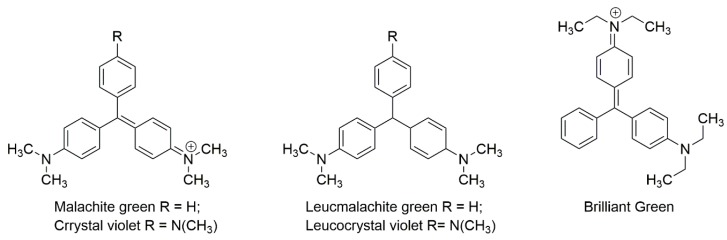
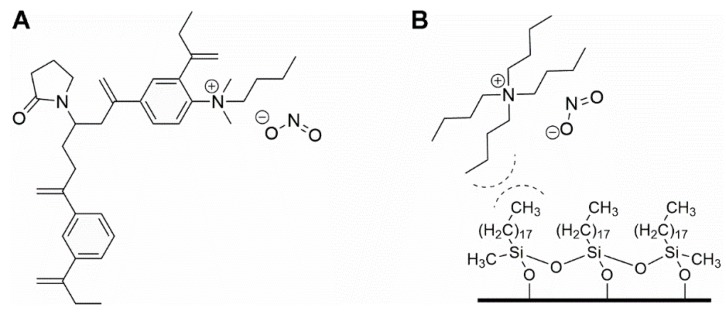
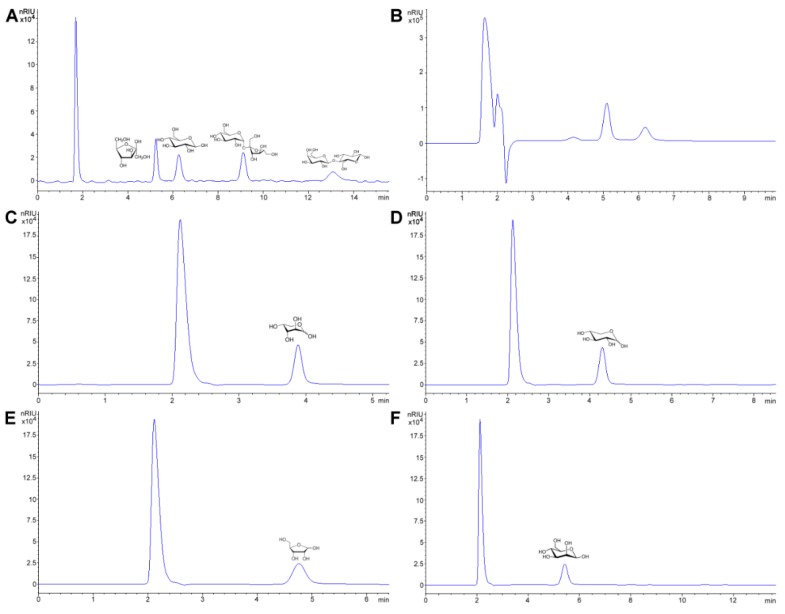
Food and feed laboratories share several similarities when facing the implementation of liquid-chromatographic analysis. Using the experience acquired over the years, through application chemistry in food and feed research, selected analytes of relevance for both areas were discussed. This review focused on the common obstacles and peculiarities that each analyte offers (during the sample treatment or the chromatographic separation) throughout the implementation of said methods. A brief description of the techniques which we considered to be more pertinent, commonly used to assay such analytes is provided, including approaches using commonly available detectors (especially in starter labs) as well as mass detection. This manuscript consists of three sections: feed analysis (as the start of the food chain); food destined for human consumption determinations (the end of the food chain); and finally, assays shared by either matrices or laboratories. Analytes discussed consist of both those considered undesirable substances, contaminants, additives, and those related to nutritional quality. Our review is comprised of the examination of polyphenols, capsaicinoids, theobromine and caffeine, cholesterol, mycotoxins, antibiotics, amino acids, triphenylmethane dyes, nitrates/nitrites, ethanol soluble carbohydrates/sugars, organic acids, carotenoids, hydro and liposoluble vitamins. All analytes are currently assayed in our laboratories.
Keywords: additives; challenges; contaminants; food and feed analysis; liquid chromatography; nutritional analysis.
Conflict of interest statement
The authors declare no conflict of interest.
Figures
Similar articles
-
Safety and nutritional assessment of GM plants and derived food and feed: the role of animal feeding trials.Food Chem Toxicol. 2008 Mar;46 Suppl 1:S2-70. doi: 10.1016/j.fct.2008.02.008. Epub 2008 Feb 13. Food Chem Toxicol. 2008. PMID: 18328408 Review.
-
Validation of a multi-analyte HPLC method for the determination of carotenoids used as feed additives in fish and poultry feed: results of an interlaboratory study.Food Addit Contam Part A Chem Anal Control Expo Risk Assess. 2021 Mar;38(3):396-408. doi: 10.1080/19440049.2020.1869325. Epub 2021 Jan 22. Food Addit Contam Part A Chem Anal Control Expo Risk Assess. 2021. PMID: 33481680
-
Development and validation of a multi-analyte method for the regulatory control of carotenoids used as feed additives in fish and poultry feed.Food Addit Contam Part A Chem Anal Control Expo Risk Assess. 2017 Aug;34(8):1285-1297. doi: 10.1080/19440049.2017.1315651. Epub 2017 Apr 24. Food Addit Contam Part A Chem Anal Control Expo Risk Assess. 2017. PMID: 28425836
-
Development and Validation of a Liquid Chromatography High-Resolution Mass Spectrometry Method for the Simultaneous Determination of Mycotoxins and Phytoestrogens in Plant-Based Fish Feed and Exposed Fish.Toxins (Basel). 2019 Apr 13;11(4):222. doi: 10.3390/toxins11040222. Toxins (Basel). 2019. PMID: 31013949 Free PMC article.
-
Advanced hyphenated chromatographic-mass spectrometry in mycotoxin determination: current status and prospects.Mass Spectrom Rev. 2013 Nov-Dec;32(6):420-52. doi: 10.1002/mas.21377. Epub 2013 Jun 26. Mass Spectrom Rev. 2013. PMID: 23804155 Review.
Cited by
-
Can Natural Products Exert Neuroprotection without Crossing the Blood-Brain Barrier?Int J Mol Sci. 2021 Mar 25;22(7):3356. doi: 10.3390/ijms22073356. Int J Mol Sci. 2021. PMID: 33805947 Free PMC article. Review.
-
Pet Food Quality Assurance and Safety and Quality Assurance Survey within the Costa Rican Pet Food Industry.Animals (Basel). 2019 Nov 15;9(11):980. doi: 10.3390/ani9110980. Animals (Basel). 2019. PMID: 31731812 Free PMC article.
-
A Review of Recent Developments in Analytical Methods for Determination of Phosphorus from Environmental Samples.Molecules. 2025 Feb 21;30(5):1001. doi: 10.3390/molecules30051001. Molecules. 2025. PMID: 40076225 Free PMC article. Review.
-
Comparative nutritional analysis and sensory evaluation of three baby foods with low allergen ingredients for infants.Food Chem X. 2025 May 7;28:102533. doi: 10.1016/j.fochx.2025.102533. eCollection 2025 May. Food Chem X. 2025. PMID: 40475820 Free PMC article.
-
Geographical Origin Authentication of Agri-Food Products: Α Review.Foods. 2020 Apr 13;9(4):489. doi: 10.3390/foods9040489. Foods. 2020. PMID: 32295019 Free PMC article. Review.
References
-
- Keding G.B., Schneider K., Jordan I. Production and processing of foods as core aspects of nutrition-sensitive agriculture and sustainable diets. Food Secur. 2013;5:825–846. doi: 10.1007/s12571-013-0312-6. - DOI
-
- Canady R., Lane R., Paoli G., Wilson M., Bialk H., Hermansky S., Kobielush B., Li J.-E., Llewellyn C., Scimeca J. Determining the applicability of threshold of toxicological concern approaches to substances found in foods. Crit. Rev. Food Sci. Nutr. 2013;53:1239–1249. doi: 10.1080/10408398.2012.752341. - DOI - PMC - PubMed
-
- Van der Fels-Klerx H.J., Adamse P., de Jong J., Hoogenboom R., de Nijs M., Bikker P. A model for risk-based monitoring of contaminants in feed ingredients. Food Control. 2017;72:211–218. doi: 10.1016/j.foodcont.2016.05.007. - DOI
Publication types
LinkOut - more resources
Full Text Sources
