. 2019 Jul:25:101060.
doi: 10.1016/j.redox.2018.11.018. Epub 2018 Nov 29.

Gene expression analysis of heat-shock proteins and redox regulators reveals combinatorial prognostic markers in carcinomas of the gastrointestinal tract

Affiliations

Gene expression analysis of heat-shock proteins and redox regulators reveals combinatorial prognostic markers in carcinomas of the gastrointestinal tract

Sebastian Öther-Gee Pohl et al. Redox Biol. 2019 Jul.

Abstract

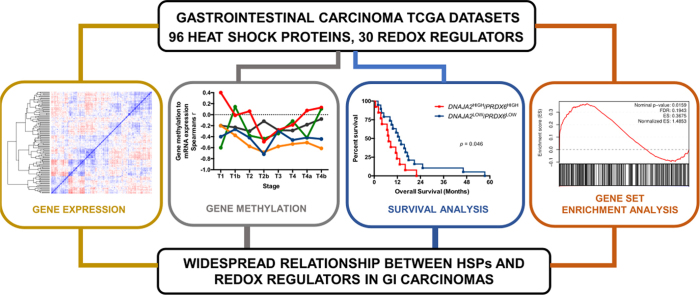
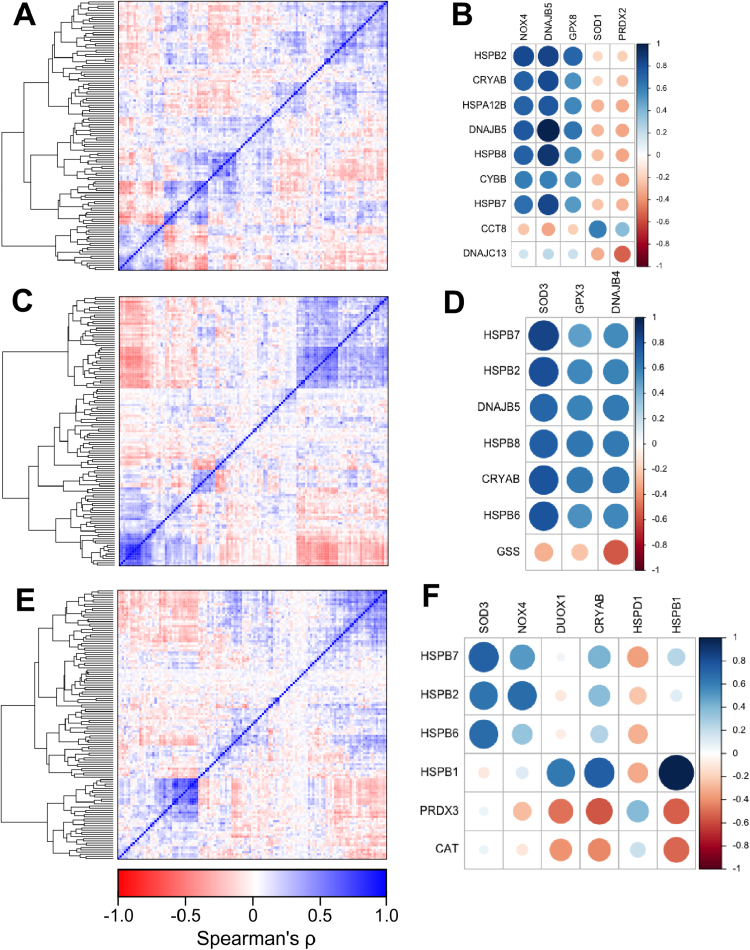
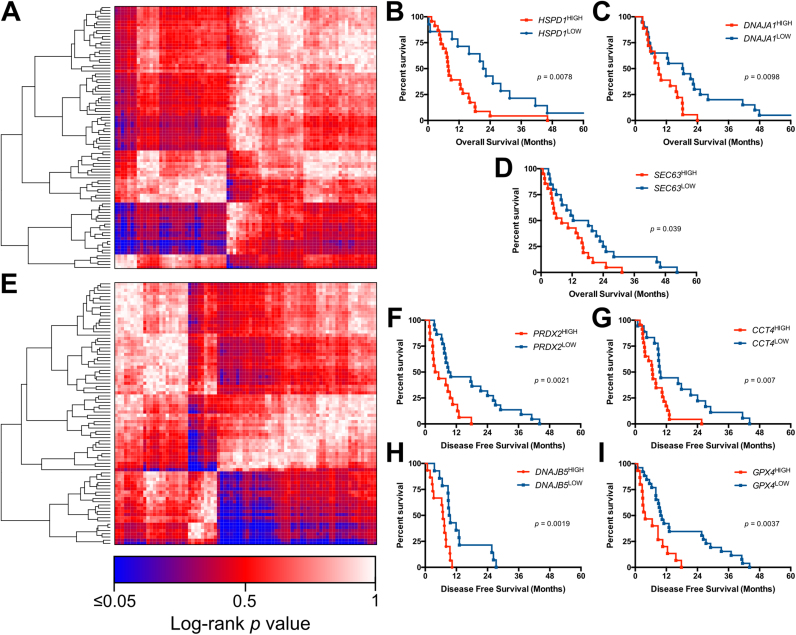
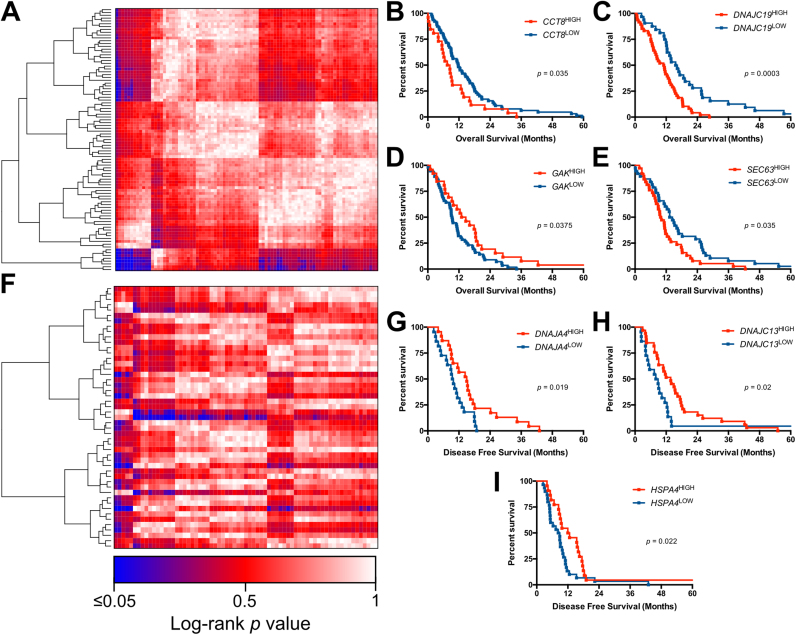
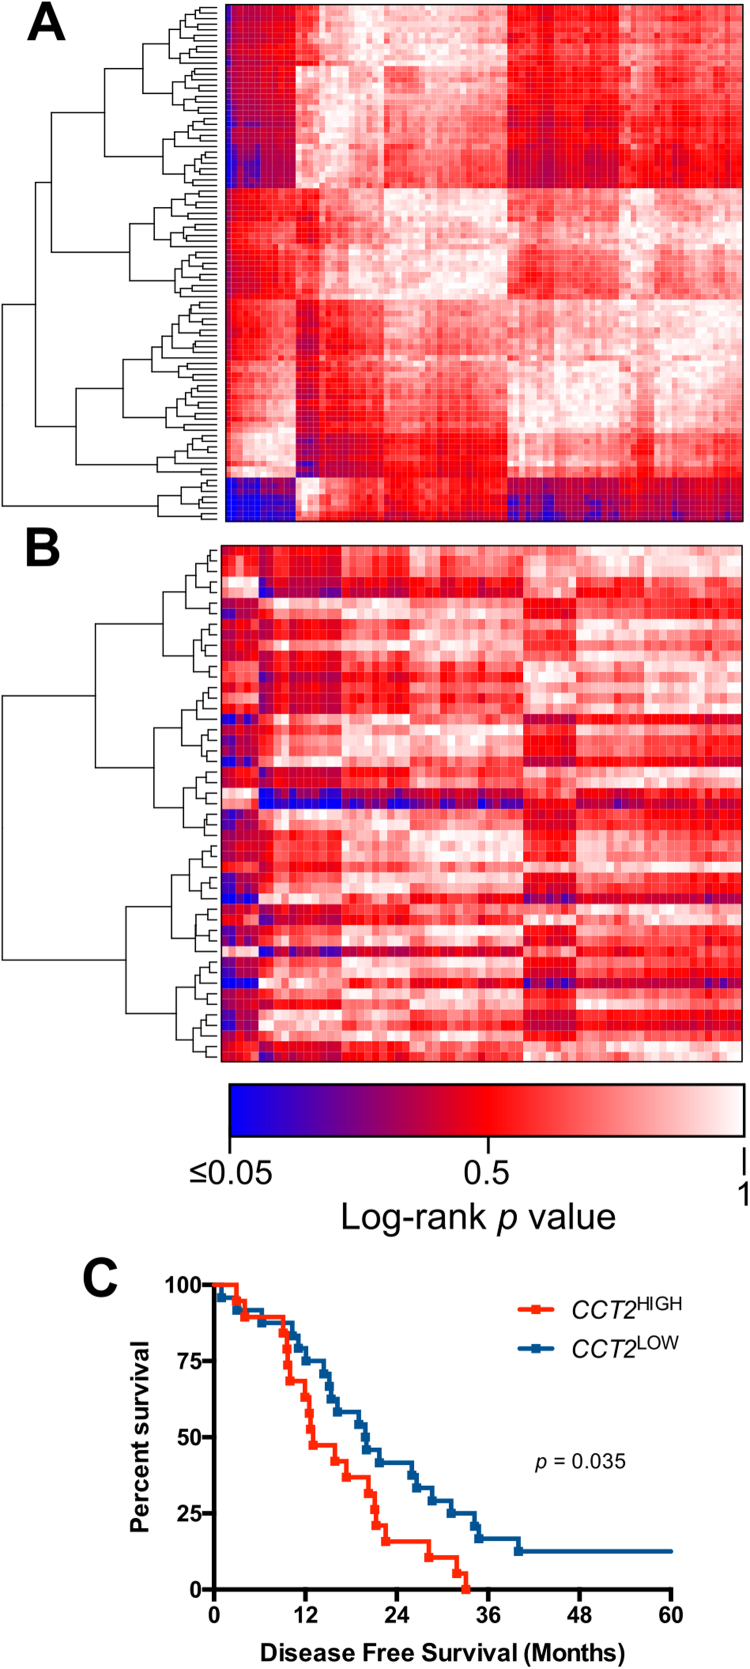
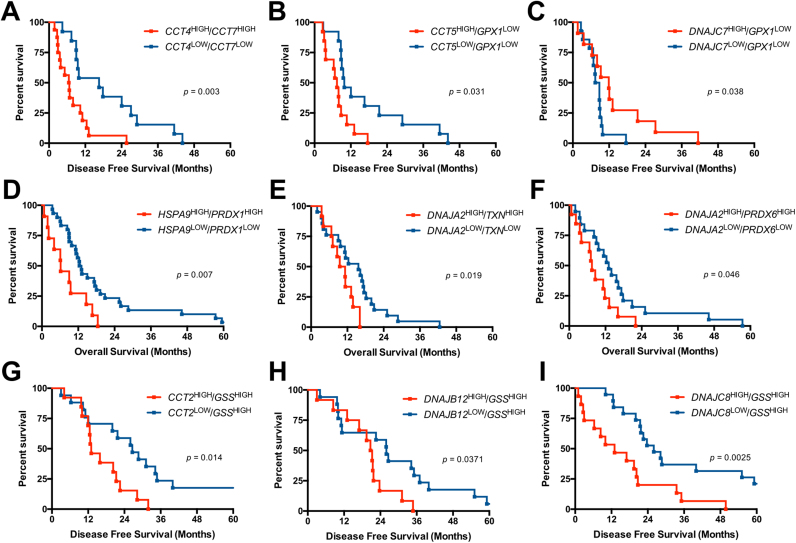
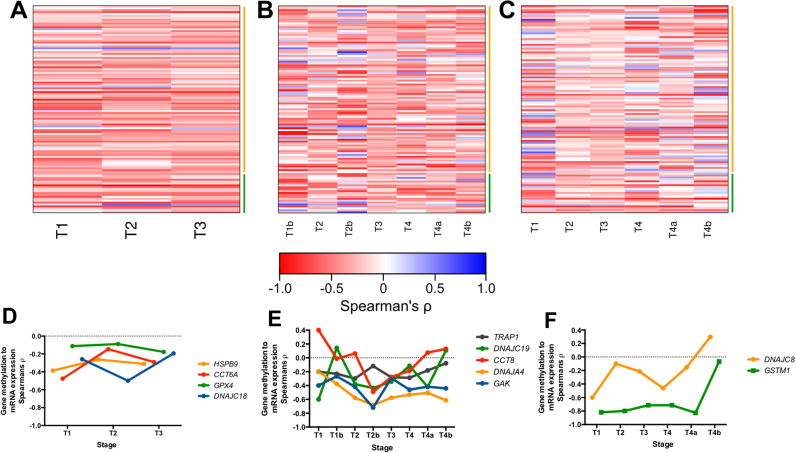
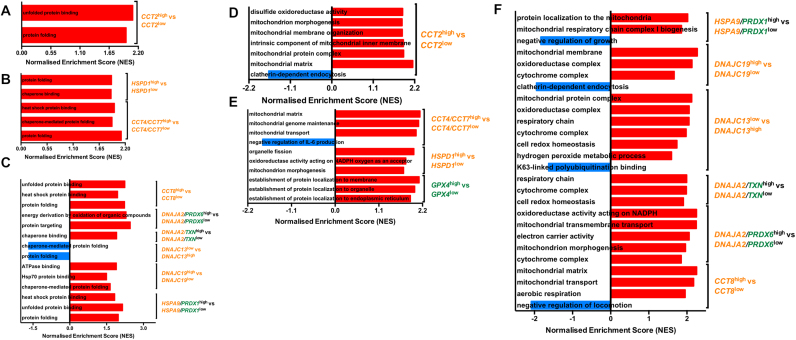
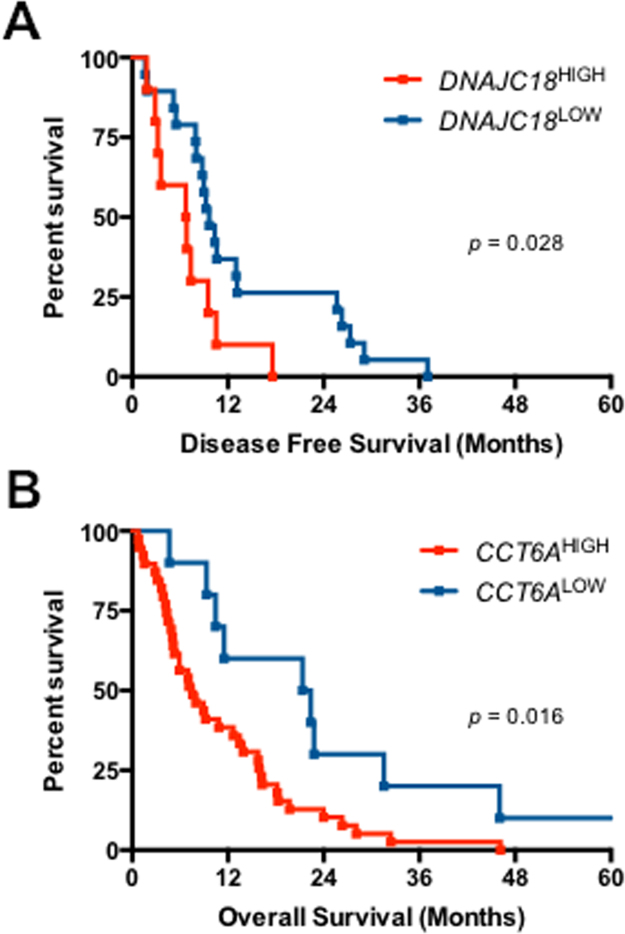
Heat shock proteins (HSPs) are a large family of ubiquitously expressed proteins with diverse functions, including protein assembly and folding/unfolding. These proteins have been associated with the progression of various gastrointestinal tumours. Dysregulation of cellular redox has also been associated with gastrointestinal carcinogenesis, however, a link between HSPs and dysregulation of cellular redox in carcinogenesis remains unclear. In this study, we analysed mRNA co-expression and methylation patterns, as well as performed survival analysis and gene set enrichment analysis, on gastrointestinal cancer data sets (oesophageal, stomach and colorectal carcinomas) to determine whether HSP activity and cellular redox dysregulation are linked. A widespread relationship between HSPs and cellular redox was identified, with specific combinatorial co-expression patterns demonstrated to significantly alter patient survival outcomes. This comprehensive analysis provides the foundation for future studies aimed at deciphering the mechanisms of cooperativity between HSPs and redox regulatory enzymes, which may be a target for future therapeutic intervention for gastrointestinal tumours.

Keywords: Gastrointestinal carcinomas; Gene expression analysis; Heat shock proteins (HSPs); Redox regulators.


Figures

fx1
Graphical abstract
Fig. 1
Fig. 1
Co-expression analysis of HSPs and redox regulators in gastrointestinal tumours. Heatmaps of Spearman's rank correlation coefficient (ρ) for all HSP and redox genes (A, C,E) and selected gene combinations (B, D,F) in the following TCGA datasets: colorectal carcinoma (A, B), stomach adenocarcinoma (C, D), oesophageal carcinoma (E, F). In all panels, blue indicates negative ρ, red indicates positive ρ. In panels B, D and F, circle size indicates magnitude of ρ.
Fig. 2
Fig. 2
Single gene survival analysis of HSPs and redox regulators in oesophageal carcinoma. A) Heatmap of log-rank p-values for overall survival differences of HSPs and redox regulators in oesophageal carcinoma. Blue indicates significant (p < 0.05) survival differences, Red indicates non-significant (p > 0.05) survival differences. Overall survival analysis for B) HSPD1high vs HSPD1low C) DNAJA1high vs DNAJA1low D) SEC63high vs SEC63low. E) Heatmap of log-rank p-values for disease-free survival differences of HSPs and redox regulators in oesophageal carcinoma. Overall disease-free survival analysis for F) PRDX2high vs PRDX2low G) CCT4high vs CCT4low H) DNAJB5high vs DNAJB5low I) GPX4high vs GPX4low.
Fig. 3
Fig. 3
Single gene survival analysis of HSPs and redox regulators in stomach adenocarcinoma. A) Heatmap of log-rank p-values for overall survival differences of HSPs and redox regulators in stomach adenocarcinoma. Blue indicates significant (p < 0.05) survival differences, Red indicates non-significant (p > 0.05) survival differences. Overall survival analysis for B) CCT8high vs CCT8low C) DNAJC19high vs DNAJAC19low D) GAKhigh vs GAKlow E) SEC63high vs SEC63low. F) Heatmap of log-rank p-values for disease-free survival differences of HSPs and redox regulators in stomach adenocarcinoma. Disease-free survival analysis for G) DNAJA4high vs DNAJA4low H) DNAJC13high vs DNAJC13low I) HSPA4high vs HSPA4low
Fig. 4
Fig. 4
Single gene survival analysis of HSPs and redox regulators in colorectal carcinoma. A) Heatmap of log-rank p-values for overall survival differences of HSPs and redox regulators in colorectal carcinoma. B) Heatmap of log-rank p-values for disease-free survival differences of HSPs and redox regulators in colorectal carcinoma. Blue indicates significant (p < 0.05) survival differences, Red indicates non-significant (p > 0.05) survival differences. C) Disease-free survival analysis for CCT2high vs CCT2low.
Fig. 5
Fig. 5
Combinatorial gene survival analysis of HSPs and redox regulators in gastrointestinal cancers. Disease-free survival analysis for A) CCT4/CCT7high vs CCT4/CCT7low, B) CCT5/GPX1high vs CCT5/GPX1low C) DNAJC7/GPX1high vs DNAJC7/GPX1low in oesophageal carcinoma dataset. Overall survival analysis for D) HSPA9/PRDX1high vs HSPA9/PRDX1low E) DNAJA2/TXNhigh vs DNAJA2/TXNlow and F) DNAJA2/PRDX6high vs DNAJA2/PRDX6low in stomach adenocarcinoma dataset. Disease-free survival analysis for G) CCT2high/GSShigh vs CCT2low/GSSlow H) DNAJB12high/GSShigh vs DNAJB12low/GSSlow I) DNAJC8high/GSShigh vs DNAJC8low/GSSlow in colorectal carcinoma dataset.
Fig. 6
Fig. 6
Correlation of methylation and gene expression of HSPs and redox regulators in gastrointestinal cancers. Heatmap of Spearman's rank correlation coefficient (ρ) for TCGA datasets of A) oesophageal carcinoma B) stomach adenocarcinoma and C) colorectal carcinoma for various tumour stages (T1-T4b). Blue indicates negative Spearman's coefficient, Red indicates positive Spearman's coefficient. Green line indicates redox regulator genes, yellow line indicates HSP genes. D) Line graph plotting gene methylation to mRNA expression through tumour stages T1-T3 of HSPB9, CCT6A, GPX4 and DNAJC18 for oesophageal carcinoma dataset. E) Line graph plotting gene methylation to mRNA expression through tumour stages T1-T4b of TRAP1, DNAJC19, CCT8, DNAJA4 and GAK for stomach adenocarcinoma dataset. F) Line graph plotting gene methylation to mRNA expression through tumour stages T1-T4b of DNAJC8, and GSTM1 for colorectal carcinoma dataset.
Fig. 7
Fig. 7
Gene set enrichment analysis (GSEA) of HSPs and redox regulators in gastrointestinal cancers. Bar graphs of normalised enrichment scores (NES) from GSEA of various HSPhigh vs HSPlow phenotypes in A) colorectal carcinoma B) oesophageal adenocarcinoma and C) stomach adenocarcinoma for validation of HSP related processes. Bar graphs of normalised enrichment scores (NES) from GSEA of various redox regulatorshigh/low/HSPhigh/low vs redox regulatorshigh/low/HSPlow/high phenotypes in D) colorectal carcinoma E) oesophageal carcinoma and F) stomach adenocarcinoma. Heat shock protein genes indicated by yellow writing, redox regulators indicated by green writing.
Fig. S4
Fig. S4
A) Disease-free survival analysis for DNAJC18high vs DNAJC18low patients in the esophageal carcinoma dataset. B) Overall survival analysis for CCT6Ahigh vs CCT6Alow patients in the oesophageal carcinoma dataset.

References

    1. Whitley D., Goldberg S.P., Jordan W.D. Heat shock proteins: a review of the molecular chaperones. J. Vasc. Surg. 1999;29:748–751. - PubMed
    1. Li Z., Srivastava P. Heat-shock proteins. Curr. Protoc. Immunol. 2004 (Appendix 1, Appendix 1T) - PubMed
    1. Romanucci M., Bastow T., Della Salda L. Heat shock proteins in animal neoplasms and human tumours--a comparison. Cell Stress Chaperon. 2008;13:253–262. - PMC - PubMed
    1. Calderwood S.K., Gong J. Heat shock proteins promote cancer: it's a protection racket. Trends Biochem. Sci. 2016;41:311–323. - PMC - PubMed
    1. Lianos G.D. The role of heat shock proteins in cancer. Cancer Lett. 2015;360:114–118. - PubMed

Publication types

LinkOut - more resources