. 2019 Jan 8;116(2):631-640.
doi: 10.1073/pnas.1808834116. Epub 2018 Dec 21.

Inhibition of de novo lipogenesis targets androgen receptor signaling in castration-resistant prostate cancer

Affiliations

Inhibition of de novo lipogenesis targets androgen receptor signaling in castration-resistant prostate cancer

Giorgia Zadra et al. Proc Natl Acad Sci U S A. .

Erratum in

Abstract

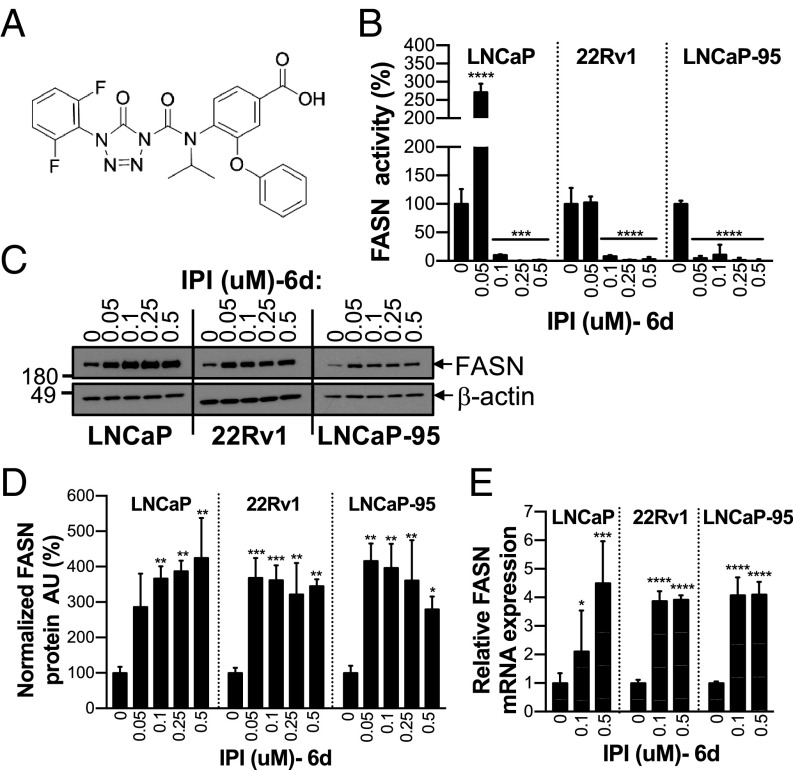
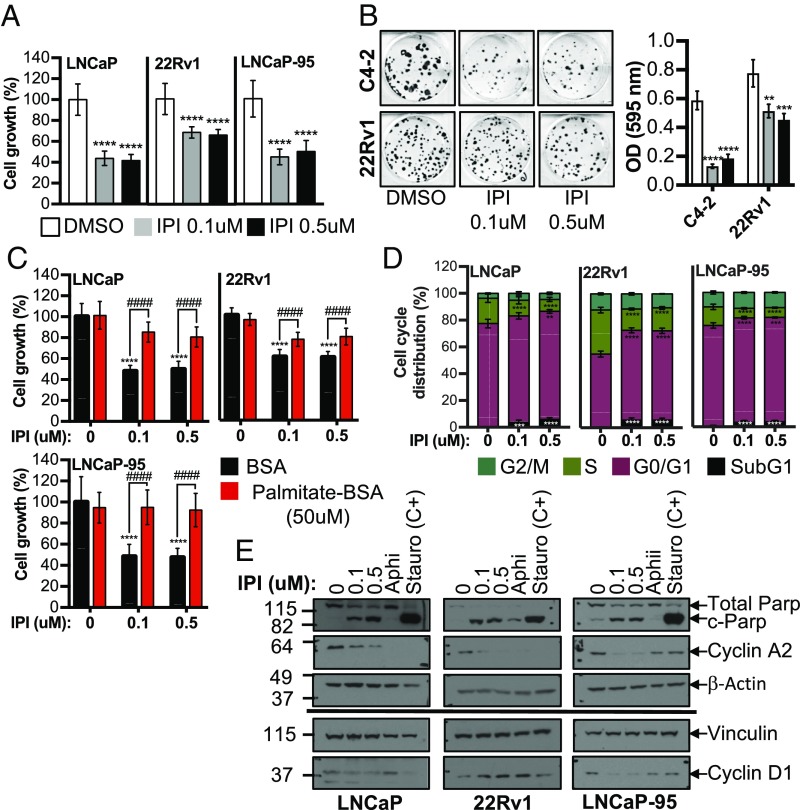
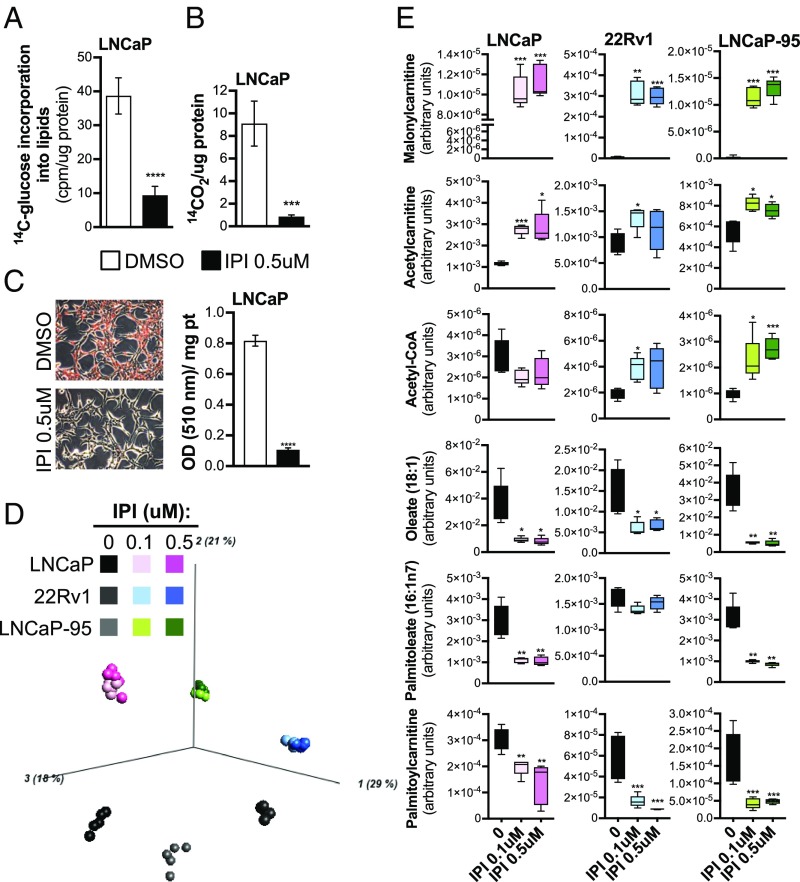
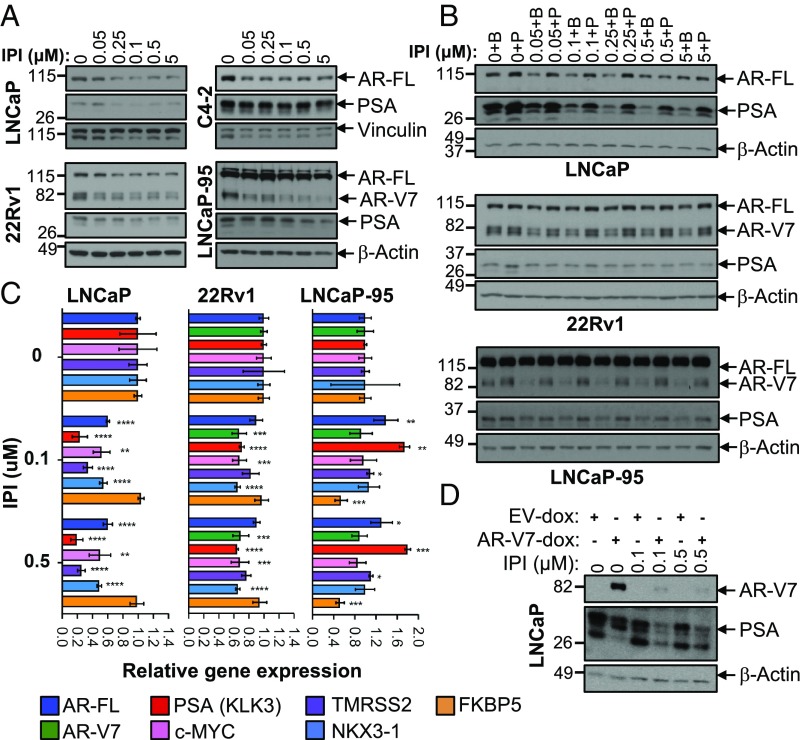
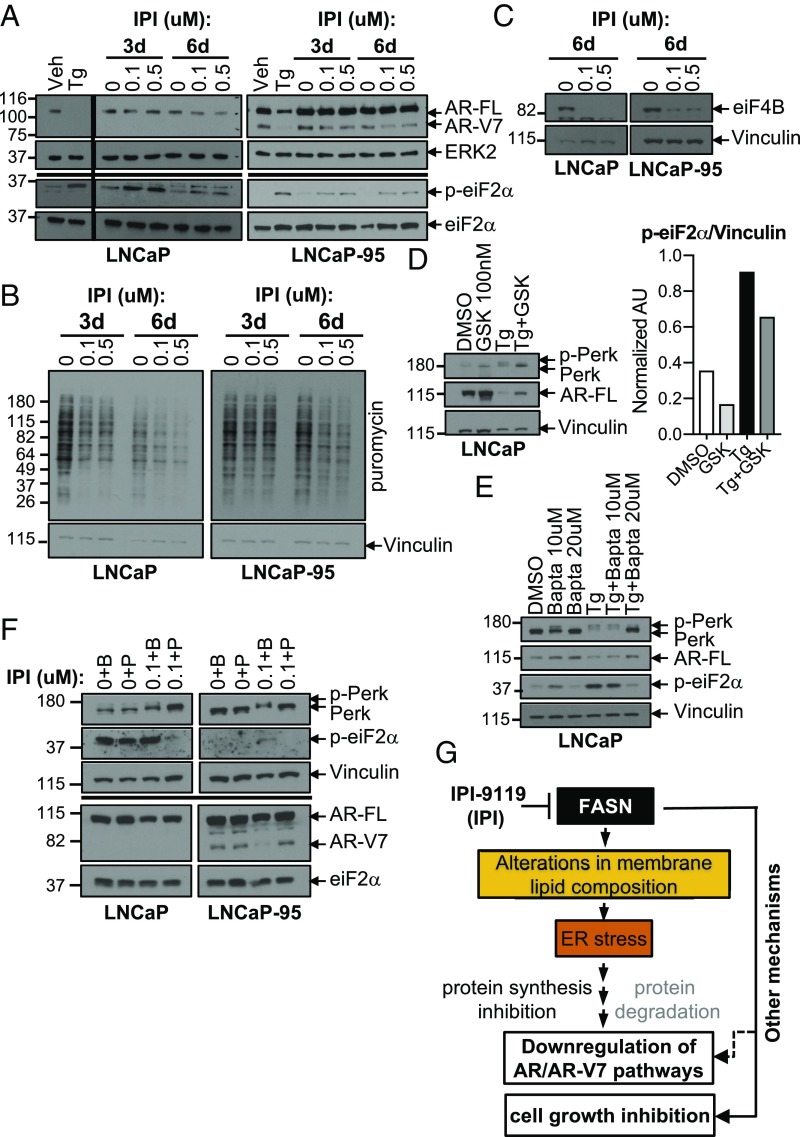
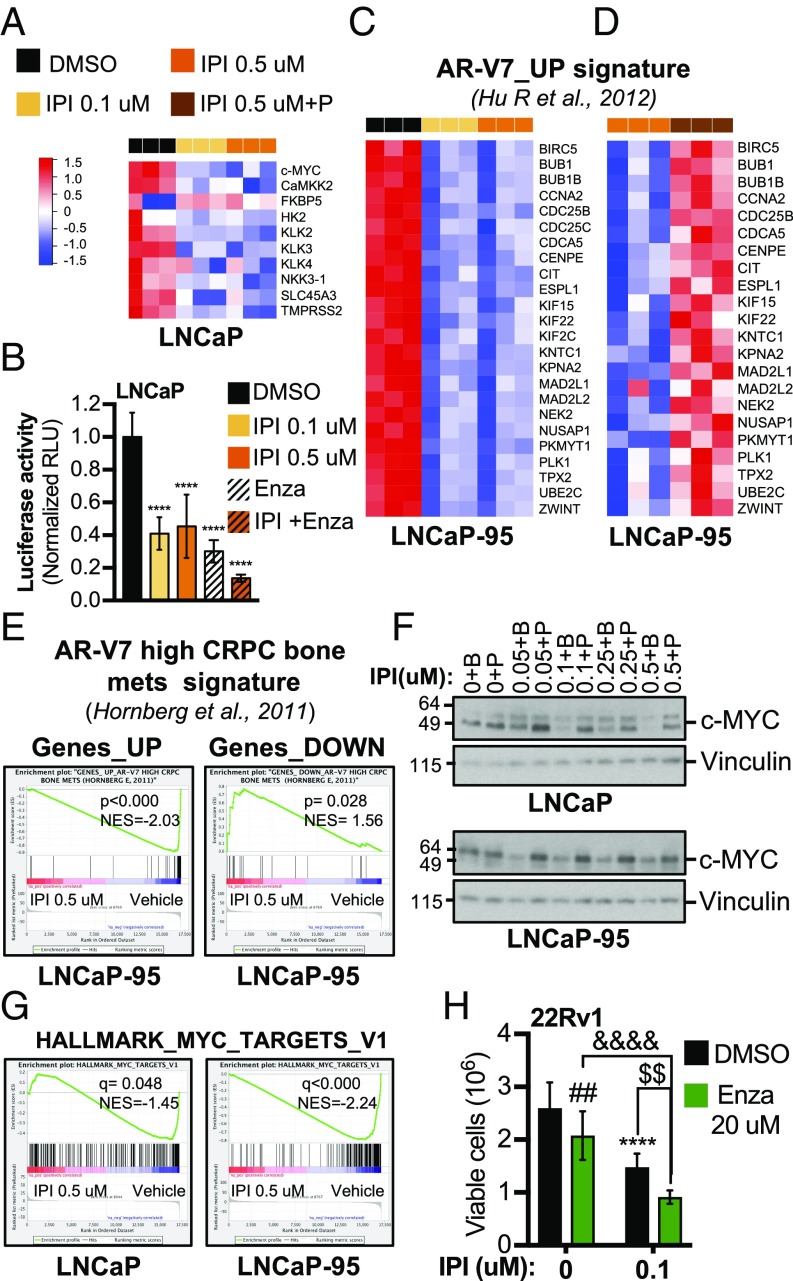
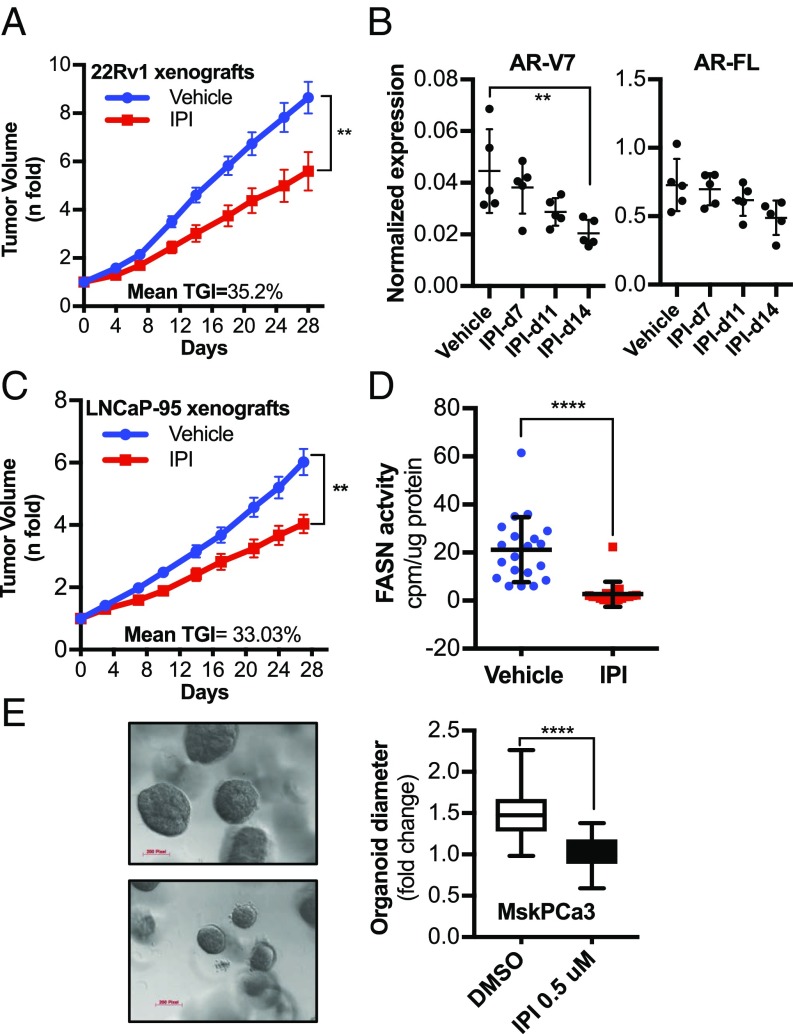
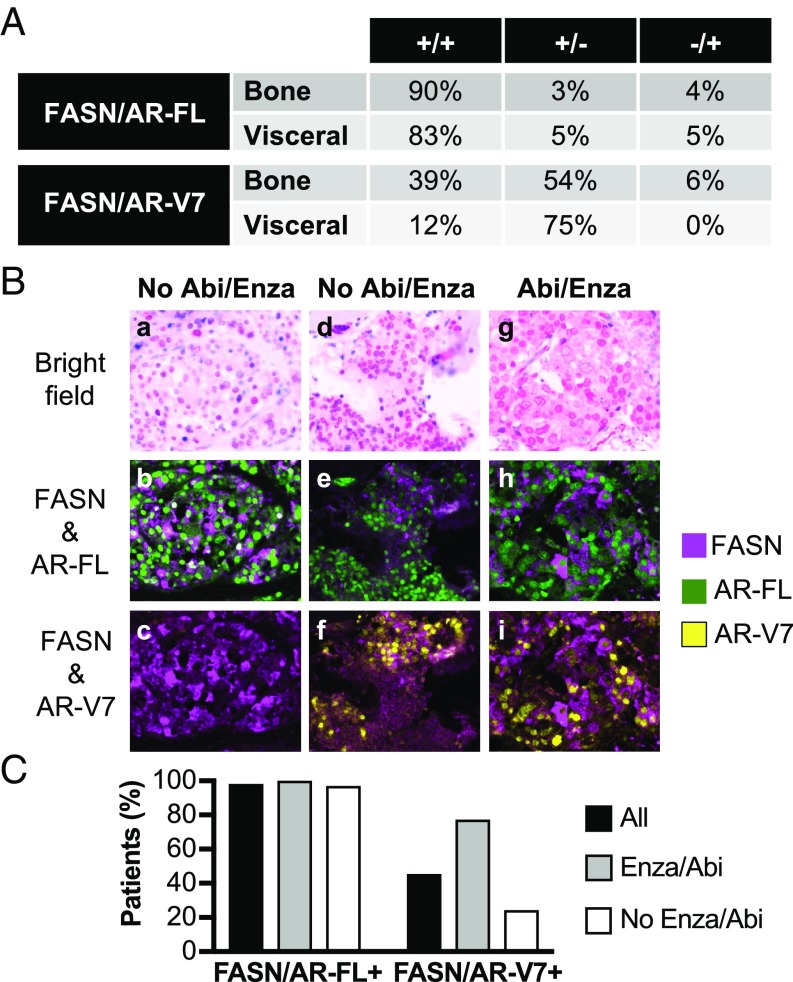
A hallmark of prostate cancer progression is dysregulation of lipid metabolism via overexpression of fatty acid synthase (FASN), a key enzyme in de novo fatty acid synthesis. Metastatic castration-resistant prostate cancer (mCRPC) develops resistance to inhibitors of androgen receptor (AR) signaling through a variety of mechanisms, including the emergence of the constitutively active AR variant V7 (AR-V7). Here, we developed an FASN inhibitor (IPI-9119) and demonstrated that selective FASN inhibition antagonizes CRPC growth through metabolic reprogramming and results in reduced protein expression and transcriptional activity of both full-length AR (AR-FL) and AR-V7. Activation of the reticulum endoplasmic stress response resulting in reduced protein synthesis was involved in IPI-9119-mediated inhibition of the AR pathway. In vivo, IPI-9119 reduced growth of AR-V7-driven CRPC xenografts and human mCRPC-derived organoids and enhanced the efficacy of enzalutamide in CRPC cells. In human mCRPC, both FASN and AR-FL were detected in 87% of metastases. AR-V7 was found in 39% of bone metastases and consistently coexpressed with FASN. In patients treated with enzalutamide and/or abiraterone FASN/AR-V7 double-positive metastases were found in 77% of cases. These findings provide a compelling rationale for the use of FASN inhibitors in mCRPCs, including those overexpressing AR-V7.

Keywords: AR-V7; androgen signaling; fatty acid synthase; metabolomics; metastatic prostate cancer.


Conflict of interest statement

Conflict of interest statement: A patent relative to the findings described in this study has been filed from the Dana-Farber Cancer Institute (52095-584P01US). J.T., A.C., K.M., V.J.P., J.A. and S.P. were former employees of Infinity Pharmaceuticals. J.L.K. is a current employee of Infinity Pharmaceuticals.

Figures

Fig. 1.
Fig. 1.
IPI-9119 is a potent and selective FASN inhibitor. (A) Chemical structure of IPI-9119 (IPI). (B) FASN activity in AD (LNCaP) and AI (22Rv1, LNCaP-95) cells, following 6-d (6d) treatment with IPI at the indicated concentrations. Data are expressed as the mean activity ± SD (n = 3) and plotted as percent DMSO. ****P < 0.0001, ***P < 0.001, one-way ANOVA followed by Tukey’s post hoc test. (C) Representative immunoblotting of FASN expression under IPI treatment. (D) Densitometric analysis. Data are expressed as normalized (FASN/β-actin) arbitrary units (AU) ± SD (n = 3) and plotted as percent DMSO. ***P < 0.001, **P < 0.01, *P < 0.05, one-way ANOVA, followed by Tukey’s post hoc test. (E) FASN mRNA levels measured by real-time qPCR. Data were normalized using β-actin as housekeeping and expressed as n-fold DMSO ± SD (n = 3 per concentration). *P < 0.05, ***P < 0.001, ****P < 0.0001, one-way ANOVA followed by Tukey’s post hoc test.
Fig. 2.
Fig. 2.
IPI-9119 inhibits PCa cell growth and induces cell cycle arrest and apoptosis. (A) Measurement of cell growth after 6-d treatment with IPI-9119 (IPI). Data are expressed as the mean number of viable cells ± SD (n per concentration = 24 for LNCaP; 15 for 22Rv1; 12 for LNCaP-95) and plotted as percent DMSO. ****P < 0.0001, one-way ANOVA followed by Tukey’s post hoc test. (B) Clonogenic assay, following 3-wk treatment with IPI or DMSO. Representative images of colony formation (Left) and quantification (Right). Data are expressed as the mean OD ± SD (n = 3). **P < 0.01, ***P < 0.001, ****P < 0.0001, one-way ANOVA followed by Tukey’s post hoc test. (C) Cell growth rescue by exogenous palmitate. Data are expressed as the mean growth ± SD (n per concentration = 9) and plotted as percent DMSO. ****P < 0.0001 IPI vs. DMSO, ####P < 0.0001 IPI + palmitate vs. IPI, two-way ANOVA followed by Sidak’s post hoc test. (D) Flow cytometry using propidium iodide (PI) and bromodeoxyuridine (BrDU), following IPI treatment (6 d). Data are expressed as the mean percent ± SD (n = 6). **P < 0.01, ***P < 0.001, ****P < 0.0001, two-way ANOVA followed by Sidak’s post hoc test. (E) Representative immunoblotting of cell cycle and apoptosis markers. Experiment was repeated twice. The S-phase inhibitor aphidicolin (Aphi, 0.3 μg/mL, 3 h) and the apoptosis inducer staurosporine (Stauro, 1 μM for 24 h) were used as positive controls. n = number of independent samples.
Fig. 3.
Fig. 3.
IPI-9119 induces a profound metabolic reprogramming in PCa cells. (A) Incorporation of [14C]glucose into lipids, following treatment with IPI-9119 (IPI). Results are expressed as counts per minute (cpm), normalized to protein content. Mean values ± SD are shown (n = 6); ****P < 0.0001, Student t test. (B) Fatty acid oxidation measured by 14C-CO2 release. Results are expressed as cpm normalized to protein content. Data are expressed as the mean ± SD (n = 4), normalized to protein content; ***P < 0.001, Student t test. (C) Neutral lipids accumulation in lipid droplets. Representative images (magnification: 100×) of Oil Red O staining. Quantification of neutral lipids accumulation is shown next to the images. Data are expressed as the mean absorbance ± SD (n = 3); ****P < 0.0001, Student t test. (D) Principal component analysis of the PCa cell lines analyzed (n = 6 per condition). (E) Box plots showing the levels of key metabolites involved in lipid metabolism from metabolomics data, (n = 6 per condition). ***q < 0.001, **q < 0.01, *q < 0.05, Student t test. n = number of independent samples.
Fig. 4.
Fig. 4.
IPI-9119 inhibits AR-FL and AR-V7 protein expression. (A) Representative immunoblotting showing the reduction of AR-FL and AR-V7 in AD and AI cells. Experiment was repeated three times. (B) Representative immunoblotting showing palmitate-mediated rescue of AR-FL and AR-V7 inhibition. Palmitate (50 μM) was complexed with BSA (molar ratio 6:1), while control cells were treated with BSA only. Experiment was repeated three times. (C) Real-time qPCR of AR-FL/AR-V7 and AR-target genes. Data are plotted as the mean of three independent samples per condition and expressed as fold of DMSO (set as 1) ± SD. (D) Representative immunoblotting showing IPI-mediated ectopic inhibition of AR-V7 in negative LNCaP cells using a doxycycline-inducible AR-V7 construct. Experiment was repeated three times, using independent infections.
Fig. 5.
Fig. 5.
IPI-9119 induces ER stress response and protein translation inhibition. (A) Immunoblotting showing the induction of the ER stress marker p-eiF2α in LNCaP and LNCaP-95 cells treated with IPI-9119 (IPI) for 3 and 6 d. (B) SUnSET assay using lysates from LNCaP and LNCaP-95 cells treated with IPI for 3 and 6 d. (C) Representative immunoblotting showing the down-regulation of translation initiaton cofactor eiF4B, following treatment with IPI for 6 d. Experiment was repeated twice (LNCaP) and four times (LNCaP-95). (D) Immunoblotting showing the rescue of AR expression in LNCaP, following reduction of ER stress using the PERK inhibitor GSK2606414 (100 nM, 24 h; 1-h pretreatment). Phosphorylation of PERK is shown as an upward shift of the protein molecular weight. (E) Immunoblotting showing the rescue of AR expression in LNCaP, following reduction of ER stress using the Ca2+ chelant bapta (10, 20 μM, 12 h; 1-h pretreatment). Next to the immunoblotting, densitometric analysis of p-eiF2a is shown. Values are reported as normalized arbitrary units (AU). (F) Representative immunoblotting showing concomitant rescue of IPI-mediated AR/AR-V7 reduction and ER stress, following incubation with palmitate for 3 d. Palmitate (50 μM) was complexed with BSA (molar ratio 6:1), while control cells were treated with BSA only. (G) Schematic representation of the involvement of ER stress in mediating IPI effects.
Fig. 6.
Fig. 6.
IPI-9119 inhibits AR transcriptional activity and enhances Enza efficacy. (A) Heat map of canonical AR target genes, following treatment with IPI-9119 (IPI) or DMSO for 6 d. Normalized counts (n = 3) are shown. (B) Luciferase activity in LNCaP cells treated with IPI for 6 d. ****P < 0.0001, one-way ANOVA, followed by Tukey’s post hoc test. Data represent mean ± SD (n = 3). (C) Heat map of RNA-seq data showing IPI-mediated abrogation of the AR-V7_UP gene signature after 6 d of treatment. Normalized counts are shown (n = 3). (D) Heat map of TaqMan Array Microfluidic Cards data showing palmitate rescue of the AR-V7_UP gene signature. Results are expressed as fold change of DMSO treatment. Normalized values are shown (n = 3). (E) Preranked GSEA analysis showing IPI-mediated reversion of a gene signature associated with CRPC bone metastases expressing high levels of AR-V7; P values are indicated. (F) Representative immunoblotting showing the reduction of c-MYC protein expression under treatment with IPI for 6 d. Coincubation with palmitate restored c-MYC expression. Palmitate (50 μM) was complexed with BSA (molar ratio 6:1), while control cells were treated with BSA only. (G) Preranked GSEA analysis showing IPI-mediated negative modulation of MYC_TARGETs_V1 signature (Hallmarks; h.all.v5.2s symbols.gmt); FDR values are indicated. (H) Cell growth after 6 d of Enza and IPI cotreatment. ****P < 0.0001 IPI vs. DMSO, ##P < 0.01 Enza vs. DMSO, $$P < 0.01 IPI+Enza vs. IPI, &&&&P < 0.01 IPI+Enza vs. Enza, two-way ANOVA followed by Sidak’s post hoc test. n = number of independent samples.
Fig. 7.
Fig. 7.
IPI-9119 inhibits tumor growth of CRPC xenografts and human mCRPC-derived organoids. (A) Average tumor volume of 22Rv1 xenografts during 28-d treatment with IPI-9119 (IPI) using the ALZET s.c. pump infusion (n = 12 vehicle, n = 11 IPI-9119). Results are expressed as n-fold the mean initial volume (equal to 1) ± SEM. (**P = 0.0056, end of treatment, Mann–Whitney nonparametric test). (B) Densitometric analysis of AR-FL and AR-V7 protein expression in xenograft homogenates at the time points analyzed (**P = 0.0091, ANOVA test, followed by Tukey’s post hoc test). (C) Average tumor volume of LNCaP-95 xenografts (n = 20 vehicle, n = 17 IPI) treated as in A. Results are expressed as n-fold the mean initial volume (equal to 1) ± SEM (**P = 0.0016, end of treatment, Mann–Whitney nonparametric test). (D) Measurement of FASN activity in LNCaP-95 xenografts homogenates collected at the end of treatment. Results are expressed as counts per minute normalized to protein content ± SD (n = 20 vehicle, n = 17 IPI), ****P < 0.0001, Mann–Whitney nonparametric test. (E) Representative image of MSK-PCa3 organoids treated with IPI or DMSO for 25 d (Left). Statistical analysis of the organoid sizes (Right). Diameters of organoids treated with IPI were compared with DMSO (n = 78 DMSO-treated, n = 95 IPI-treated), ****P < 0.0001, Student t test. Pixel magnification is indicated. (Scale bars, 200 pixels.)
Fig. 8.
Fig. 8.
FASN is coexpressed with AR-FL and AR-V7 in human mCRPCs. (A) Status of FASN, AR-FL, and AR-V7 in metastatic sites. Data are expressed as a percentage of either osseous or visceral metastases. (B) Representative images of FASN coexpression with AR-FL and AR-V7 (20×) in bone metastases: Bright field (a), FASN/AR-FL staining (b), FASN/AR-V7 staining in AR-V7–negative bone metastasis from a mCRPC Enza/Abi-naïve patient (c); bright field (d), FASN/AR-FL staining (e), FASN/AR-V7 staining in AR-V7–positive bone metastasis from a mCRPC Enza/Abi-naïve patient (f); bright field (g), FASN/AR-FL staining (h), FASN/AR-V7 staining in AR-V7-positive bone metastasis from a mCRPC Enza/Abi-treated patient (i). (C) Bar graph showing the percentage of patients with FASN/AR-FL and FASN/AR-V7 coexpression in all mCRPC patients analyzed or in the subset treated with Enza/Abi.

Comment in

References

    1. de Bono JS, et al. COU-AA-301 Investigators Abiraterone and increased survival in metastatic prostate cancer. N Engl J Med. 2011;364:1995–2005. - PMC - PubMed
    1. Scher HI, et al. AFFIRM Investigators Increased survival with enzalutamide in prostate cancer after chemotherapy. N Engl J Med. 2012;367:1187–1197. - PubMed
    1. Beer TMAA, et al. PREVAIL Investigators Enzalutamide in metastatic prostate cancer before chemotherapy. N Engl J Med. 2014;371:424–433. - PMC - PubMed
    1. Paller CJ, Antonarakis ES. Management of biochemically recurrent prostate cancer after local therapy: Evolving standards of care and new directions. Clin Adv Hematol Oncol. 2013;11:14–23. - PMC - PubMed
    1. Ryan CJ, Tindall DJ. Androgen receptor rediscovered: The new biology and targeting the androgen receptor therapeutically. J Clin Oncol. 2011;29:3651–3658. - PubMed

Publication types

MeSH terms