. 2019 Feb 4;151(2):247-257.
doi: 10.1085/jgp.201812221. Epub 2018 Dec 21.

Epilepsy-associated mutations in the voltage sensor of KCNQ3 affect voltage dependence of channel opening

Affiliations

Epilepsy-associated mutations in the voltage sensor of KCNQ3 affect voltage dependence of channel opening

Rene Barro-Soria. J Gen Physiol. .

Abstract

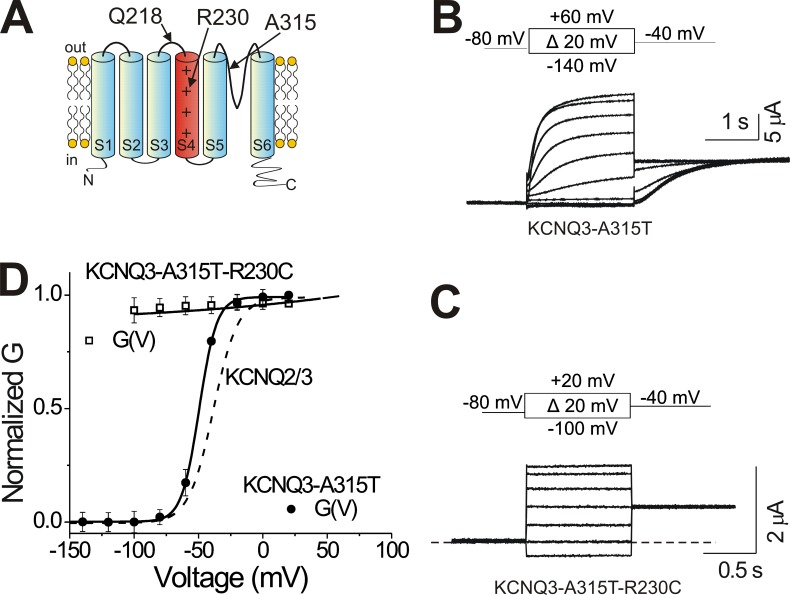
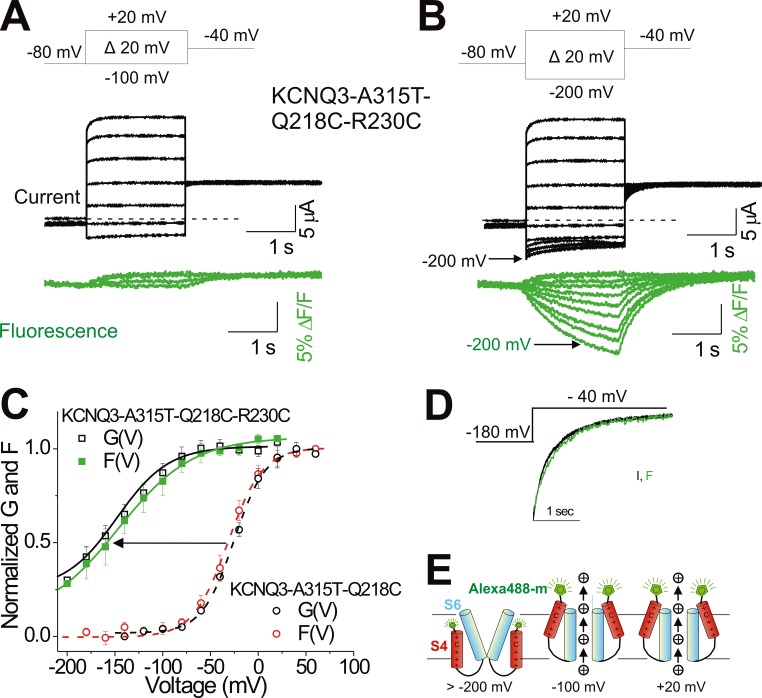
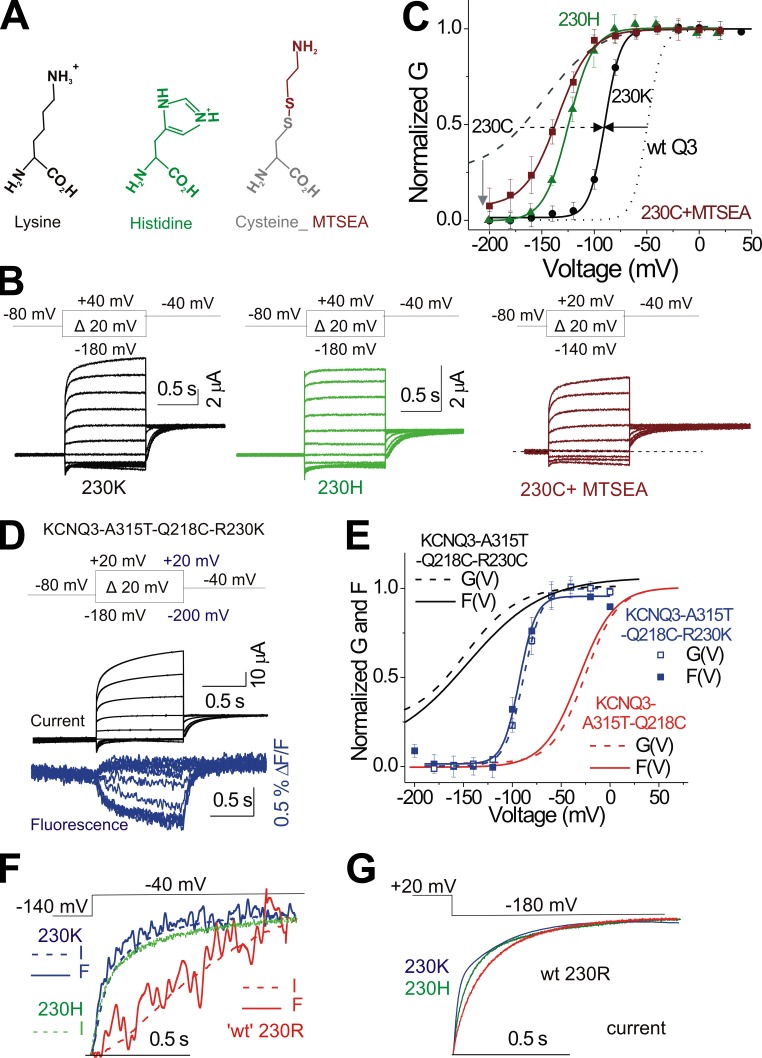
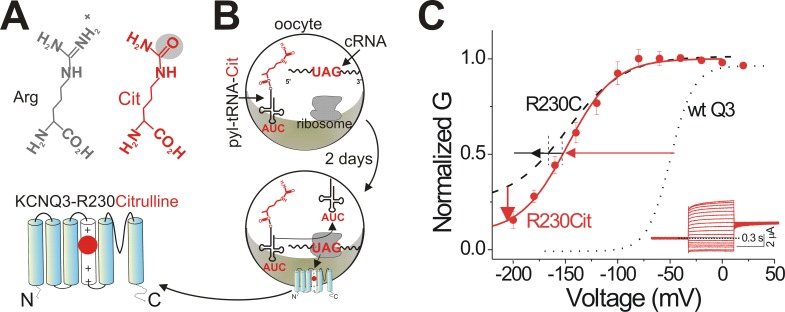
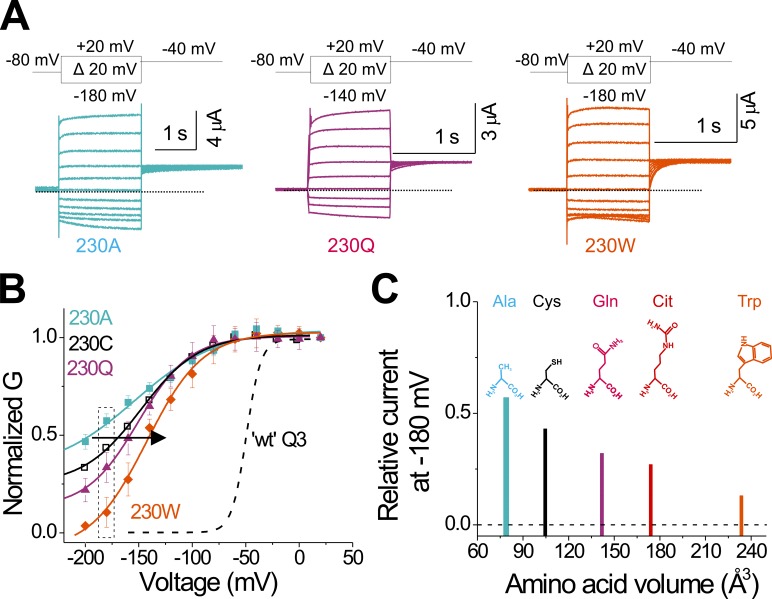
One of the major factors known to cause neuronal hyperexcitability is malfunction of the potassium channels formed by KCNQ2 and KCNQ3. These channel subunits underlie the M current, which regulates neuronal excitability. Here, I investigate the molecular mechanisms by which epilepsy-associated mutations in the voltage sensor (S4) of KCNQ3 cause channel malfunction. Voltage clamp fluorometry reveals that the R230C mutation in KCNQ3 allows S4 movement but shifts the open/closed transition of the gate to very negative potentials. This results in the mutated channel remaining open throughout the physiological voltage range. Substitution of R230 with natural and unnatural amino acids indicates that the functional effect of the arginine residue at position 230 depends on both its positive charge and the size of its side chain. I find that KCNQ3-R230C is hard to close, but it is capable of being closed at strong negative voltages. I suggest that compounds that shift the voltage dependence of S4 activation to more positive potentials would promote gate closure and thus have therapeutic potential.


Figures

Figure 1.
Figure 1.
R230C alters the voltage dependence and kinetics of KCNQ3 channels. (A) Cartoon of KCNQ3 channel representing residues mutated in this study. (B and C) Representative current traces from KCNQ3-A315T (B) and KCNQ3-A315T-R230C (C) channels for the indicated voltage protocols. Dashed line represents zero current. (D) Extrapolated tail conductances from B and C were normalized (G(V), see Materials and methods) and plotted versus test voltages (WT: KCNQ3-A315T circles; KCNQ3-A315T-R230C squares; means ± SEM, n = 7–13). For comparison, the tail conductance (dashed line) fit of heteromeric KCNQ2/KCNQ3 channel is shown. Lines represent the fitted theoretical voltage dependencies (Eqs. 1 and 2).
Figure 2.
Figure 2.
R230C shifts the voltage sensor movement and gate closing of KCNQ3 channels to very negative voltages. (A and B) Representative current (black) and fluorescence (green) traces from labeled KCNQ3-A315T-Q218C bearing R230C mutation for the indicated voltage protocols. In response to voltage steps more negative than −100 mV, R230C channels started to close and reopen when stepped back to −40 mV. Dashed lines represent zero current. (C) Extrapolated tail conductance (black) and fluorescence (green) from B were normalized (see Materials and methods) and plotted versus test voltages (G(V) and F(V) of KCNQ3-A315T-Q218C-R230C, black and green squares, respectively; means ± SEM, n = 9). The tail conductance (black) and fluorescence (red) of KCNQ3-A315T-Q218C are shown for comparison. Lines represent the fitted theoretical voltage dependencies (see Materials and methods, Eqs. 1 and 2). (D) Comparison of activation kinetics of current (black) and fluorescence (green) signals from KCNQ3-A315T-Q218C-R230C in response to the voltage protocol shown. (E) Cartoon representing a model of KCNQ3-A315T-Q218C-R230C channel gating where the equilibrium of the S4 movement is shifted to very negative voltages so that at −100 mV, S4 is in the activated position, allowing channel opening. S4 (red), S6 (blue), and Alexa Fluor 488 (green). For simplicity, only two of the four subunits in the tetrameric channel are shown.
Figure 3.
Figure 3.
The loss of the positive charge of R230 accounts for most of the leftward shift in the G(V). (A) Structure of lysine, histidine, and a modified cysteine by the thiol reagent MTSEA. (B) Representative current traces from KCNQ3-A315T-R230K (black), KCNQ3-A315T-R230H (green), and KCNQ3-A315T-R230C after application of MTSEA (1 mM; maroon) for the indicated voltage protocols. External MTSEA was applied by stepping 15 times to +20 mV for 5 s from a holding voltage of −80 mV and then washed away for 15 s before the indicated voltage protocol was applied. Dotted line represents zero current. (C) Extrapolated tail conductances from B were normalized (G(V), see Materials and methods) and plotted versus test voltages (means ± SEM; n = 8–9). Normalized G(V) of KCNQ3-A315T (WT Q3, dotted line) and KCNQ3-A315T-R230C (dashed line) are shown for comparison. (D) Representative current (black) and fluorescence (blue) traces from labeled KCNQ3-A315T-Q218C-R230K for the indicated voltage protocol. (E) Extrapolated tail conductance and fluorescence from D were normalized (see Materials and methods) and plotted versus test voltages (G(V), open squares), and F(V), filled blue squares) of KCNQ3-A315T-Q218C-R230K (means ± SEM, n = 10). For comparison, the tail conductance (dashed lines) and fluorescence (solid lines) fits of KCNQ3-A315T-Q218C-R230C (black) and WT KCNQ3-A315T-Q218C (red), respectively, are shown. Lines represent the fitted theoretical voltage dependencies (see Materials and methods, Eqs. 1 and 2). (F) Comparison of the kinetics of ionic current (dashed lines) and fluorescence (solid lines) signals from KCNQ3-A315T-Q218C-R230K (blue) and WT KCNQ3-A315T-Q218C (red), respectively, in response to the voltage protocol. The time course of ionic current of KCNQ3-A315T-R230H (green) is also shown for comparison. (G) Comparison of deactivation kinetics of ionic current from KCNQ3-A315T-Q218C-R230K (blue), KCNQ3-A315T-Q218C-R230H (green), and WT KCNQ3-A315T-Q218C (red), respectively, in response to the voltage protocol. The same color code for the different KCNQ3 bearing R230x amino acid substitutions is shown throughout the figure.
Figure 4.
Figure 4.
Encoding of the noncanonical amino acid citrulline quantifies the importance of a positive charge in an otherwise minimally modified side chain at position 230. (A) Structure of arginine and citrulline. (B) Cartoon representing encoding of citrulline into KCNQ3-R230 channels. Co-injection of pyrrolysine tRNA-citrulline with KCNQ3 cRNA containing the site-directed stop codon UAG (nonsense codon) at 230 into Xenopus oocytes (top panel). After 2 d of expression, citrulline (red) was incorporated into KCNQ3 channels at position 230 (bottom panel and left zoom in cartoon). (C) Extrapolated tail conductance from KCNQ3-A315T-R230Citrulline (red inset) was normalized (see Materials and methods) and plotted versus test voltages (G(V), red solid line; means ± SEM; n = 7). Normalized G(V) of KCNQ3-A315T (WT Q3, dotted black line) and KCNQ3-A315T-R230C (R230C, solid black line) are shown for comparison. Lines represent the fitted theoretical voltage dependencies (see Materials and methods, Eqs. 1 and 2). Inset shows a representative current trace from KCNQ3-R230Citrulline (red). Dotted line represents zero current. Cells were held at −80 mV and stepped to potentials between −160 mV and +60 mV in 10-mV intervals for 0.5 s, followed by a step to −40 mV to record tail currents.
Figure 5.
Figure 5.
The reduction of the side chain size at position 230 contributes to the leftward shift in the G(V). (A) Representative current traces from KCNQ3-A315T-R230A (light blue), KCNQ3-A315T-R230Q (magenta), and KCNQ3-A315T-R230W (orange) for the indicated voltage protocol. (B) Extrapolated tail conductances from R230x mutations from A were normalized (G(V), see Materials and methods) and plotted versus test voltages (means ± SEM; n = 8–11). Lines represent the fitted theoretical voltage dependencies (see Materials and methods, Eqs. 1 and 2). Dashed line represents the G(V) curve of KCNQ3-A315T (WT Q3) for comparison. Dotted lines represent zero current. (C) Relative current at −180 mV from R230x mutations taken from dashed rectangle in B, plotted against amino acid volume in aqueous solution (Zamyatnin, 1972). Dashed line represents the current of WT KCNQ3-A315T-R230R at −180 mV. Structure of the natural amino acids (A, C, Q, and W) and the unnatural amino acid citrulline (Cit), the uncharged close structural analogue of arginine, are shown for comparison. Citrulline volume is estimated from that of arginine. The same color code for the different KCNQ3 bearing R230x amino acid substitutions is shown throughout the figure.

Comment in

References

    1. Aggarwal S.K., and MacKinnon R.. 1996. Contribution of the S4 segment to gating charge in the Shaker K+ channel. Neuron. 16:1169–1177. 10.1016/S0896-6273(00)80143-9 - DOI - PubMed
    1. Allen A.S., Berkovic S.F., Cossette P., Delanty N., Dlugos D., Eichler E.E., Epstein M.P., Glauser T., Goldstein D.B., Han Y., et al. Epilepsy Phenome/Genome Project . 2013. De novo mutations in epileptic encephalopathies. Nature. 501:217–221. 10.1038/nature12439 - DOI - PMC - PubMed
    1. Barro-Soria R., Rebolledo S., Liin S.I., Perez M.E., Sampson K.J., Kass R.S., and Larsson H.P.. 2014. KCNE1 divides the voltage sensor movement in KCNQ1/KCNE1 channels into two steps. Nat. Commun. 5:3750 10.1038/ncomms4750 - DOI - PMC - PubMed
    1. Bartos D.C., Duchatelet S., Burgess D.E., Klug D., Denjoy I., Peat R., Lupoglazoff J.M., Fressart V., Berthet M., Ackerman M.J., et al. . 2011. R231C mutation in KCNQ1 causes long QT syndrome type 1 and familial atrial fibrillation. Heart Rhythm. 8:48–55. 10.1016/j.hrthm.2010.09.010 - DOI - PMC - PubMed
    1. Bezanilla F., and Perozo E.. 2003. The voltage sensor and the gate in ion channels. Adv. Protein Chem. 63:211–241. 10.1016/S0065-3233(03)63009-3 - DOI - PubMed

Publication types

Substances