. 2019 May 1;527(7):1179-1195.
doi: 10.1002/cne.24610. Epub 2019 Jan 7.

Astrocytic changes with aging and Alzheimer's disease-type pathology in chimpanzees

Affiliations

Astrocytic changes with aging and Alzheimer's disease-type pathology in chimpanzees

Emily L Munger et al. J Comp Neurol. .

Erratum in

  • Erratum.
    [No authors listed] [No authors listed] J Comp Neurol. 2021 May 1;529(7):1719. doi: 10.1002/cne.24755. J Comp Neurol. 2021. PMID: 33748970 No abstract available.

Abstract

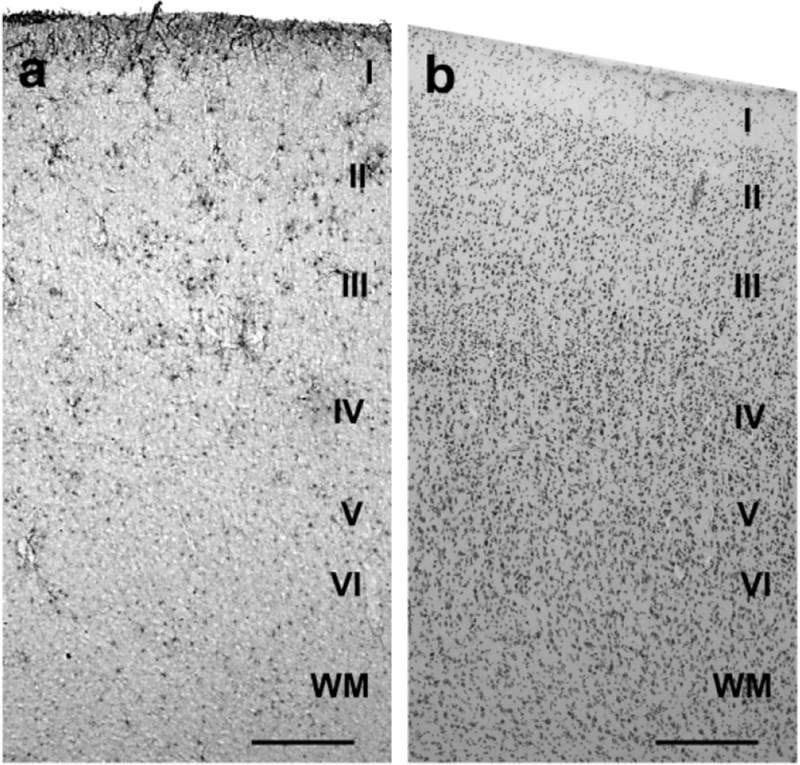
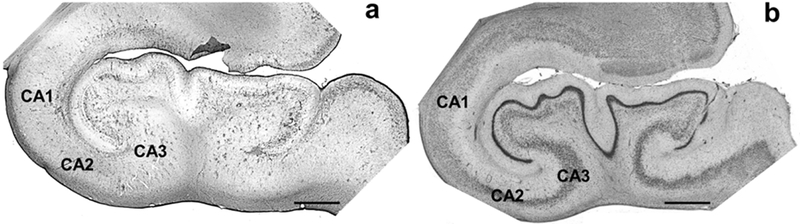
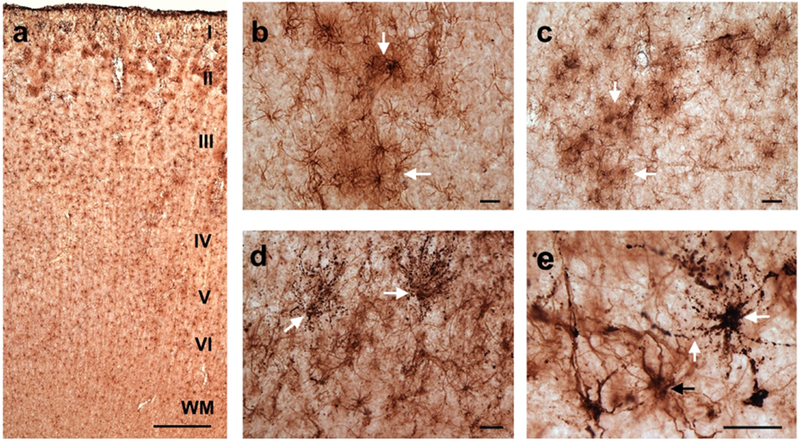
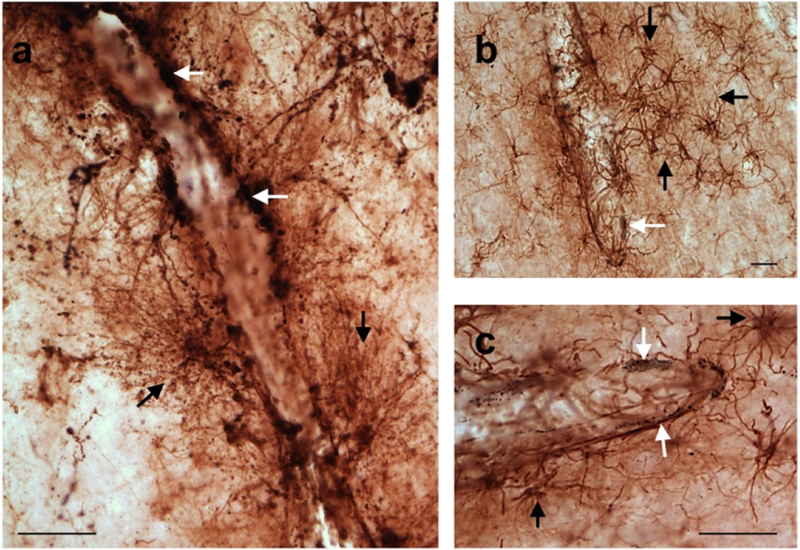
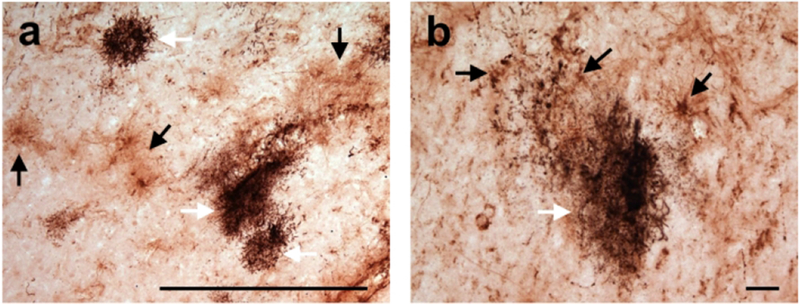
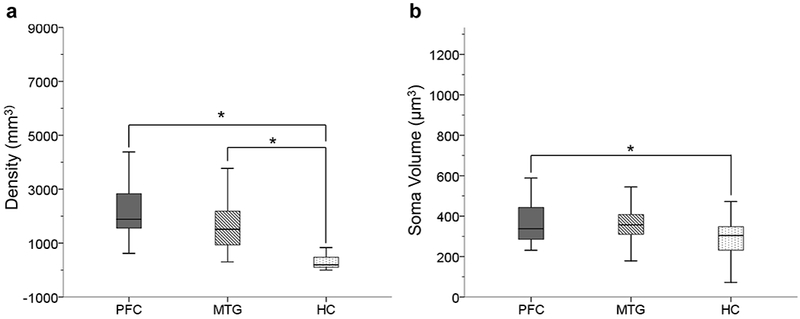
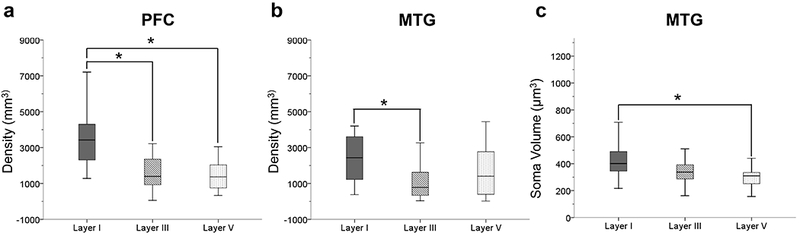
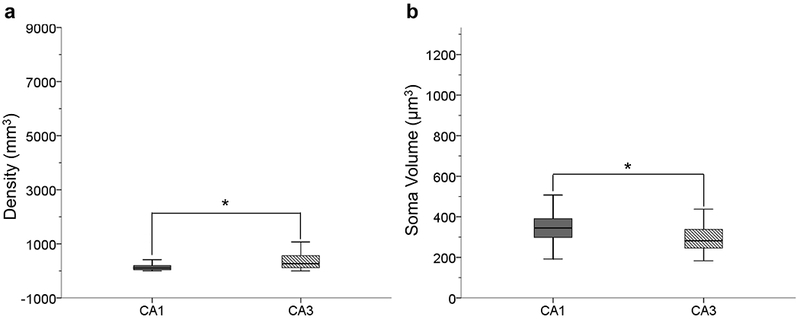
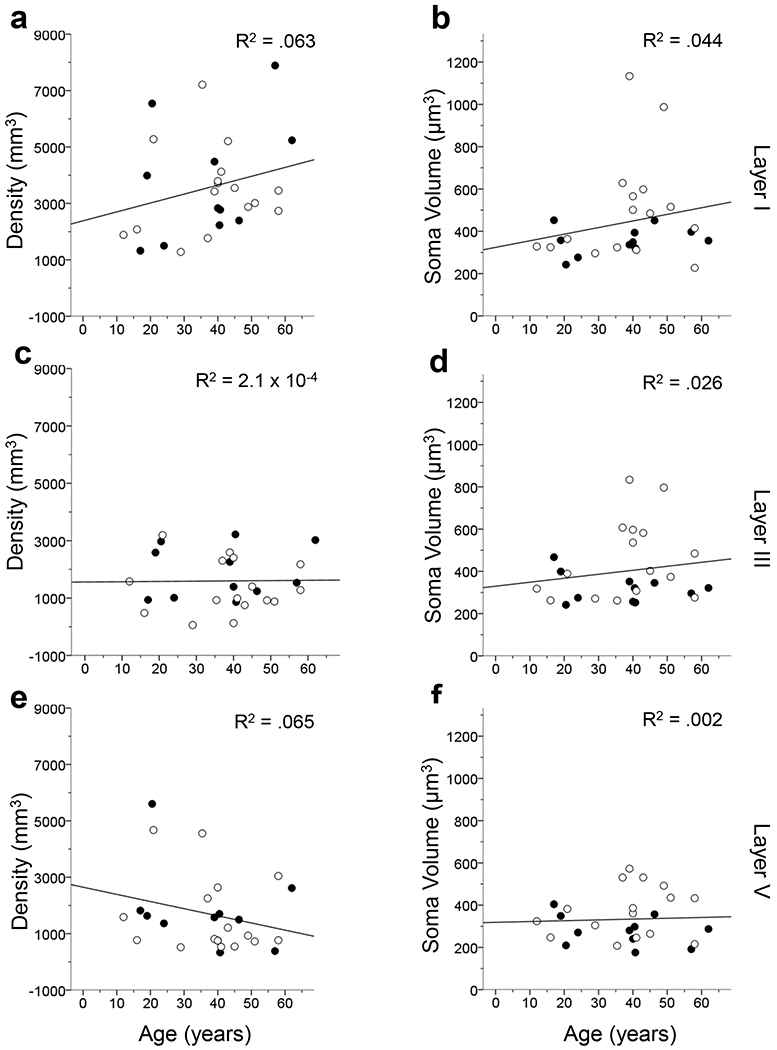
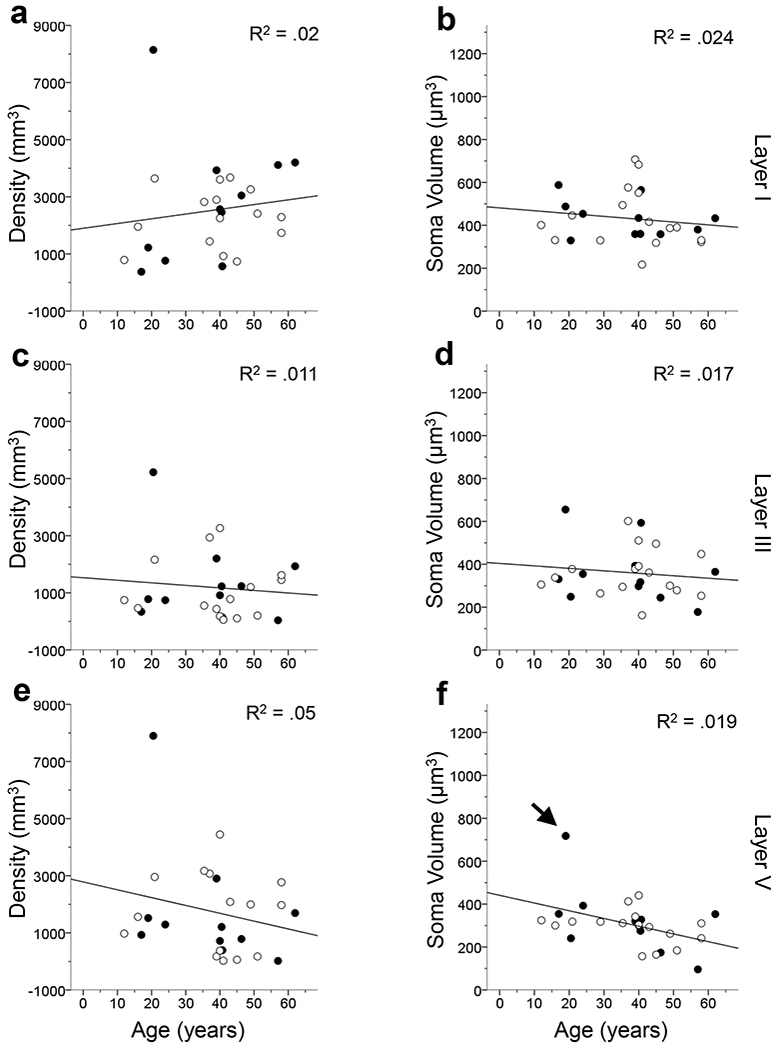
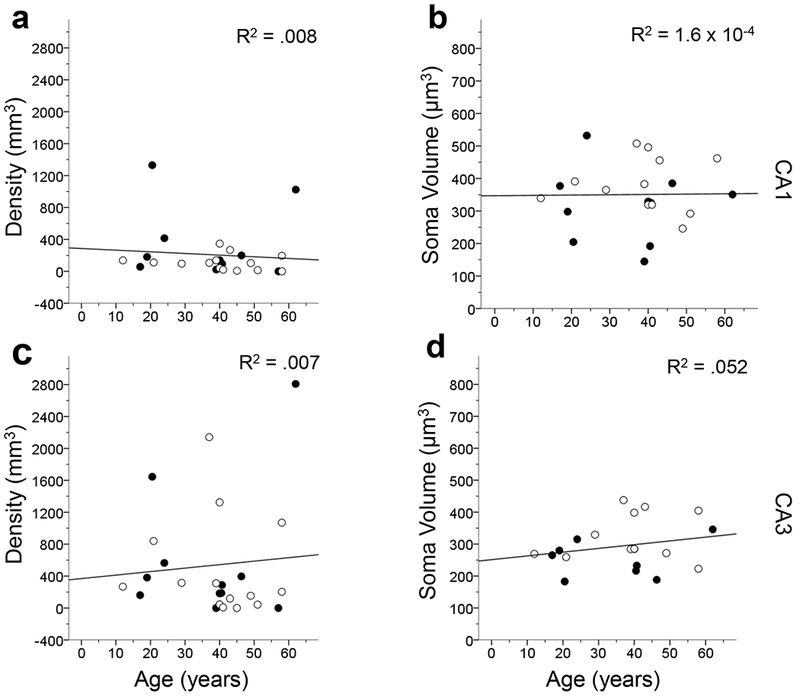
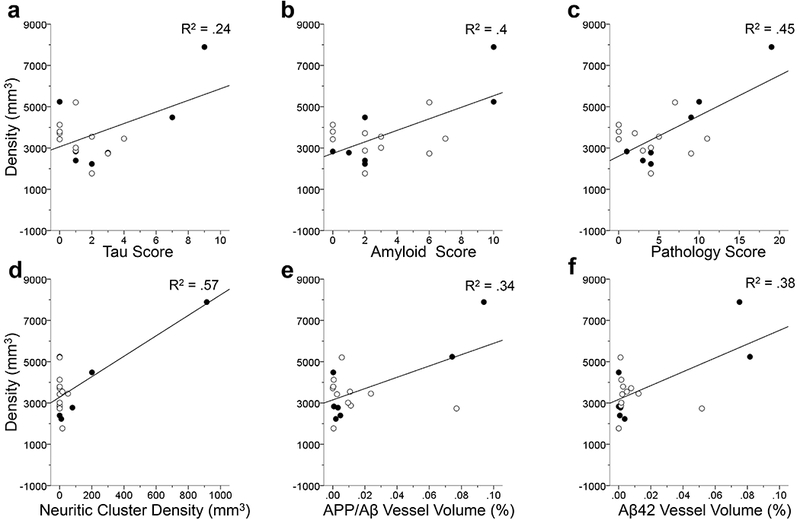
Astrocytes are the main homeostatic cell of the central nervous system. In addition, astrocytes mediate an inflammatory response when reactive to injury or disease known as astrogliosis. Astrogliosis is marked by an increased expression of glial fibrillary acidic protein (GFAP) and cellular hypertrophy. Some degree of astrogliosis is associated with normal aging and degenerative conditions such as Alzheimer's disease (AD) and other dementing illnesses in humans. The recent observation of pathological markers of AD (amyloid plaques and neurofibrillary tangles) in aged chimpanzee brains provided an opportunity to examine the relationships among aging, AD-type pathology, and astrocyte activation in our closest living relatives. Stereologic methods were used to quantify GFAP-immunoreactive astrocyte density and soma volume in layers I, III, and V of the prefrontal and middle temporal cortex, as well as in hippocampal fields CA1 and CA3. We found that the patterns of astrocyte activation in the aged chimpanzee brain are distinct from humans. GFAP expression does not increase with age in chimpanzees, possibly indicative of lower oxidative stress loads. Similar to humans, chimpanzee layer I astrocytes in the prefrontal cortex are susceptible to AD-like changes. Both prefrontal cortex layer I and hippocampal astrocytes exhibit a high degree of astrogliosis that is positively correlated with accumulation of amyloid beta and tau proteins. However, unlike humans, chimpanzees do not display astrogliosis in other cortical layers. These results demonstrate a unique pattern of cortical aging in chimpanzees and suggest that inflammatory processes may differ between humans and chimpanzees in response to pathology.

Keywords: Alzheimer's disease; RRID: AB_2109645; RRID: AB_223647; RRID: AB_2313952; RRID: AB_2314223; aging; astrocytes; cerebral cortex; chimpanzees; hippocampus; prefrontal cortex; stereology.


Conflict of interest statement

CONFLICT OF INTERESTS: No conflict of interest to report.

Figures

FIGURE 1.
FIGURE 1.
GFAP-immunostained section (a) and Nissl-stained section (b) with cortical layers labeled in the PFC of a 62 year-old chimpanzee. Nissl-stained sections were used to locate the appropriate cortical layers for quantification of the immunohistochemically processed sections. Scale bars = 250 μm.
FIGURE 2.
FIGURE 2.
GFAP-immunostained section (a) and Nissl-stained section (b) in a 62 year-old chimpanzee HC. All hippocampal subfields are labeled but only CA1 and CA3 were quantified for GFAP immunoreactivity density and soma volume. Nissl-stained sections were used to locate the appropriate subfield for quantification. Scale bars = 250 μm.
FIGURE 3.
FIGURE 3.
Photomicrographs of GFAP-ir astrocytes in the PFC of a 37 (a) 58 (b, c), 50 (d), and 57 (e) year-old chimpanzees demonstrating robust GFAP immunoreactivity and the presence of astrogliosis. GFAP immunolabeling can be seen throughout the cortical layers with astrogliosis occurring predominantly in the outer cortical layers (I-III; a). Activated astrocytes in the superficial cortical layers formed clusters (white arrows) with overlapping processes signifying a loss of domain organization (b, c). Panels d and e show double immunolabeling for GFAP and tau (white arrows). These astrocytes are morphologically consistent with what has been termed granular/fuzzy tau-ir astrocytes (white arrows; b, c). Scale bars = 250 μm (a) and 25 μm (b-e).
FIGURE 4.
FIGURE 4.
Astrogliosis was frequently found surrounding the vasculature in the PFC of a 57 (a) and 58 (b, c) year-old chimpanzees. The first panel shows astrocytes exhibiting tau accumulations (stained black; white arrows) lining blood vessels (a). Tau pathology was labeled using an antibody specific for phosphorylated tau (CP13). These astrocytes have many GFAP-ir processes (black arrows) that surround blood vessels in a web-like fashion (a). Panels b and c show activated astrocytes (black arrows) near blood vessels with amyloid pathology (stained black; white arrows). Amyloid pathology was labeled using antibodies specific for Aβ and amyloid precursor protein (6E10). Scale bars = 25 μm.
FIGURE 5.
FIGURE 5.
Astrogliosis (black arrows) occurs near chimpanzee specific neuritic clusters (white arrows) in the frontal cortex of a 57 year-old male chimpanzee. Neuritic clusters are visualized with immunohistochemical staining for phosphorylated tau. Scale bars = 250 μm (a) and 25 μm (b).
FIGURE 6.
FIGURE 6.
GFAP immunoreactivity is stronger in neocortical regions. Astrocyte density was significantly higher in PFC and MTG compared to HC (a; p’s < .017). Astrocyte soma volume was also significantly higher in PFC compared to HC (b; p < .017).
FIGURE 7.
FIGURE 7.
GFAP immunoreactivity was higher in layer I in both PFC and MTG. In the PFC there was a significantly greater astrocyte density in layer I compared to layers III and V (a; p’s < .017). In the MTG, astrocyte density was significantly higher in layer I compared to layer III (b; p < .017). Astrocyte soma volume in the MTG was significantly greater in layer I compared to layer V (c; p < .017).
FIGURE 8.
FIGURE 8.
GFAP-ir astrocyte density was significantly higher in the CA3 subfield compared to the CA1 indicating that more astrocyte within the CA3 upregulate GFAP expression in aging (a; p < .05). Astrocyte soma volume is significantly greater in the CA1 indicating astrocytic hypertrophy (b; p < .05). This indicates that CA3 astrocytes are in the earlier stages astrogliosis compared to the CA1.
FIGURE 9.
FIGURE 9.
Linear regression results comparing GFAP-ir astrocyte density and soma volume by age in the layers of the PFC. All analyses reveal that astrocyte activation does not significantly correlate with age (p’s > .05). The R2 value of each regression is indicated in each panel. Open symbols, females; black symbols, males.
FIGURE 10.
FIGURE 10.
Linear regression analyses examining GFAP-ir astrocyte density and soma volume by age in the MTG by cortical layers. The results indicate that astrocyte activation does not significantly correlate with age in the MTG except for GFAP-ir astrocyte soma volume in layer V (p’s > .05 for a-e; p < .05 for f). In layer V, one sample’s soma volume was greater than 3 standard deviations away from the mean (black arrow) and thus was removed from the data set and the statistical analysis was rerun (f). Upon rerunning the analysis, GFAP-ir soma volume no longer significantly increased with age (f; p > .05). The R2 value of each regression is indicated in each panel. Open symbols, females; black symbols, males.
Figure 11.
Figure 11.
Linear regression comparing age to GFAP-ir astrocyte density and soma volume in each hippocampal subfield. The results show that GFAP-ir astrocyte density and soma volume were not significantly correlated with age (p’s > .05). The R2 value of each regression is indicated in each panel. Open symbols, females; black symbols, males.
FIGURE 12.
FIGURE 12.
Linear regression analyses in PFC layer I comparing GFAP-ir astrocyte density to the three individual AD scores (a-c). Astrogliosis was significantly increased in relation to tau score (a), amyloid score (b) and pathology score (c; all p’s < 0.5). Linear regressions comparing GFAP immunolabeling density in PFC layer I to AD-type pathology (c-d). Each regression analyses showed a significant correlation to astrocyte GFAP immunoreactivity density in layer I in response to neuritic cluster density (d), APP/Aβ vessel volume (e), Aβ42 vessel volume (f; all p’s < .05). AD-type pathology appears to trigger an increase in the density of reactive astrocytes in layer I indicating the possible vulnerability of these astrocytes. The R2 value of each regression is indicated in each panel. Open symbols, females; black symbols, males.
FIGURE 13.
FIGURE 13.
Linear regression analyses show that GFAP-ir soma volume significantly increases with tau neuritic cluster density in the CA1 (a; p < .05). The results of the linear regressions of GFAP-ir astrocyte density in the CA1 significantly increases with an increase APP/Aβ plaque volume (b) and Aβ42 vessel volume (c; both p’s < .05). Each regression indicates that activated astrocytes measured by overall density and soma volume increases in relation to AD-type pathology in the chimpanzee CA1. The R2 value of each regression is indicated in each panel. Open symbols, females; black symbols, males.
FIGURE 14.
FIGURE 14.
Linear regression analyses in the CA3 show a significant increase in GFAP-ir astrocyte density with an increase in APP/Aβ vessel volume (a) and Aβ42 vessel volume (b; both p’s < .05). These results indicate that there is a strong response by astrocytes to amyloid accumulation in the vasculature. The R2 value of each regression is indicated in each panel. Open symbols, females; black symbols, males.

References

    1. Almkvist O, Basun H, Bäckman L, Herlitz A, Lannfelt L, Small B, …Winblad B (1998). Mild cognitive impairment: an early stage of Alzheimer’s disease? Journal of Neural Transmission 54, 21–29. - PubMed
    1. Alzheimer A (1911). Über eigenartige Krankheitsfälle des späteren Alters. Zeitschrift der Gesellschaft für Neurologie und Psychiatrie 4, 356–385.
    1. Akinyemi RO, Mukaetova-Ladinska EB, Attems J, Ihara M, & Kalaria RN (2013). Vascular risk factors and neurodegeneration in ageing related dementias: Alzheimer’s disease and vascular dementia. Current Alzheimer’s Research 10, 642–653. - PubMed
    1. Arnold SE, Hyman BT, Flory J, Damasio AR, & Van Hosen GW (1991). The topographical and neuroanatomical distribution of neurofibrillary tangles and neuritic plaques in the cerebral cortex of patients with Alzheimer’s disease. Cerebral Cortex 1, 103–116. - PubMed
    1. Armstrong RA (2009). The molecular biology of senile plaques and neurofibrillary tangles in Alzheimer’s disease. Folia Neuropathologica 47, 289–299. - PubMed

Publication types

MeSH terms