Case Reports
. 2019 Jun;143(6):2215-2226.e7.
doi: 10.1016/j.jaci.2018.10.068. Epub 2018 Dec 19.

IFN-γ and CD25 drive distinct pathologic features during hemophagocytic lymphohistiocytosis

Affiliations
Case Reports

IFN-γ and CD25 drive distinct pathologic features during hemophagocytic lymphohistiocytosis

Stéphanie Humblet-Baron et al. J Allergy Clin Immunol. 2019 Jun.

Abstract

Background: Inflammatory activation of CD8+ T cells can, when left unchecked, drive severe immunopathology. Hyperstimulation of CD8+ T cells through a broad set of triggering signals can precipitate hemophagocytic lymphohistiocytosis (HLH), a life-threatening systemic inflammatory disorder.

Objective: The mechanism linking CD8+ T-cell hyperactivation to pathology is controversial, with excessive production of IFN-γ and, more recently, excessive consumption of IL-2, which are proposed as competing hypotheses. We formally tested the proximal mechanistic events of each pathway in a mouse model of HLH.

Methods: In addition to reporting a complete autosomal recessive IFN-γ receptor 1-deficient patient with multiple aspects of HLH pathology, we used the mouse model of perforin (Prf1)KO mice infected with lymphocytic choriomeningitis virus to genetically eliminate either IFN-γ production or CD25 expression and assess the immunologic, hematologic, and physiologic disease measurement.

Results: We found a striking dichotomy between the mechanistic basis of the hematologic and inflammatory components of CD8+ T cell-mediated pathology. The hematologic features of HLH were completely dependent on IFN-γ production, with complete correction after loss of IFN-γ production without any role for CD8+ T cell-mediated IL-2 consumption. By contrast, the mechanistic contribution of the immunologic features was reversed, with no role for IFN-γ production but substantial correction after reduction of IL-2 consumption by hyperactivated CD8+ T cells. These results were complemented by the characterization of an IFN-γ receptor 1-deficient patients with HLH-like disease, in whom multiple aspects of HLH pathology were observed in the absence of IFN-γ signaling.

Conclusion: These results synthesize the competing mechanistic models of HLH pathology into a dichotomous pathogenesis driven through discrete pathways. A holistic model provides a new paradigm for understanding HLH and, more broadly, the consequences of CD8+ T-cell hyperactivation, thereby paving the way for clinical intervention based on the features of HLH in individual patients.

Keywords: CD25; CD8(+) T-cell hyperactivation; IFN-γ; hemophagocytic lymphohistiocytosis.


Conflict of interest statement

CONFLICTS OF INTEREST DISCLOSURES

The authors declare no conflicts of interest.

Figures

Figure 1.
Figure 1.. Hematological component of murine HLH is dependent on excessive IFN-γ production.
Wildtype mice, IFN-γKO, Prf1KO, and Prf1KOIFN-γKO mice were infected with LCMV Armstrong. On day 10, blood samples from each strain were assessed for (A) hemoglobin (B) red blood cells and (C) hematocrit (A-C: n=11,5,4, 6). Results pooled from 4 experiments. (C) Representative histology from the liver and (D) histological scoring for hemophagocyte presence in liver on H&E sections on day 10 (n=3,4,3,3). Arrows indicate hemophagocytes. Scale bar is 50 μm. Analyzed with one-way ANOVA with Tuckey’s multiple comparisons test, SEM and individual data points shown.
Figure 2.
Figure 2.. Inflammatory and physiological aspects of murine HLH arise independent of IFN-γ.
Wildtype mice, IFN-γKO, Prf1KO, and Prf1KOIFN-γKO mice were infected with LCMV Armstrong. (A) Mouse weights on days 0, 7 and 10 after LCMV infection (n=7,9,7,9). (B) Histological scoring for immune cell infiltrates in liver on H&E sections on day 10 (n=5,6,3,6). (C) Percentage of CD8+ T cells in the lymph nodes (n=7,9,7,9). (D) Percentage of CD8+ T cells in the CD8+CD62LCD44+ effector memory (TEM) (n=7,9,7,9) and percentage of activated CD8+ T cells in the CD8+CD127+KLRG1high (SLEC) subsets (n=4,5,7,6). (E) Percentage of CD8+ T cells expressing CD25+ (n=7,9,7,9). (F) Representative CD25 staining on CD8+ T cells. (G) CD25 geometric MFI on total CD8+ T cells (n=4,5,7,6). (H) Relative ratio of sCD25 in the serum (n=14,6,15,6). Analyzed with one-way ANOVA with Tuckey’s multiple comparisons test, SEM and individual data points shown. Results pooled from 4 experiments and 3 experiments for sCD25 measurements.
Figure 3.
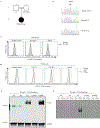
Figure 3.. IFN-γR1 deficiency in a HLH-like patient.
(A) Pedigree of kindred, showing the index case and parents; each generation is designated by a Roman numeral (I-II). No gDNA was available for testing for father labeled “E?”. (B) Electropherogram (healthy control, patient (II,1) and her mother) showing the position of the mutation in the IFNGR1 gene. (C) Flow cytometry analysis of IFN-γR1 expression on the surface of EBV-B cells from healthy control, IFN-γR1 deficient patient and patient (II,1) with the recessive W99R mutation. The histograms represent the expression of IFN-γR1 (gray filled) and the isotype control (dashed line). (D) Phospho-STAT1 response of EBV-B cells to IFN-γ (black line) or IFN-α (dashed line) stimulation in healthy control, IFN-γR1 deficient patient and patient (II,1). (E) IFN-γR1−/− SV40 fibroblasts were left untransfected (NT) or were transiently transfected with EV, WT, c.131del (negative control) o p.W99R mutant- IFNGR1 plasmids. Total lysis and western blots were performed with anti-V5 antibody, with GAPDH as the loading control. (F) IFN-γR1−/− SV40 fibroblasts were left untransfected (NT) or were transiently transfected with empty plasmid (EV), wild type (WT), c.131del (negative control) and p.W99R mutant-IFNGR1 plasmids, and were either left non-stimulated (NS) or stimulated with 105 IU/ml IFN-γ (IFN-γ). DNA-binding activity was then analyzed by EMSA with a GAS probe.
Figure 4.
Figure 4.. Removal of CD25 expression on CD8+ T cells prevents rewiring of IL-2 consumption and the collapse of Tregs during HLH.
Wildtype mice, Prf1KO, Prf1KOCD8ΔCD25 mice were infected with LCMV Armstrong, and assessed on day 10. (A) Percentage of CD8+ T cells expressing CD25 (n=13,9,16). (B) Percentage of Treg within the CD4+ T cell population (n=13,9,16). (C) (left) Percentage of cells positive for phospho-STAT5 staining in CD8+ T cells, (middle) geometric MFI for phospho-STAT5 staining on CD8+, (right) representative phospho-STAT5 staining on CD8+ T cells (n=5,7,7). (D) (left) Percentage cells positive for phospho-STAT5 staining in CD4+CD25+ Treg cells within the CD4+ T cell population, (middle) geometric MFI of phospho-STAT5 staining on CD4+CD25+ Treg cells and (right) representative phospho-STAT5 staining on CD4+Foxp3+ Treg cells (n=6,7,7). (E) IL-2 concentration in the serum (n=10,9,12). (F) Soluble CD25 in the serum (n=10,9,12). Analyzed with one-way ANOVA with Tuckey’s multiple comparisons test, SEM and individual data points shown. Results pooled from 4 experiments and 3 experiments for phospho-STAT5 measurements.
Figure 5.
Figure 5.. Correction of the IL-2 consumption phenotype of hyper-activated CD8+T cells does not impact the hematological features of HLH.
Wildtype mice, Prf1KO, Prf1KOCD8ΔCD25 mice were infected with LCMV Armstrong. On day 10, blood samples from each strain were assessed for (A) hemoglobin (n=11, 9, 14), (B) red blood cells (n=10, 9, 14), (C) hematocrit (n=11, 9, 14) (D) reticulocytes (n=10, 8, 14), (E) immature reticulocyte fraction (IRF) (n=8, 6, 11) and (F) platelets (n=11, 9, 14). Analyzed with one-way ANOVA with Tuckey’s multiple comparisons test, SEM and individual data points shown. Results pooled from 4 experiments.
Figure 6.
Figure 6.. Immunological and pathophysiological processes of HLH are dependent on CD25 expression by CD8+ T cells.
Wildtype mice, Prf1KO, Prf1KOCD8ΔCD25 mice were infected with LCMV Armstrong, and assessed for immunological features on day 10. (A) Mouse weights on days 0, 7 and 10 after LCMV infection (n=10,7,13). (B) Survival following LCMV infection (n=8,5,8). (C) Percentage of CD8+ T cells in the lymph nodes(n=12,9,16). (D) Percentage and (E) representative flow cytometry for CD8+ T cells in the naïve (CD62L+CD44), central memory (TCM; CD62L+CD44+), and effector memory (TEM; CD62LCD44+) class (n=12,9,16). (F) Percentage of activated CD8+ T cells in the CD8+CD127+KLRG1low (MPEC) (n=12,9,16) and CD8+CD127KLRG1high (SLEC) subsets (n=11,9,15). (G) Percentage of CD8+ T cells expressing CD69 (n=12,9,16), (H) PD-1 (n=12,9,16), (I) Ki67 (n=13,9,16) and (J) IFN-γ (n=9,9,12). (K) Percentage of CD4+ T cells in the naïve (CD62L+CD44), central memory (TCM; CD62L+CD44+), and effector memory (TEM; CD62LCD44+) class (n=12,9,16). Analyzed with one-way ANOVA with Tuckey’s multiple comparisons test, SEM and individual data points shown. Results pooled from 3 to 4 experiments.

References

    1. Janka GE, Lehmberg K. Hemophagocytic syndromes - An update. Blood Rev 2014;28:135–42. - PubMed
    1. Jordan MB, Allen CE, Weitzman S, Filipovich AH, McClain KL. How I treat hemophagocytic lymphohistiocytosis. Blood 2011;118:4041–52. - PMC - PubMed
    1. Janka GE, Lehmberg K. Hemophagocytic lymphohistiocytosis: pathogenesis and treatment. Hematol Am Soc Hematol Educ Progr 2013;2013:605–11. - PubMed
    1. Trottestam H, Horne A, Arico M, Egeler RM, Filipovich AH, Gadner H, et al. Chemoimmunotherapy for hemophagocytic lymphohistiocytosis: long-term results of the HLH-94 treatment protocol. Blood 2011;118:4577–84. - PMC - PubMed
    1. Allen CE, McClain KL. Pathophysiology and epidemiology of hemophagocytic lymphohistiocytosis. Hematol Am Soc Hematol Educ Progr 2015;2015:177–82. - PubMed

Publication types

MeSH terms