. 2018 Oct;16(5):342-353.
doi: 10.1016/j.gpb.2018.05.004. Epub 2018 Dec 19.

TICA: Transcriptional Interaction and Coregulation Analyzer

Affiliations

TICA: Transcriptional Interaction and Coregulation Analyzer

Stefano Perna et al. Genomics Proteomics Bioinformatics. 2018 Oct.

Abstract

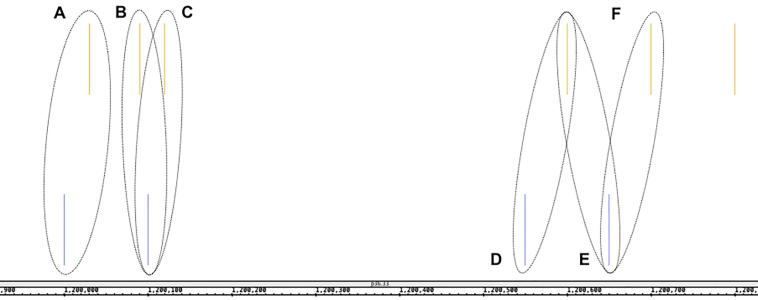
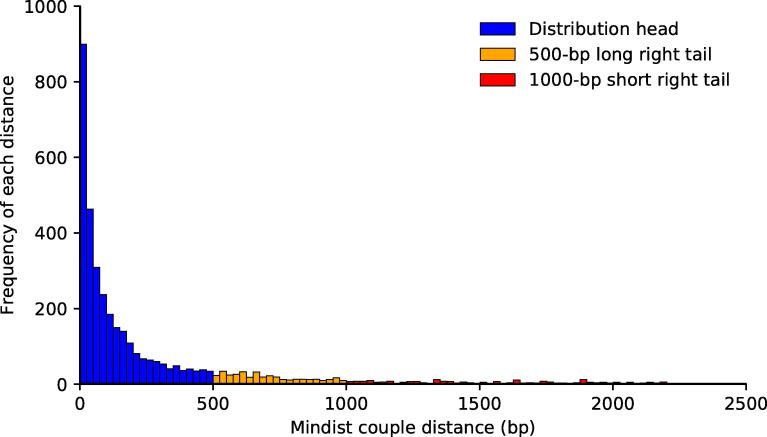
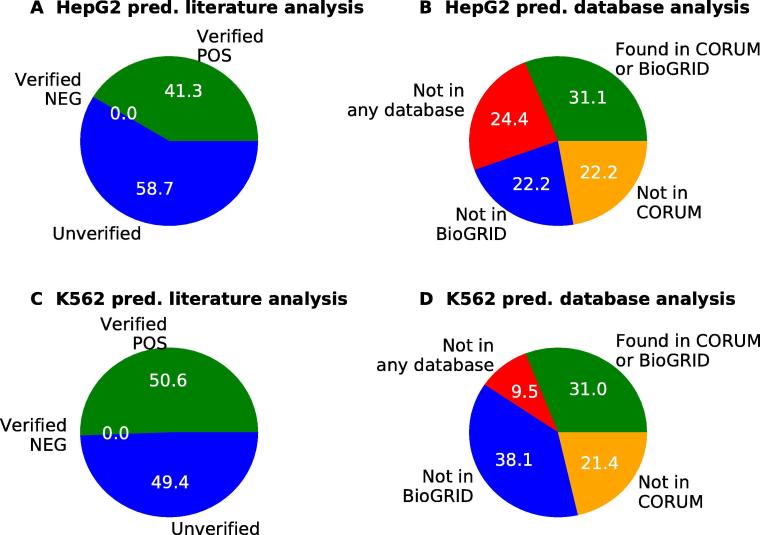
Transcriptional regulation is critical to cellular processes of all organisms. Regulatory mechanisms often involve more than one transcription factor (TF) from different families, binding together and attaching to the DNA as a single complex. However, only a fraction of the regulatory partners of each TF is currently known. In this paper, we present the Transcriptional Interaction and Coregulation Analyzer (TICA), a novel methodology for predicting heterotypic physical interaction of TFs. TICA employs a data-driven approach to infer interaction phenomena from chromatin immunoprecipitation and sequencing (ChIP-seq) data. Its prediction rules are based on the distribution of minimal distance couples of paired binding sites belonging to different TFs which are located closest to each other in promoter regions. Notably, TICA uses only binding site information from input ChIP-seq experiments, bypassing the need to do motif calling on sequencing data. We present our method and test it on ENCODE ChIP-seq datasets, using three cell lines as reference including HepG2, GM12878, and K562. TICA positive predictions on ENCODE ChIP-seq data are strongly enriched when compared to protein complex (CORUM) and functional interaction (BioGRID) databases. We also compare TICA against both motif/ChIP-seq based methods for physical TF-TF interaction prediction and published literature. Based on our results, TICA offers significant specificity (average 0.902) while maintaining a good recall (average 0.284) with respect to CORUM, providing a novel technique for fast analysis of regulatory effect in cell lines. Furthermore, predictions by TICA are complementary to other methods for TF-TF interaction prediction (in particular, TACO and CENTDIST). Thus, combined application of these prediction tools results in much improved sensitivity in detecting TF-TF interactions compared to TICA alone (sensitivity of 0.526 when combining TICA with TACO and 0.585 when combining with CENTDIST) with little compromise in specificity (specificity 0.760 when combining with TACO and 0.643 with CENTDIST). TICA is publicly available at http://geco.deib.polimi.it/tica/.

Keywords: Coregulation; Data-driven analysis; Machine learning; Protein–protein interactions; Transcription factors.


Figures

Figure 1
Figure 1
Example of mindist couple extraction on synthetic TFBS data The closest binding site fitting the criteria becomes paired with the anchor and forms a mindist couple, and their distance is defined as the couple distance accordingly. If both the adjacent binding sites are valid and tied for the closest, two different mindist couples with identical distance values are generated. If none of the two is valid, no couple is generated and the algorithm then proceeds to the next binding site. Note that a single binding site does not have to belong to only one couple, but any couple formed by the exact same binding sites (in any order) is only counted once. A. The TF2 binding sites (yellow) can only be associated to the first TF1 sample (blue), as the next one in the sorting has the same label. B. and C. TF1 is associated to both TF2 sites. These couples are found twice but only counted once. D. One of the two TF2 sites is out of admissible range for the TF1 site, so only one couple is found. E. and F. Both TF1 sites are equally distant to the anchor TF2 site, both generate a mindist couple.
Figure 2
Figure 2
Histograms of distance distribution for TF couple CTCF and Myc in HepG2 A. Distance distribution of the TF couple for CTCF and Myc, for which there is no evidence known to support the interaction behavior. B. Zoomed view of the distribution short and long tails. In both panels, blue columns denote the head of the distribution (couples with distance ranging 0–500 bp), red columns denote the short right tail of the distribution (distance >1000 bp), and orange columns denote the long right tail of the distribution (distance >500 bp). Note that the 500-bp tail and 1000-bp tail overlap for the distances >1000 bp. CTCF, CCCTC-binding factor.
Figure 3
Figure 3
Histograms of distance distribution for TF couple MAX and Myc in HepG2 A. Distance distribution of the TF couple for MAX and Myc, which are well-known interacting TFs. B. Zoomed view of the distribution short and long tails. In both panels, blue columns denote the head of the distribution (couples with distance ranging 0–500 bp), red columns denote the short right tail of the distributions (distance >1000 bp), and orange columns denote the long right tail of the distribution (distance >500 bp). Note that the 500-bp tail and 1000-bp tail overlap for the distances >1000 bp. MAX, Myc-associated factor X.
Figure 4
Figure 4
Mindist couple distance right tails using TFs ARID3A and ATF1 on cell line HepG2Blue columns denote the head of the distributions, red columns denote the short right tail of distribution (distance >1000 bp) and orange columns denote the long right tail of the distribution (distance >500 bp). Note that the 500-bp tail and 1000-bp tail overlap for the distances >1000 bp.
Figure 5
Figure 5
Summary of positive predictions supported by the literature A. Literature analysis of the positive predictions for cell line HepG2. A positive prediction can be “Verified as POS” if interaction evidence is found in published literature (green); “Verified as NEG” if evidence is found that there is no interaction between members (red); or it can be “Unverified” if no evidence is found for either case (blue). B. Database cross-check of verified positive predictions for cell line HepG2. “Not in any database” (red) means that the predicted interactions are not found in either CORUM or BioGRID; blue indicates the number of positive predictions not found in BioGRID, whereas orange indicate the number of positive predictions not found in CORUM. Green slice indicates the number of predictions found in at least one of the two databases. C. Positive predictions literature analysis for cell line K562 (same color code as A). D. Database cross-check of verified positive predictions for cell line K562 (same color code as B). pred., predictions.

References

    1. Hughes T.R. Springer, Netherlands; Berlin: 2011. A handbook of transcription factors. - PubMed
    1. Weirauch M.T., Hughes T.R. A catalogue of eukaryotic transcription factor types, their evolutionary origin, and species distribution. In: Hughes T.R., editor. A handbook of transcription factors. Springer; Netherlands, Berlin: 2011. pp. 26–73. - PubMed
    1. Zhang Y., Dakic A., Chen R., Dai Y., Schlegel R., Liu X. Direct HPV E6/Myc interactions induce histone modifications, Pol II phosphorylation, and hTERT promoter activation. Oncotarget. 2017;8:96323–96339. - PMC - PubMed
    1. Zhang Z., Hu X., Zhang Y., Miao Z., Xie C., Meng X. Opposing control by transcription factors MYB61 and MYB3 increases freezing tolerance by relieving c-repeat binding factor suppression. Plant Physiol. 2016;172:1306–1323. - PMC - PubMed
    1. Jolma A., Yin Y., Nitta K.R., Dave K., Popov A., Taipale M. DNA-dependent formation of transcription factor pairs alters their binding specificity. Nature. 2015;527:384–389. - PubMed

Publication types

Substances