. 2019 Nov:80:99-108.
doi: 10.1016/j.alcohol.2018.12.003. Epub 2018 Dec 20.

Diallyl disulfide inhibits ethanol-induced pulmonary cell vitamin D and antimicrobial peptide cathelicidin depletion

Affiliations

Diallyl disulfide inhibits ethanol-induced pulmonary cell vitamin D and antimicrobial peptide cathelicidin depletion

Olalekan Ogunsakin et al. Alcohol. 2019 Nov.

Abstract

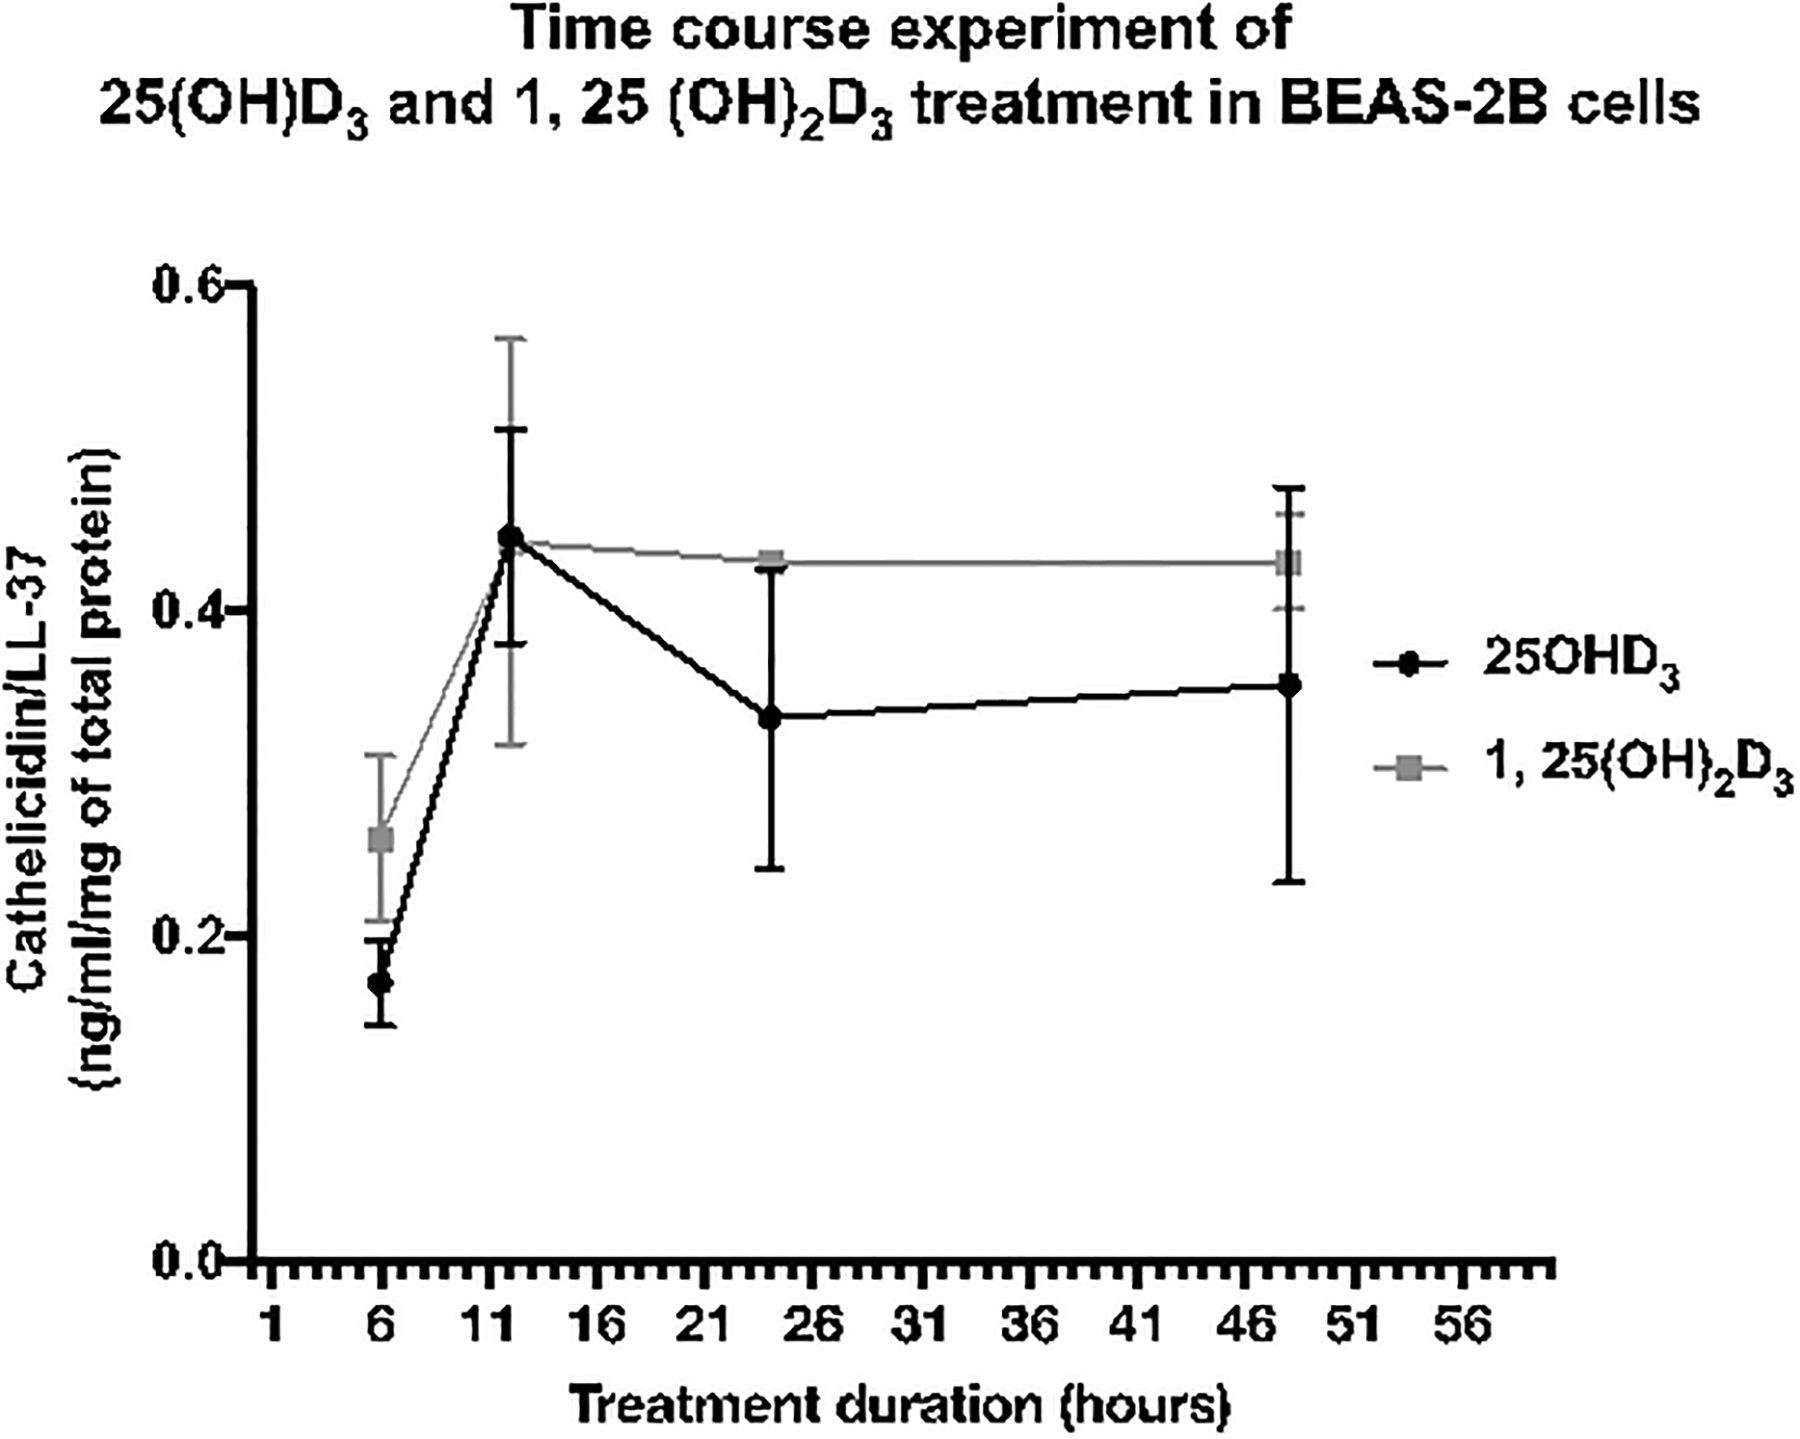
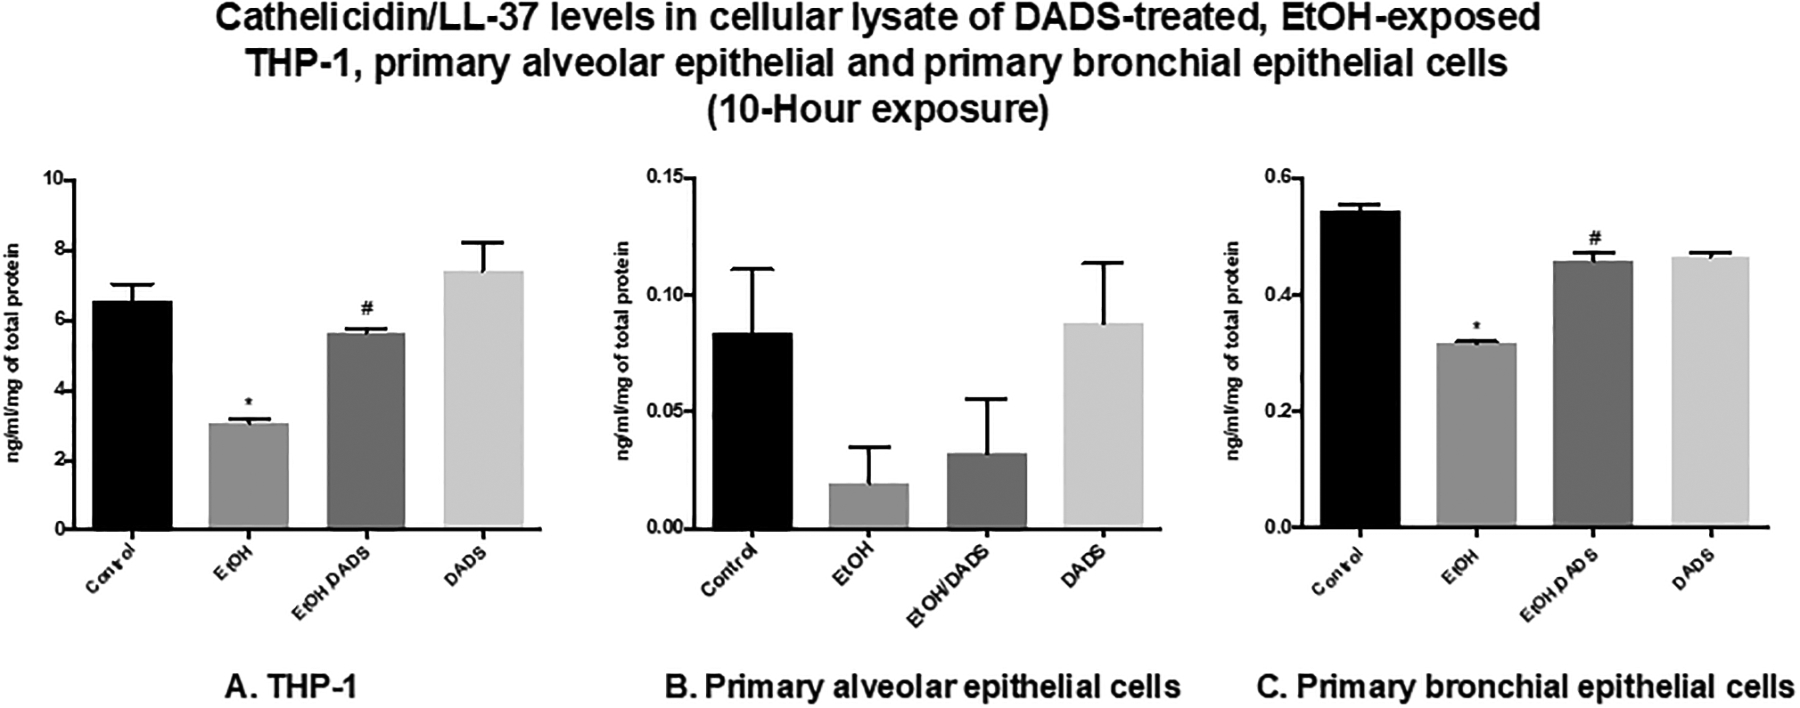
Ethanol has been found to affect pulmonary cells by interfering with vitamin D metabolism and pulmonary defense mechanisms. The objective of this study was to understand the mechanisms of ethanol's disruptive influence on the vitamin D pathway and inhibition of anti-microbial peptide cathelicidin (LL-37). Bronchial epithelial cells (BEAS-2Bs), primary human bronchial epithelial cells (HBECs), primary human alveolar epithelial cells (HPAEpiCs), and human monocyte cells (THP-1s) were used in this study. These cells were cultured and exposed to different treatment groups: medium-only control, ethanol (70 mM) only, diallyl disulfide (DADS) (10 μM) -only, and a co-exposure of ethanol (70 mM) and DADS (10 μM) for 10 or 24 h. Calcidiol (50 ng/mL) and calcitriol (0.05 ng/mL) dose-response studies were conducted for 48 h. After incubation, cells were trypsinized, lysed, and centrifuged, and the cellular lysate was prepared for assay. Protein was quantified, and levels of inactive vitamin D [25(OH)D3], active vitamin D [1, 25(OH)2 D3], and anti-microbial peptides (cathelicidin/LL-37) in the samples were assayed using commercially available ELISA kits. In the ethanol-exposed group, cellular lysate concentrations of 25(OH)D3 and LL-37 were significantly reduced by 30%, and 40% in BEAS-2B cells, and 35% and 80% in HPAEpi cells respectively. Overall 1, 25(OH)2D3 cellular lysate levels were lower but followed a similar trend as the 25(OH)D3 response. LL-37 levels in primary bronchial, alveolar cells, and ThP-1 cells were statistically reduced in ethanol-exposed groups (60%, 80%, and 65%, respectively) when compared with control. Following the addition of DADS, levels of LL-37 were recovered to within control levels for all three cell types. This study establishes two clinically relevant observations: that the exposure of pulmonary epithelial and monocyte cells to physiologically relevant levels of excessive ethanol selectively disrupts the activation of pulmonary vitamin D and inhibits the presence of anti-microbial peptide (LL-37) in vitro, and the co-exposure of DADS significantly attenuates ethanol-induced intracellular LL-37 depletion.

Keywords: Active vitamin D; Alcohol; Alcohol use disorder (AUD); Anti-microbial peptides; Cathelicidin/LL-37; Inactive vitamin D; Pneumonia; Pulmonary system.


Figures

Fig. 1.
Fig. 1.
Illustration of vitamin D circulation in the blood, and its metabolism in the skin, liver, kidney, and lungs.
Fig. 2.
Fig. 2.. 25(OH)D3 levels in cellular lysate of DADS-treated ethanol-exposed BEAS-2B and primary alveolar epithelial cells.
(A) In BEAS-2B cells, 24-hour exposure to 70-mM ethanol reduced 25(OH)D3 levels when compared with untreated controls (approximately 25% decrease). Treatment of ethanol-exposed cells with 10-μM DADS restored 25(OH)D3 levels to above control levels. The increase in 25(OH)D3 level was significant when compared with untreated control (16%) and ethanol-only-exposed group (~40% increase). (B) Comparable phenomenon observed in primary alveolar epithelial cells. Ethanol exposure decreased 25(OH)D3 by 50% when compared to controls. * indicates statistically significant difference from the untreated control, p value < 0.05. # indicates statistically significant difference from the untreated ethanol-exposed group, p value < 0.05.
Fig. 3.
Fig. 3.. 1,25(OH)2D3 levels in cellular lysate of DADS-treated ethanol-exposed BEAS-2B and primary alveolar epithelial cells.
(A) 24-hour exposure of BEAS-2B cells to 70-mM ethanol slightly reduced (non-significantly) 1,25(OH)2D3 protein levels (~25%) when compared with untreated controls. Treatment of ethanol-exposed cells with 10-μM DADS significantly restored 1,25(OH)2D3 levels to above control levels. This increase was significant when compared with the ethanol-only-exposed group. (B) Similar response observed in the primary alveolar epithelial cells. The ethanol-only-exposed group had a significant reduction (~55%) in levels of 1,25(OH)2D3 protein when compared with untreated controls. Additional treatment of ethanol-exposed cells with DADS restored 1,25(OH)2D3 protein levels to above control levels (24% increase). This increase was over 100% when compared with the untreated, ethanol-only-exposed group.
Fig. 4.
Fig. 4.. Cathelicidin/LL-37 levels in cellular lysate of DADS-treated ethanol-exposed BEAS-2B and primary alveolar epithelial cells.
(A) When BEAS-2B cells were treated with 70-mM ethanol for 24 hours, a reduction in cathelicidin/LL-37 levels, when compared with untreated controls, was observed (~45% reduction). Treatment of ethanol-only-exposed cells with 10-μM DADS restored cathelicidin/LL-37 levels to 1.4 ng/mL/mg, a 29% increase above that which was observed when compared with the untreated ethanol-exposed group. (B) Similar pattern of response observed in primary alveolar epithelial cells. Significant reduction of cathelicidin/LL-37 (~80%) protein levels was observed in primary alveolar epithelial cells that were exposed to ethanol. The effect was reversed by treatment of ethanol-only-exposed cells with DADS, with final levels at a higher value than observed with untreated controls. * indicates statistically significant difference from the untreated control, p value < 0.05. # indicates statistically significant difference from the untreated ethanol-exposed group, p value < 0.05.
Fig. 5.
Fig. 5.. Modulation of cathelicidin (CAMP) protein expression in cellular lysate of DADS-treated, ethanol-exposed BEAS-2B cells.
When BEAS-2B cells were treated with 70-mM ethanol for 24 hours, CAMP protein (19 kDa) was statistically diminished, compared to control. CAMP protein was significantly more abundant when the ethanol-exposed group was treated with 10-μM DADS. α-tubulin (49.5 kDa) was used as an internal control to normalize density of CAMP protein. * indicates statistically significant difference from the untreated control, p value < 0.05. # indicates statistically significant difference from the untreated ethanol-exposed group, p value < 0.05.
Fig. 6.
Fig. 6.. Dose-response relationship between cathelicidin/LL-37 levels in BEAS-2B cells and treatment with calcidiol or 25(OH)D3.
After 24-hour exposure, a different dose treatment from 5 ng/mL to 20 ng/mL of calcidiol increased cathelicidin/LL-37 levels at relatively comparable levels to those of untreated controls. The percentage increases in cathelicidin/LL-37 levels were ~23% and ~21% when BEAS-2B cells were treated with 5 ng/mL and 20 ng/mL of calcidiol, respectively. The highest cathelicidin/LL-37 protein level increase was observed when BEAS-2B cells were treated with 50 ng/mL (approximately 80% increase). However, treatment with 100 ng/mL calcidiol is probably cytotoxic, as it significantly reduced cathelicidin/LL-37 protein levels when compared with untreated controls and other groups treated with smaller doses. * indicates statistically significant difference compared with the untreated control, p value < 0.002. # indicates statistically significant difference compared with the untreated control, p value < 0.0001.
Fig. 7.
Fig. 7.. Time course experiment of calcidiol [25(OH)D3] and calcitriol [1, 25(OH)2D3] treatment in BEAS-2B cells.
Treatment with 50-ng/mL calcidiol increased cathelicidin/LL-37 levels after exposure for 6 hours, and reached the highest response at 10 to 12 hours post-treatment. After 10 to 12 hours of exposure to 50-ng/mL calcidiol, cathelicidin/LL-37 levels gradually declined to ~0.3 ng/mL/mg of total protein and remained relatively stable for up to 48 hours post-treatment. This trend was also observed in calcitriol (0.05 ng/mL) treatment. The highest peak of cathelicidin/LL-37 response to calcidiol and calcitriol was observed when BEAS-2B cells were treated for 12 hours, and this response remained relatively stable after 24 hours of exposure. Therefore, exposure duration for further experiments in this study was determined to be 10-hour and 24-hour exposure.
Fig. 8.
Fig. 8.. Cytotoxicity levels after 24-hour exposure of THP-1, BEAS-2B, and primary bronchial epithelial cells to ethanol and DADS.
(A) The cytotoxicity of 70-mM ethanol and 10-μM DADS in THP-1 cells after 24-hour exposure was expressed as % cytotoxicity. When compared with control levels, treatment with ethanol and DADS alone did not show any significant difference in % cytotoxicity. (B) Treatment with ethanol did not show any significant difference in % cytotoxicity in BEAS-2B, when compared to controls. However, treatment with DADS alone and combination treatment of ethanol and DADS slightly increased (non-significantly) levels of % cytotoxicity when compared with the control. (C) Combination treatment with ethanol and DADS in primary bronchial epithelial cells did not show any significant difference in cytotoxicity. However, treatment with either ethanol or DADS alone slightly increased levels of cytotoxicity but not to a statistically significant degree.
Fig. 9.
Fig. 9.. Cathelicidin/LL-37 levels in cellular lysate of DADS-treated ethanol-exposed THP-1, primary alveolar epithelial, and primary bronchial epithelial cells.
(A) 10-hour exposure to 70-mM ethanol reduced cathelicidin/LL-37 levels in THP-1 cells compared with controls (~50% reduction). Additional treatment of ethanol-exposed cells with 10-μM DADS restored cathelicidin/LL-37 levels to those of controls. This increase was statistically significant (over ~80% when compared with the untreated ethanol-exposed group). (B), (C) Comparable response observed in primary alveolar epithelial and primary bronchial epithelial cells. Exposure to ethanol decreased cathelicidin/LL-37 levels in primary alveolar epithelial and primary bronchial epithelial cells (75% and 40% reduction, respectively). Additional treatment of ethanol-exposed cells with DADS restored cathelicidin/LL-37 levels, which was statistically significant when compared to untreated ethanol-exposed group (60% and 45% increase, respectively). * indicates statistically significant difference from the untreated control, p value < 0.05. # indicates statistically significant difference from the untreated ethanol-exposed group, p value < 0.05.
Fig. 10.
Fig. 10.. Cathelicidin/LL-37 levels in cellular lysate of DADS-treated ethanol-exposed THP-1, primary alveolar epithelial, and primary bronchial epithelial cells.
(A) 24-hour exposure to 70-mM ethanol reduced cathelicidin/LL-37 levels in THP-1 cells when compared with controls (~65% reduction). Additional treatment of ethanol-exposed cells with 10-μM DADS restored cathelicidin/LL-37 levels to above control levels, a statistically significance increase of over 100% when compared with untreated ethanol-exposed cells. (B), (C) Similar response pattern observed in primary alveolar epithelial and primary bronchial epithelial cells. Cathelicidin/LL-37 levels were significantly reduced when cells were treated with ethanol (80% and 60% in primary alveolar and bronchial epithelial cells, respectively). Additional treatment of ethanol-exposed cells with DADS increased cathelicidin/LL-37 levels to above control levels, an increase of over 100% when compared to untreated ethanol-exposed cells. * indicates statistically significant difference from the untreated control, p value < 0.05. # indicates statistically significant difference from the untreated ethanol-exposed group, p value < 0.05.
Fig. 11.
Fig. 11.. Alcohol-metabolizing enzyme CYP2E1 and vitamin D-activating enzyme CYP27B1 in cellular lysate of DADS-treated ethanol-exposed BEAS-2B cells.
(A) Exposure to 70-mM ethanol for 24 hours increased CYP2E1 levels when compared with untreated controls. Additional treatment of ethanol-exposed cells with 10-μM DADS attenuated the effect, reducing CYP2E1 to levels comparable to those of untreated controls. (B) Opposite response observed in CYP27B1 levels. Exposure to ethanol significantly reduced CYP27B1 levels when compared with untreated controls. Additional treatment of ethanol-exposed cells with DADS restored CYP27B1 to levels comparable with those of untreated controls. * indicates statistically significant difference from the untreated control, p value < 0.05. # indicates statistically significant difference from the untreated ethanol-exposed group, p value < 0.05.

Similar articles

Cited by

References

    1. Baines M (1978). Detection and incidence of B and C vitamin deficiency in alcohol-related illness. Annals of Clinical Biochemistry, 15, 307–312. doi:10.1177/000456327801500173 - DOI - PubMed
    1. Bouillon R, De Groot LJ, & Jameson JL (2001). Vitamin D: From photosynthesis, metabolism, and action to clinical applications. Saunders; Retrieved from https://clinicalgate.com/vitamin-d-from-photosynthesis-metabolism-and-ac...
    1. Cesur Y, Caksen H, Gündem A, Kirimi E, & Odabaş D (2003). Comparison of low and high dose of vitamin D treatment in nutritional vitamin D deficiency rickets. Journal of Pediatric Endocrinology & Metabolism, 16, 1105–1109. - PubMed
    1. Cooke NE, & Haddad JG (1989). Vitamin D binding protein (Gc-globulin). Endocrine Reviews, 10, 294–307. doi:10.1210/edrv-10-3-294 - DOI - PubMed
    1. Dawson-Hughes B, Heaney RP, Holick MF, Lips P, Meunier PJ, & Vieth R (2005). Estimates of optimal vitamin D status. Osteoporosis International, 16, 713–716. doi:10.1007/s00198-005-1867-7 - DOI - PubMed

Publication types