. 2019 Jan 22;116(2):248-257.
doi: 10.1016/j.bpj.2018.11.3133. Epub 2018 Dec 6.

Fatty Acids Compete with Aβ in Binding to Serum Albumin by Quenching Its Conformational Flexibility

Affiliations

Fatty Acids Compete with Aβ in Binding to Serum Albumin by Quenching Its Conformational Flexibility

Cong Guo et al. Biophys J. .

Abstract

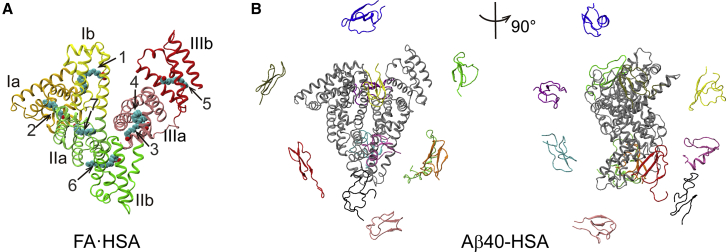
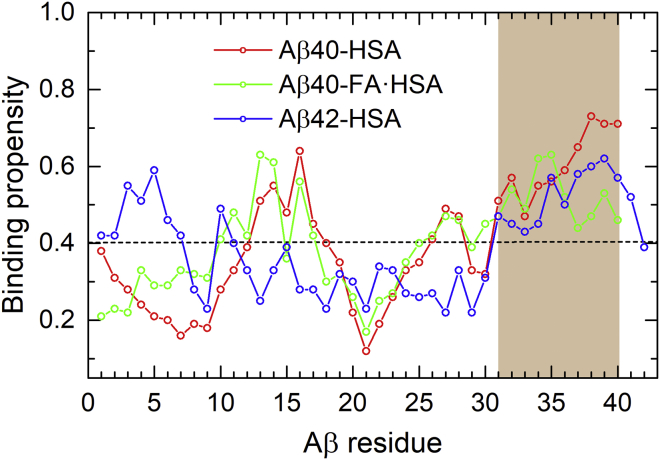
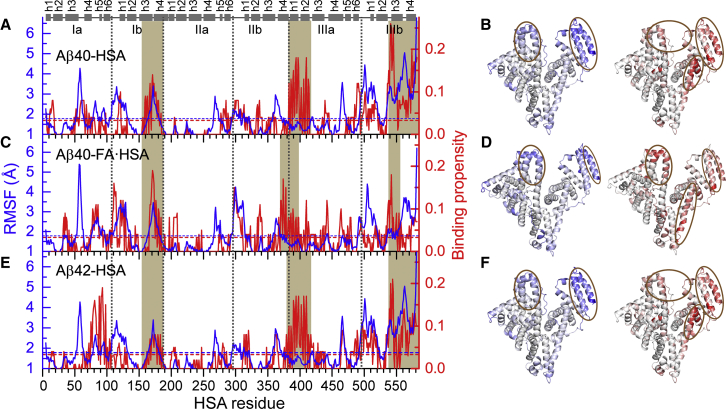
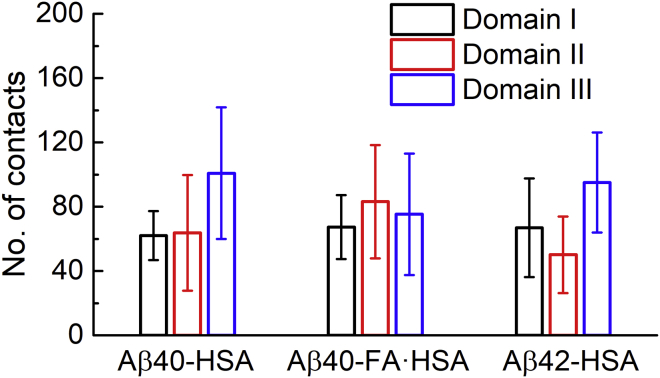
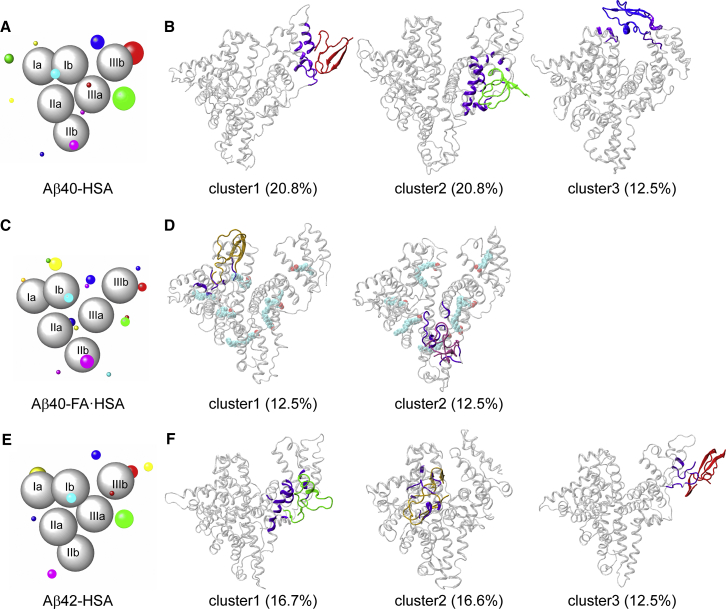
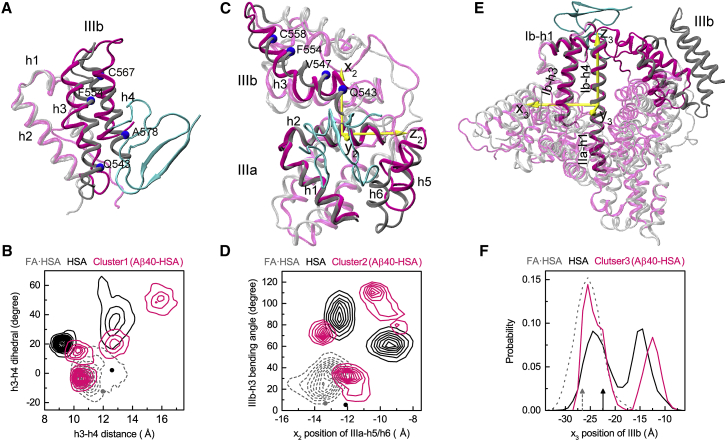
Human serum albumin (HSA) has been identified as an important regulator of amyloid-β (Aβ) fibrillization both in blood plasma and in cerebrospinal fluid. Fatty acids bind to HSA, and high serum levels of fatty acids increase the risk of Alzheimer's disease. In vitro, fatty-acid-loaded HSA (FA·HSA) loses the protective effect against Aβ fibrillization, but the mechanism underlying the interference of fatty acids on Aβ-HSA interactions has been unclear. Here, we used molecular dynamics simulations to gain atomic-level insight on the weak binding of monomeric Aβ40 and Aβ42 peptides with apo and FA·HSA. Consistent with recent NMR data, C-terminal residues of the Aβ peptides have the highest propensities for interacting with apo HSA. Interestingly, the Aβ binding residues of apo and FA·HSA exhibit distinct patterns, which qualitatively correlate with backbone flexibility. In FA·HSA, both flexibilities and Aβ binding propensities are relatively even among the three domains. In contrast, in apo HSA, domain III shows the highest flexibility and is the primary target for Aβ binding. Specifically, deformation of apo HSA creates strong binding sites within subdomain IIIb, around the interface between subdomains IIIa and IIIb, and at the cleft between domains III and I. Therefore, much like disordered proteins, HSA can take advantage of flexibility in forming promiscuous interactions with partners, until the flexibility is quenched by fatty-acid binding. Our work explains the effect of fatty acids on Aβ-HSA binding and contributes to the understanding of HSA regulation of Aβ aggregation.


Figures

Figure 1
Figure 1
Starting structures for MD simulations. (A) The crystal structure of HSA bound with seven palmitic acids (PDB: 1E7H) used for simulations of isolated and Aβ40-bound FA·HSA. Subdomains Ia, Ib, IIa, IIb, IIIa, and IIIb are shown in gold, yellow, light green, dark green, pink, and red, respectively; palmitic acids are shown as spheres. (B) Two views of the 12 starting positions of Aβ40 (in color) around HSA (in gray). To see this figure in color, go online.
Figure 2
Figure 2
HSA binding propensities of Aβ residues in three complexes: Aβ40-HSA (red), Aβ40-FA·HSA (green), and Aβ42-HSA (blue). The average binding propensity of the three systems is shown as a horizontal dashed line. The major HSA binding site identified by the MD simulations, consistent with NMR data (29), is highlighted by brown shading. To see this figure in color, go online.
Figure 3
Figure 3
An apparent correlation between backbone RMSFs of isolated apo or FA·HSA and Aβ binding propensities of HSA residues in three complex systems. (A), (C), and (E) display RMSFs (blue curves) and Aβ binding propensities (red curves) for Aβ40-HSA, Aβ40-FA·HSA, and Aβ42-HSA, respectively. Average values for each system are indicated by blue and red horizontal dashed lines; segments with high RMSFs or high binding propensities are highlighted by brown shading. Subdomain boundaries are indicated by vertical dashed lines; at the top, helices are represented by cylinders. (B), (D), and (F) display the RMSFs (left) and binding propensities (right) as mapped onto the crystal structures of apo or FA·HSA. Regions with high RMSFs and binding propensities are represented by intense blue and red colors, respectively, and highlighted by brown ovals. To see this figure in color, go online.
Figure 4
Figure 4
The average numbers of contacts formed by each HSA domain with Aβ in the three systems. To see this figure in color, go online.
Figure 5
Figure 5
Clustering of Aβ positions around HSA and representative binding poses in major clusters. (A, C, and E) Binding clusters represented by colored spheres with radii proportional to cluster sizes. HSA subdomains are shown as gray spheres. (B, D, and F) Representative snapshots of major clusters (i.e., those with cluster sizes exceeding 10% of total snapshots). HSA residues in contact with Aβ are colored in violet. To see this figure in color, go online.
Figure 6
Figure 6
Conformational changes of apo HSA accompanying Aβ40 binding to the three major sites. (A), (C), and (E) show the superposition of HSA in the representative poses (magenta) with the FA·HSA crystal structure (gray); Aβ40 is in cyan. (B), (D), and (F) show quantitative measurements of structural differences among Aβ40-bound, apo, and FA·HSA. In (B), the distance and relative tilt angle between the subdomain IIIb h3 and h4 helices are measured. The latter is defined as the dihedral formed by the Cα atoms of Q543, F554, C567, and A578. Dark and gray dots indicate values in the crystal structures. In (D), the movement of IIIa-h5/h6 relative to IIIa-h2 and the bending angle of IIIb-h3 are measured. The former is according to the position of IIIa-h5/h6 along the x2 axis, which is perpendicular to the helical axis of IIIa-h2 and points toward IIIb. The latter is defined as the angle between two vectors, one connecting Q543–V547 and the other connecting F554–C558. Dark and gray dots indicate values in the crystal structures. In (F), the movement of IIIb relative to the long helix connecting Ib-h4 and IIa-h1 is measured, as measured by the IIIb center of mass along the x3 axis. The latter is perpendicular to the helical axis of the long helix and points toward IIa-h3. Black and gray rrowsa indicate values in the crystal structures. To see this figure in color, go online.

References

    1. Nasica-Labouze J., Nguyen P.H., Derreumaux P. Amyloid β protein and Alzheimer’s disease: when computer simulations complement experimental studies. Chem. Rev. 2015;115:3518–3563. - PMC - PubMed
    1. Kuo Y.M., Emmerling M.R., Roher A.E. High levels of circulating Abeta42 are sequestered by plasma proteins in Alzheimer’s disease. Biochem. Biophys. Res. Commun. 1999;257:787–791. - PubMed
    1. Bohrmann B., Tjernberg L., Nordstedt C. Endogenous proteins controlling amyloid beta-peptide polymerization. Possible implications for beta-amyloid formation in the central nervous system and in peripheral tissues. J. Biol. Chem. 1999;274:15990–15995. - PubMed
    1. Biere A.L., Ostaszewski B., Selkoe D.J. Amyloid βετα-peptide is transported on lipoproteins and albumin in human plasma. J. Biol. Chem. 1996;271:32916–32922. - PubMed
    1. Kuo Y.M., Kokjohn T.A., Roher A.E. Amyloid-βετα peptides interact with plasma proteins and erythrocytes: implications for their quantitation in plasma. Biochem. Biophys. Res. Commun. 2000;268:750–756. - PubMed

Publication types

LinkOut - more resources