. 2019 Jan 10;176(1-2):361-376.e17.
doi: 10.1016/j.cell.2018.11.022. Epub 2018 Dec 20.

Coupled Single-Cell CRISPR Screening and Epigenomic Profiling Reveals Causal Gene Regulatory Networks

Affiliations

Coupled Single-Cell CRISPR Screening and Epigenomic Profiling Reveals Causal Gene Regulatory Networks

Adam J Rubin et al. Cell. .

Abstract

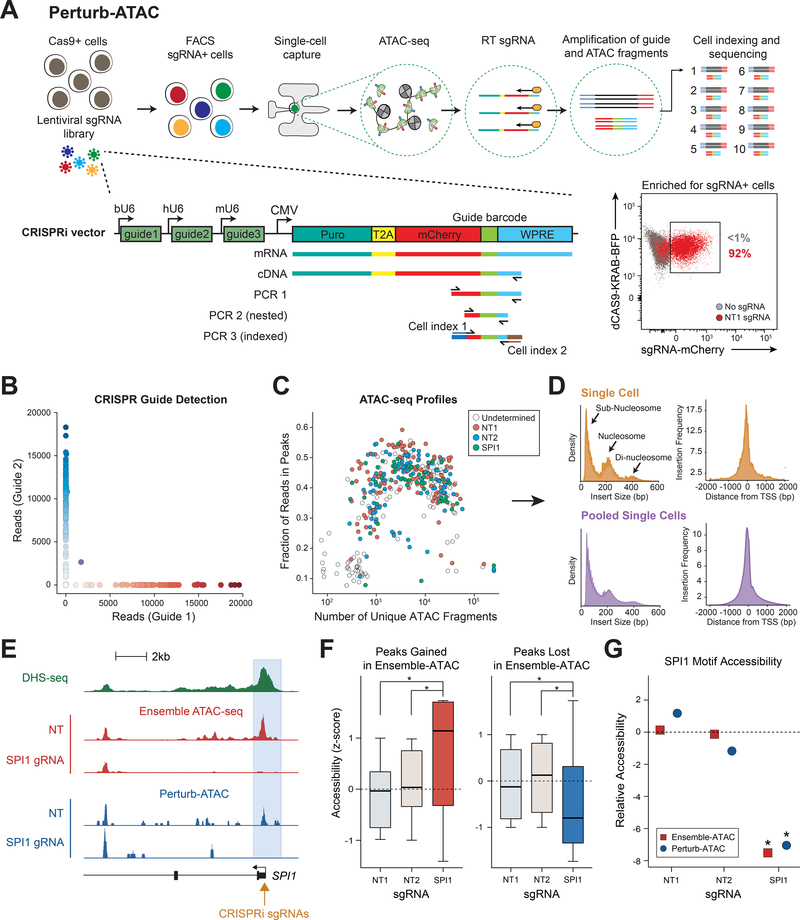
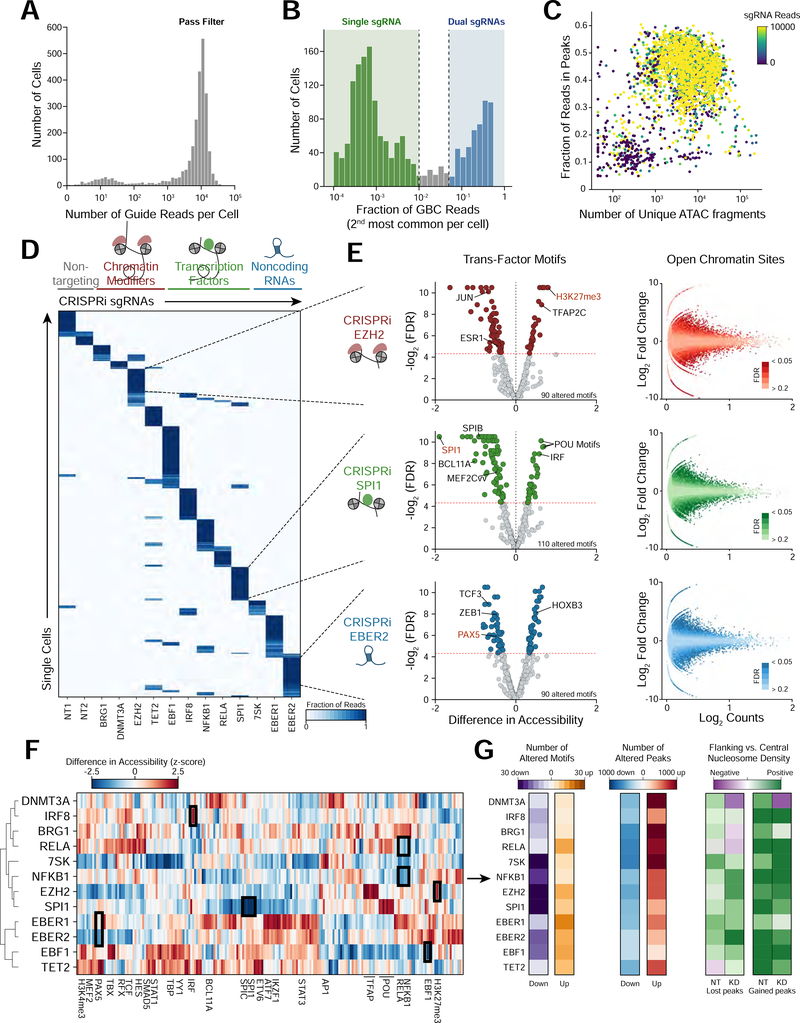
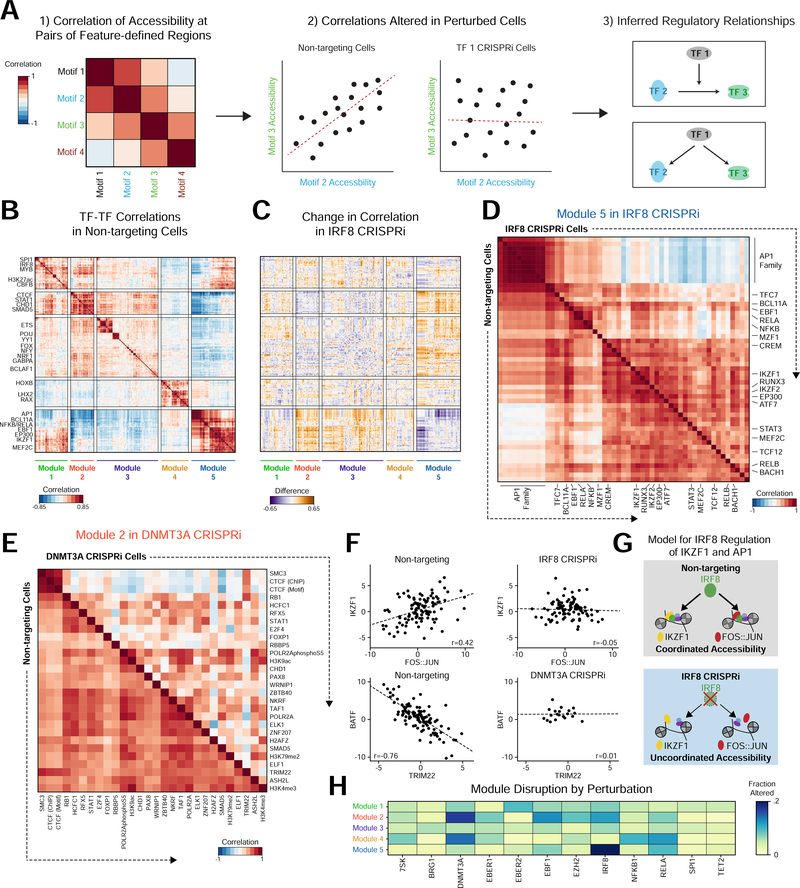
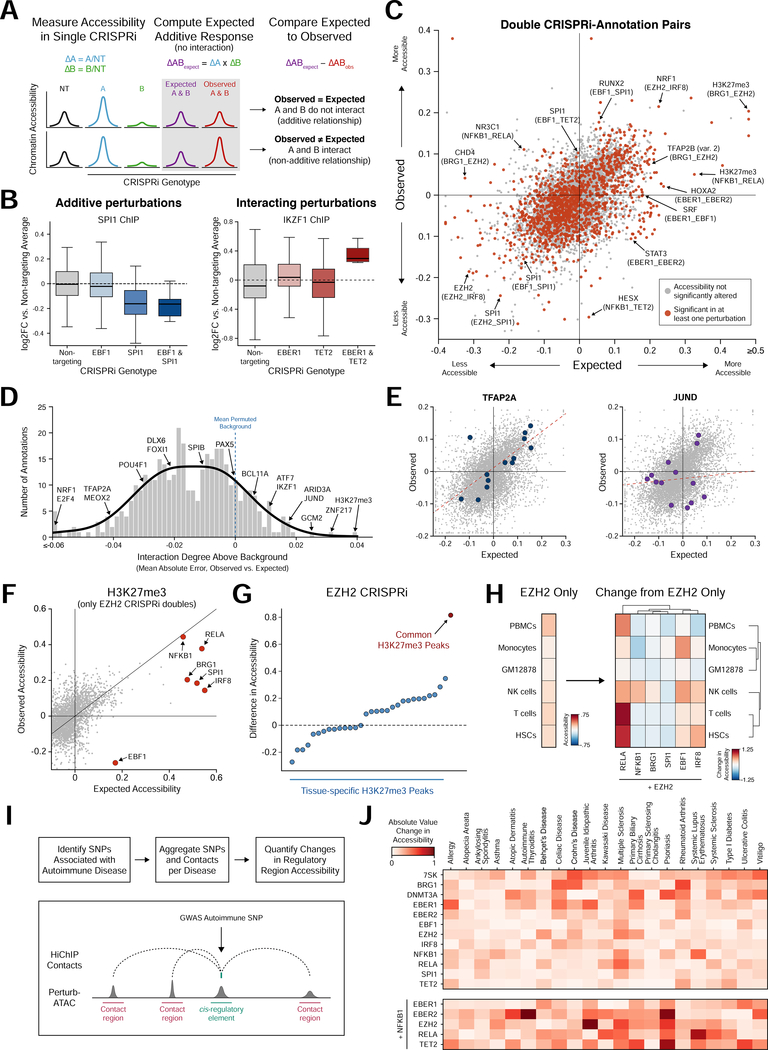
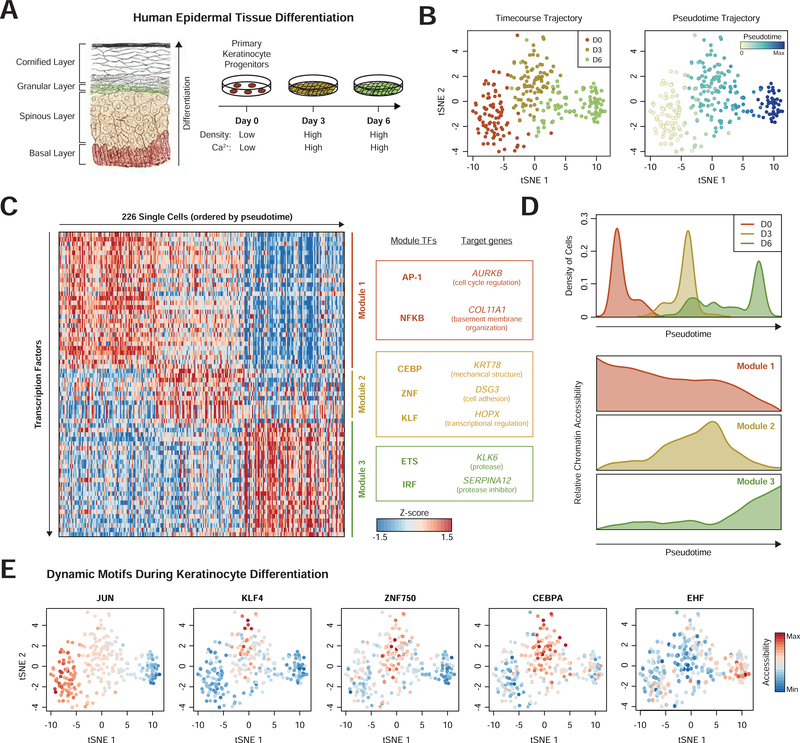
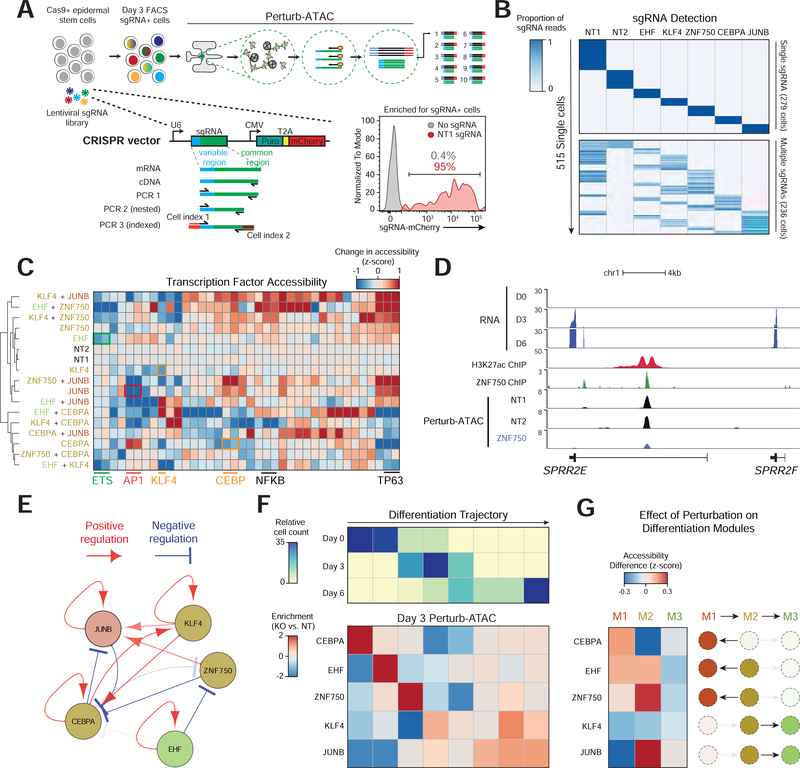
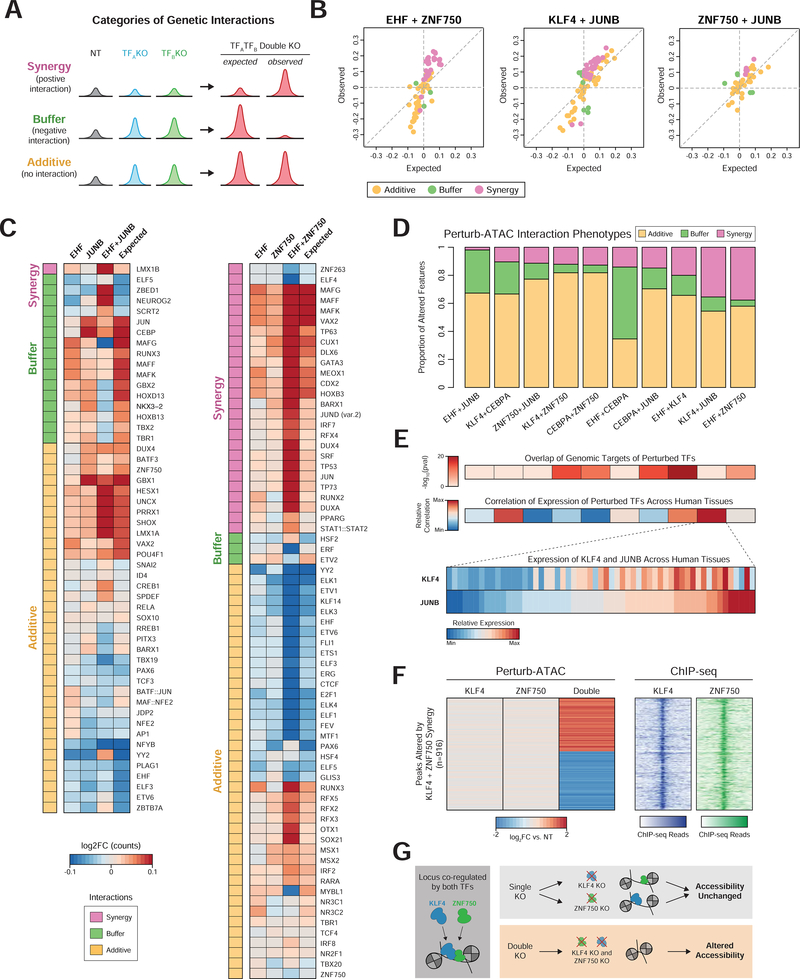
Here, we present Perturb-ATAC, a method that combines multiplexed CRISPR interference or knockout with genome-wide chromatin accessibility profiling in single cells based on the simultaneous detection of CRISPR guide RNAs and open chromatin sites by assay of transposase-accessible chromatin with sequencing (ATAC-seq). We applied Perturb-ATAC to transcription factors (TFs), chromatin-modifying factors, and noncoding RNAs (ncRNAs) in ∼4,300 single cells, encompassing more than 63 genotype-phenotype relationships. Perturb-ATAC in human B lymphocytes uncovered regulators of chromatin accessibility, TF occupancy, and nucleosome positioning and identified a hierarchy of TFs that govern B cell state, variation, and disease-associated cis-regulatory elements. Perturb-ATAC in primary human epidermal cells revealed three sequential modules of cis-elements that specify keratinocyte fate. Combinatorial deletion of all pairs of these TFs uncovered their epistatic relationships and highlighted genomic co-localization as a basis for synergistic interactions. Thus, Perturb-ATAC is a powerful strategy to dissect gene regulatory networks in development and disease.

Keywords: ATAC-seq; CRISPR; chromatin accessibility; epigenomics; pooled screens; single-cell genomics.


Figures

Figure 1.
Figure 1.. Perturb-ATAC identifies sgRNA barcodes and expected chromatin phenotypes in single cells.
(a) Schematic of Perturb-ATAC protocol, lentiviral construct, and sequencing library generation for sgRNA detection. (b) Scatter plot of guide barcode (GBC) reads from pool of cells transduced with one of two constructs. (c) Scatter plot of ATAC fragments and the fraction of ATAC fragments in peak regions for each cell. Colors indicate GBC detection in each cell. (d) Histograms of ATAC fragment size distribution indicating expected nucleosome phasing (left) and relative frequency of ATAC insertions at transcription start sites (right). (e) Genomic locus of SPI1 gene, indicating DNase I hypersensitivity sequencing, bulk ATAC-seq, and Perturb-ATAC-seq. The SPI1 promoter region exhibits selective loss of accessibility in cells expressing SPI1 sgRNA. (f) Accessibility in merged single cells of individual genomic regions altered in bulk ATAC-seq. * indicates p-value < 1e−3 by KS-test. (g) Relative accessibility of SPI1 motif-containing regions (z-score of SPI1 motif versus all other genomic features). * indicates false discovery rate < 1e−3 by permutation test.
Figure 2.
Figure 2.. Perturb-ATAC screen for control of accessibility landscape by transcription factors, long non-coding RNAs, and chromatin regulators.
(a) Histogram of total guide barcode (GBC) reads per cell. (b) Histogram of the second most common GBC identified in each cell. Cells on the low end of the distribution express a single guide RNA, while cells on the high end express two guide RNAs. (c) Scatter plot of ATAC fragments and fraction of fragments in peak regions. Cells are colored by GBC read count. (d) Heatmap of cells (rows) versus GBCs (columns) indicating proportion of reads associated with each barcode. (e) Left: volcano plots showing significantly altered genomic features between cells carrying non-targeting (NT) guides and guides targeting EZH2, SPI1, and EBER2 (FDR <= 0.025). Right: scatter plots of mean accessibility versus accessibility fold change of individual genomic peaks. (f) Heatmap of perturbed factors (rows) versus genomic annotations (columns) indicating difference in accessibility between perturbed and NT control cells. Only annotations significantly altered in at least one perturbation are shown. (g) Heatmaps indicating number of significantly altered features (left, absolute log2FC >= 1.5, mean reads/cell >= 0.4), number of altered genomic regions (middle, absolute chromVAR deviation Z >= 0.75, FDR <= .05), or quantification of the ratio of flanking to central nucleosome occupancy at altered peaks (right) for each single perturbation.
Figure 3.
Figure 3.. Perturbations influence inter-cellular variability and correlated activity across features.
(a) Example workflow identifying genomic features with correlated activity across cells. Left: heatmap indicating correlation of motif activity across cells. Middle: Comparing non-targeting (NT) control cells to perturbed cells identifies motif pairs that change in correlation as a result of perturbation. Right: Functional relationships constrain hypothetical regulatory networks. (b) Heatmap of Pearson correlations between features in NT cells. (c) Heatmap displaying the difference in correlations between NT and IRF8 knockdown cells. (d) Heatmap of Module 5 feature correlations in NT (bottom half) and IRF8 (top half) knockdown cells. (e) Heatmap displaying Module 2 feature correlations in NT cells (bottom half) and DNMT3A (top half) knockdown cells. (f) Scatter plots of accessibility for cells with line of linear best fit demonstrating correlation in specific conditions. (g) Hypothetical model of IRF8 co-factor activity with AP-1 and IKZF1. (h) Heatmap of the fraction of altered feature-feature correlations within modules by perturbation, showing specific effects on particular modules in different perturbations.
Figure 4.
Figure 4.. Epistasis analysis identifies functional interaction between a broadly active chromatin regulator and lineage-specific transcription factors.
(a) Schematic of calculation of expected accessibility in doublé knockdown based on additive model of each single knockdown. (b) Distribution of accessibility at SPI1 binding sites (left) and IKZF1 binding sites (right) for individual cells in single or double knockdown conditions. (c) Scatter plot of observed versus expected accessibility for epistatic interactions. Each dot represents a single annotation in the pairing of two perturbed factors. Dots highlighted in red indicate significantly altered activity in either single or doublé perturbation. (d) Histogram of background-corrected interaction degree for each feature. Background distribution calculated by permuting single and doublé knockdown associations. (e) Scatter plots of observed versus expected interactions, highlighting TFAP2A (relatively low interaction degree) and JUND (relatively high interaction degree). (f) Scatter plot of observed versus expected change in accessibility at H3K27me3-marked regions in cells depleted of EZH2 and one other factor. (g) Scatter plot of change in accessibility in EZH2 knockdown cells for subsets of H3K27me3 peaks. Common peaks have H3K27me3 marks across a majority of cell types. (h) Left: heatmap indicating change in accessibility due to EZH2 depletion at regions marked by H3K27me3 in GM12878 and exhibiting H3K27ac mark in each specific other cell type. Right: heatmap indicating change in accessibility of the same regions for cells simultaneously depleted of EZH2 and a TF. (i) Workflow to aggregate SNPs associated with autoimmune diseases with 3D chromatin contact regions. (j) Heatmap of the absolute change in accessibility for the SNP-contact feature set of each autoimmune disease and perturbation.
Figure 5.
Figure 5.. Modules of transcription factors exhibit distinct temporal activity in epidermal differentiation.
(a) Schematic of human epidermis and cell culture model of epidermal differentiation (Gray, Henry, 1918). (b) tSNE projection of TF feature activity for epidermal cells labeled by differentiation day (left) or pseudotime (right). (c) Heatmap of cells ordered by pseudotime (columns) versus TF feature activity (filtered for motifs with dynamic activity). Modules represent collections of TF features with similar temporal profiles. Target genes are proximal (<50kb) to genomic regions associated with that module. (d) Top: histogram of pseudotime values for cells from each day of differentiation. Bottom: average accessibility of each module identified in (c). (e) tSNE projectionsshowing TF activity dynamics during differentiation.
Figure 6.
Figure 6.
Multiplex knockout screen of transcription factors in differentiation. (a) Schematic of sgRNA expression vector and library amplification for direct sequencing readout of sgRNA identity. (b) Heatmap of sgRNAs (columns) versus single cells (rows) indicating the proportion of all reads associated with each sgRNA. (c) Heatmap of genetic perturbations versus TF features, indicating activity of TF feature in perturbed relative to non-targeting (NT) cells. Similar motifs from AP-1, FOX, and ETS families were merged. (d) Genomic locus of SPRR2E gene. Perturb-ATAC tracks show signal from merged single cells receiving each sgRNA. H3K27ac and ZNF750 ChIP-seq tracks in day 3 differentiating keratinocytes (from Rubin et al. 2017). (e) Representation of positive and negative regulation between targeted genes and sets of genomic regions. Arrows are shown with FDR < 0.25 and decreasing transparency is associated with lower FDR. (f) Top: heatmap displaying the frequency of cells in eight bins representing progression along differentiation trajectory. Bottom: heatmap indicating the enrichment or depletion of cells in each differentiation bin compared to NT cells. For each perturbation, a custom reduced dimensionality space was created to highlight altered features. (g) Heatmap of perturbations (rows) versus modules (columns). For each module, the mean change in feature activity is shown.
Figure 7.
Figure 7.. Pairs of perturbations exhibit distinct patterns of epistatic interactions.
(a) Example representativa peak signal for each category of interaction. (b) Scatter plots of observed versus expected (based on additive model) accessibility in double knockout cells. Only features significantly altered in either single or double knockout conditions are plotted. Colors indicate category of interaction. (c) Left: heatmap of altered activity of features (rows) in EHF, JUNB, or simultaneous EHF and JUNB knockouts, along with their expected activity. Right: Similar to left, for EHF and ZNF750 knockouts. (d) Proportion of interacting features in each category. Each column represents a pair of targeted genes. Only features altered in either the single or double perturbation are considered. (e) Top: heatmaps indicating significance of genomic overlap or correlation of gene expression for pairs of TFs corresponding to pairs displayed in (d). Bottom: heatmap displaying relative RNA expression of KLF4 and JUNB across tissues from the Roadmap Epigenomics Project. (f) Left: heatmap indicating relative accessibility of genomic regions (rows) with synergistic behavior in KLF4 and ZNF750 double knockout cells. Right: heatmap of ChlP-seq signal for KLF4 and ZNF750 at regions displayed on left. (g) Model of KLF4 and ZNF750 redundancy in maintaining accessibility at co-occupied loci.

Similar articles

Cited by

References

    1. Adamson B, Norman TM, Jost M, Cho MY, Nuñez JK, Chen Y, Villalta JE, Gilbert LA, Horlbeck MA, Hein MY, et al. (2016). A Multiplexed Single-Cell CRISPR Screening Platform Enables Systematic Dissection of the Unfolded Protein Response. Cell 167, 1867–1882.e21. - PMC - PubMed
    1. Adamson B, Norman TM, Jost M, and Weissman JS (2018). Approaches to maximize sgRNA-barcode coupling in Perturb-seq screens. BioRxiv 298349.
    1. Arrand JR, Young LS, and Tugwood JD (1989). Two families of sequences in the small RNA-encoding region of Epstein-Barr virus (EBV) correlate with EBV types A and B. J. Virol 63, 983–986. - PMC - PubMed
    1. Bao X, Rubin AJ, Qu K, Zhang J, Giresi PG, Chang HY, and Khavari PA (2015). A novel ATAC-seq approach reveals lineage-specific reinforcement of the open chromatin landscape via cooperation between BAF and p63. Genome Biol. 16, 284. - PMC - PubMed
    1. Boettcher M, Tian R, Blau JA, Markegard E, Wagner RT, Wu D, Mo X, Biton A, Zaitlen N, Fu H, et al. (2018). Dual gene activation and knockout screen reveals directional dependencies in genetic networks. Nat. Biotechnol 36, 170–178. - PMC - PubMed

Publication types

MeSH terms