. 2019 Jan 24;176(3):564-580.e19.
doi: 10.1016/j.cell.2018.11.011. Epub 2018 Dec 20.

p53 Represses the Mevalonate Pathway to Mediate Tumor Suppression

Affiliations

p53 Represses the Mevalonate Pathway to Mediate Tumor Suppression

Sung-Hwan Moon et al. Cell. .

Abstract

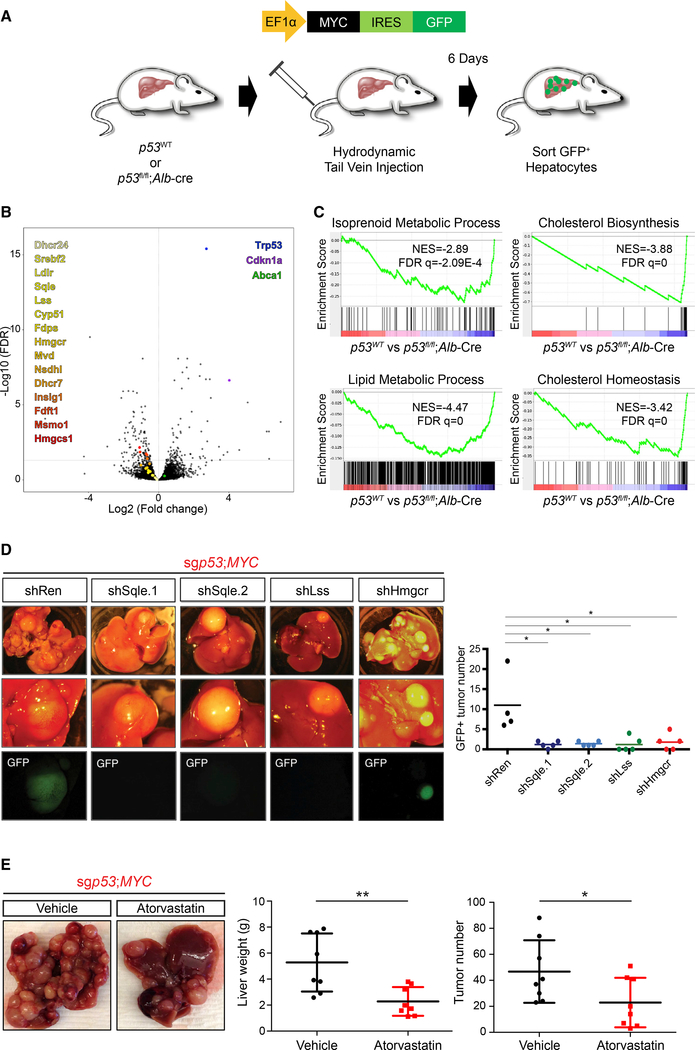
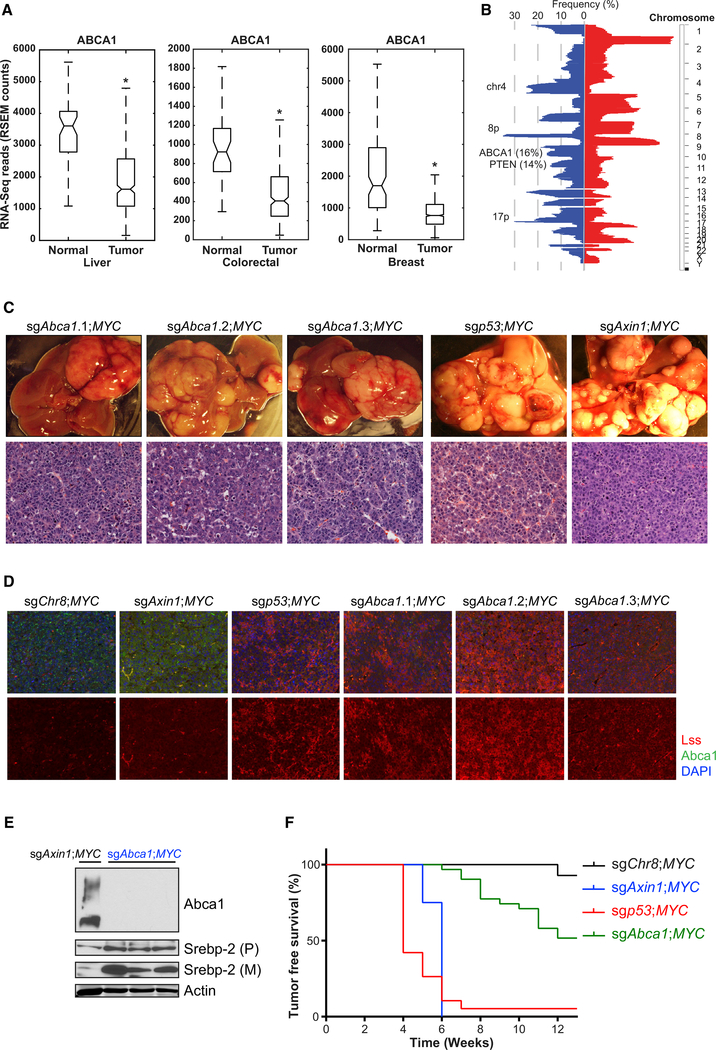
There are still gaps in our understanding of the complex processes by which p53 suppresses tumorigenesis. Here we describe a novel role for p53 in suppressing the mevalonate pathway, which is responsible for biosynthesis of cholesterol and nonsterol isoprenoids. p53 blocks activation of SREBP-2, the master transcriptional regulator of this pathway, by transcriptionally inducing the ABCA1 cholesterol transporter gene. A mouse model of liver cancer reveals that downregulation of mevalonate pathway gene expression by p53 occurs in premalignant hepatocytes, when p53 is needed to actively suppress tumorigenesis. Furthermore, pharmacological or RNAi inhibition of the mevalonate pathway restricts the development of murine hepatocellular carcinomas driven by p53 loss. Like p53 loss, ablation of ABCA1 promotes murine liver tumorigenesis and is associated with increased SREBP-2 maturation. Our findings demonstrate that repression of the mevalonate pathway is a crucial component of p53-mediated liver tumor suppression and outline the mechanism by which this occurs.

Keywords: ABCA1; SREBP-2; cancer metabolism; mevalonate pathway; p53; tumor suppression.


Conflict of interest statement

DECLARATION OF INTERESTS

C.P. is a member of the scientific advisory board of Aileron Therapeutics. S.W.L. is a founder and scientific advisory board member of Mirimus, Inc., Blueprint Medicines, and ORIC Pharmaceuticals. S.W.L. is also a scientific advisory board member of Constellation Pharmaceuticals and PMV Pharmaceuticals.

Figures

Figure 1.
Figure 1.. Wild-Type p53 and the Mevalonate Pathway Are Inversely Correlated across Multiple Tumor Types and Species
(A–C) SK-HEP-1 cells (A), mouse embryonic fibroblasts (MEFs; wild-type [WT] and p53−/−) (B), and HCT116 WT (p53+/+) and p53−/− cells (C) were treated with either DMSO or Nutlin-3 for 24 hr, and expression of the mevalonate pathway genes was assessed by qRT-PCR. Error bars represent SD of the mean (n = 3, *p < 0.01). (D) Gene ontology analysis of gene sets that were significantly downregulated upon p53 restoration in murine liver carcinomas (left). Gene set enrichment analysis (GSEA) was used to evaluate changes in the gene signature of cholesterol synthesis upon p53 restoration (right). (E) Mouse liver progenitor cells transduced in vitro with H-rasV12 linked to the tetracycline transactivator protein tTA (tet off) and tetracycline responsive p53 shRNA were cultured in the presence of doxycycline to restore p53 expression and harvested on days 0, 4, and 8. Expression of the mevalonate pathway genes was assessed by qRT-PCR (n = 3). Error bars represent SDs of the means. (F) A condensed mevalonate pathway gene expression signature value was calculated for each line in the CCLE. The mevalonate pathway signature values were compared among all p53WT (n = 333), p53null (n = 151), and p53 missense (n = 373) lines (mean ± SEM). p = 0.0059 as determined by an unpaired two-tailed t test.
Figure 2.
Figure 2.. p53 Inhibits SREBP-2 Maturation under Low-Sterol Conditions
(A) HCT116 cells were cultured for 24 hr in medium plus fetal bovine serum (FBS; gray bars), delipidated FBS (DL-FBS; black bars), or delipidated FBS plus 25-hydroxycholesterol (DL-FBS+25-HC; white bars). Expression of HMGCR, HMGCS1, and SREBF-2 was assessed by qRT-PCR (n = 3; *p < 0.01; n.s., not significant). Error bars represent SD of the means. (B) HCT116 cells were grown on Matrigel to form spheroids. The spheroids were harvested on day 3 (gray bars) and day 9 (black bars). mRNA expression of HMGCR and SREBF-2 genes was assessed by qRT-PCR (n = 3, *p < 0.01). Error bars represent SDs of the means. (C) HCT116 cells were cultured in sterol-depleted medium for 24 hr and subjected to ChIP analysis (n = 2, *p < 0.03). HMGCR (TSS −1,100) is a negative control region for SREBP-2 binding. HMGCR (TSS −150), HMGCS1 (TSS −115), and FDPS (TSS −260) correspond to known sterol regulatory elements (SREs) in the respective promoter genes. Error bars represent SDs of the means. (D–H) Cells were grown under the indicated conditions prior to lysis and immunoblotting analysis to detect full-length precursor (P) and mature (M) SREBP-2 polypeptides, p53, or actin. (D) HCT116 cells were cultured for 24 hr as in (A) in FBS (1), DL-FBS (2), or DL-FBS+25-HC (3). (E) HCT116 cells were transfected with control luciferase (Luc) siRNA or two p53 siRNAs and sterol-starved for 24 hr. (F) HCT116 spheroids on day 9 as in (B) were subjected to immunoblot analysis. (G) SK-HEP-1 cells were cultured in sterol-depleted medium along with either DMSO or Nutlin-3 for 24 hr. (H) Hep3B-4Bv cells expressing temperature-sensitive mutant p53 and the parental Hep3B cells were cultured for 72 hr at either 37°C or 32°C.
Figure 3.
Figure 3.. The Mevalonate Pathway Is Activated in p53null Cancer Cells
(A) Metabolomics analyses of mevalonate pathway intermediates isolated from SK-HEP-1 cells with WT p53 or derived p53null cells was performed via ultra-high pressure liquid chromatography coupled to mass spectrometry (UHPLC-MS) coupled to electrospray ionization (ESI) and atmospheric pressure chemical ionization (APCI) (n = 3, mean ± SEM). (B) HCT116 cells were cultured in sterol-depleted medium and harvested at the indicated time points for flow cytometry analysis. The proportion of cells in S phase was quantitated and plotted (n = 3, *p < 0.01). Error bars represent SDs of the means. (C) HCT116 cells were cultured in sterol-depleted medium and harvested at the indicated time points prior to immunoblot analysis as above. (D) HCT116 cells were cultured for 24 hr in sterol-depleted medium supplemented as indicated: non-treated (NT), simvastatin, mevalonic acid 5-phosphate (MVAP), geranylgeranyl pyrophosphate (GGPP), and GGTI-2133. The proportions of S phase cells were averaged (n = 4, *p < 0.001 for NT versus simvastatin or GGTI-2133, **p < 0.001 for simvastatin versus supplementation of metabolites). Error bars represent SDs of the means. (E) SK-HEP-1 cells were transfected with negative control or HMGCR siRNA, sterol-starved for 24 hr, and harvested for flow cytometry analysis. The proportion of the cells in S phase was quantitated and plotted (n = 2). Error bars represent SDs of the means.
Figure 4.
Figure 4.. p53-Mediated ABCA1 Expression Inhibits SREBP-2 Maturation
(A) SK-HEP-1 cells were transfected with negative control siRNA or three ABCA1 siRNAs, sterol-starved for 12 hr, lysed, and subjected to immunoblot analysis. (B) SK-HEP-1 p53null cells were transfected with negative control siRNA or ABCA1 siRNAs, sterol-starved, and harvested at the indicated time points for immunoblot analysis. (C) SK-HEP-1 cells were treated with either DMSO or Nutlin-3 for 24 hr and then harvested for immunoblot analysis. (D) SK-HEP-1 and HCT116 cells were treated with either DMSO or Nutlin-3 for 24 hr, and ABCA1 mRNA expression levels were assessed by qRT-PCR (n = 3). Error bars represent SDs of the means. (E) SK-HEP-1 cells were treated with Nutlin-3 and subjected to ChIP analysis to examine p53 occupancy at the ABCA1 promoter (n = 2). See Figure S4A for ChIP analysis with HCT116 cells. Error bars represent SDs of the means. (F) SK-HEP-1 cells were transfected with control siRNA or two p53 siRNAs (left). p53 was ablated in SK-HEP-1 (center) and HCT116 (right) cells. ABCA1 mRNA expression levels were assessed by qRT-PCR (n = 3). Error bars represent SDs of the means. (G) Expression of ABCA1 mRNA in human liver tumors with WT p53 (n = 133) and missense mutations (n = 40) was compared (p < 8 × 10⁻⁵). (H) SK-HEP-1 parental (WT p53) and p53null cells were cultured in sterol-depleted medium and harvested at the indicated time points for immunoblot analysis. (I) SK-HEP-1 p53null cells were transfected with negative control siRNA or ABCA1 siRNAs and sterol-starved for 8 hr in the presence of the RXR agonist LG100268 and then harvested for immunoblot analysis. (J) Analysis of CCLE data comparing the mevalonate pathway gene expression signature in cells with high levels of ABCA1 mRNA versus cells with low levels of ABCA1 mRNA (false discovery rate [FDR]-adjusted p < 2 × 10⁻¹²).
Figure 5.
Figure 5.. Mevalonate Pathway Gene Expression Is Activated Selectively in p53null Murine Liver Tumors
(A) Diagram depicting generation of liver tumor models using HTVI to deliver a transposon expressing MYC to the liver together with a CRISPR plasmid that directly targets p53 or Axin1. (B) Representative images of liver tumors from sgp53 and sgAxin1 mice, stained with H&E. (C–F) Three independent cancer cell lines were derived from sgp53;MYC and sgAxin1;MYC liver tumors. (C and D) RNA from sgp53;MYC (red bars) and sgAxin1;MYC (blue bars) liver tumor cell lines was obtained, and expression of mevalonate pathway genes (C) and p53, Cdkn1a, and Abca1 (D) was assessed by qRT-PCR (n = 3). Error bars represent SDs of the means. (E) Cell lines were treated with adriamycin (200 ng/mL) for 6 hr to induce p53 expression, lysed, and immunoblotted as indicated. (F) Early passage sgp53;MYC and sgAxin1;MYC tumor cell lines were cultured in medium with FBS or DL-FBS for 24 hr prior to immunoblot analysis. (G) Representative images of liver tumors from sgp53 and sgAxin1 mice, stained for Abca1.
Figure 6.
Figure 6.. RNAi of the Mevalonate Pathway Genes or Atorvastatin Treatment Selectively Restricts Tumor Initiation by p53 Loss
(A–C) p53 suppresses the mevalonate pathway in response to oncogenic stress in the normal liver. (A) Schematic of the experiment. (B) Genome-wide analysis of differential expression of p53WT hepatocytes compared with p53null hepatocytes. The volcano plot depicts the significance (FDR-adjusted p value) and magnitude of difference (fold change). The dashed line indicates the threshold of the FDR-adjusted p value < 0.05. (C) GSEA was used to evaluate how p53 affects the gene signatures of cholesterol, isoprenoid, and lipid metabolism upon oncogenic stress (p53WT, n = 4; p53null, n = 3). (D) Representative images of sgp53;MYC tumors (top), single magnified tumors (center), and GFP signals in tumors (bottom). Also shown is quantification of GFP-positive liver tumors (right). Bars represent the mean of independent mice (n = 4–5). (E) Representative images of sgp53;MYC HCC tumors from mice pretreated with vehicle or atorvastatin. Also shown is quantification of the liver weight and tumors (right). Bars represent the mean of independent mice (n = 8–10).
Figure 7.
Figure 7.. Abca1 Suppresses Liver Tumorigenesis
(A) Expression of ABCA1 mRNA in normal tissues and tumors from TCGA-Liver Hepatocellular Carcinoma (normal [n = 50] versus tumors [n = 371]), TCGA-Colon Adenocarcinoma (normal [n = 41] versus tumors [n = 272]), and TCGA-Breast Invasive Carcinoma (normal [n = 110] versus tumors [n = 1037]). The central line represents the median of gene expression (FDR-adjusted p < 4 × 10⁻¹¹, p < 2 × 10⁻⁹, and p < 8 × 10⁻¹⁴, respectively). (B) Frequency plot of chromosomal gains and losses in HCC profile derived from TCGA. Prototypical alterations (17p, 8p, and chromosome 4 loss) are annotated. The relative frequency of deletions at the ABCA1 (9q31.1) and PTEN (10q23.31) loci are also annotated. (C) Representative images of sgAbca1;MYC tumors from three independent sgRNAs targeting Abca1 (top) and associated H&E stains of tumors (bottom). sgp53;MYC and sgAxin1;MYC tumors served as controls. (D) Representative images of lanosterol synthase (Lss) staining in liver tumors from sgChr8;MYC, sgAxin1;MYC, sgp53;MYC, and sgAbca1.1–3;MYC. (E) Early passage sgAxin1;MYC and three independent sgAbca1;MYC tumor cell lines derived from tumors in (C) were subjected to immunoblot analysis. (F) Kaplan-Meier survival curves of C57BL/6 mouse HTVI with transposons expressing MYC and a CRISPR plasmid targeting Chromosome 8 (control) (n = 14), Axin1 (n = 4), p53 (n = 15), or Abca1 (n = 32 from six independent sgRNAs). A significant difference in cumulative survival can be seen between all groups except between sgAxin1 and sgp53 (p = 0.279). sgAbca1 versus sgChr8, p = 0.0088. All other comparisons, p < 0.0001.

References

    1. Adams CM, Reitz J, De Brabander JK, Feramisco JD, Li L, Brown MS, and Goldstein JL (2004). Cholesterol and 25-hydroxycholesterol inhibit activation of SREBPs by different mechanisms, both involving SCAP and Insigs. J. Biol. Chem 279, 52772–52780. - PubMed
    1. Alfaqih MA, Allott EH, Hamilton RJ, Freeman MR, and Freedland SJ (2017). The current evidence on statin use and prostate cancer prevention: are we there yet? Nat. Rev. Urol 14, 107–119. - PMC - PubMed
    1. Allen MA, Andrysik Z, Dengler VL, Mellert HS, Guarnieri A, Freeman JA, Sullivan KD, Galbraith MD, Luo X, Kraus WL, et al. (2014). Global analysis of p53-regulated transcription identifies its direct targets and unexpected regulatory mechanisms. eLife 3, e02200. - PMC - PubMed
    1. Barretina J, Caponigro G, Stransky N, Venkatesan K, Margolin AA, Kim S, Wilson CJ, Lehár J, Kryukov GV, Sonkin D, et al. (2012). The Cancer Cell Line Encyclopedia enables predictive modelling of anticancer drug sensitivity. Nature 483, 603–607. - PMC - PubMed
    1. Bellomo C, Caja L, Fabregat I, Mikulits W, Kardassis D, Heldin CH, and Moustakas A (2018). Snail mediates crosstalk between TGFβ and LXRα in hepatocellular carcinoma. Cell Death Differ. 25, 885–903. - PMC - PubMed

Publication types