. 2019 Jan 10;176(1-2):334-347.e12.
doi: 10.1016/j.cell.2018.11.010. Epub 2018 Dec 20.

Fibrinogen-like Protein 1 Is a Major Immune Inhibitory Ligand of LAG-3

Affiliations

Fibrinogen-like Protein 1 Is a Major Immune Inhibitory Ligand of LAG-3

Jun Wang et al. Cell. .

Abstract

Lymphocyte-activation gene 3 (LAG-3) is an immune inhibitory receptor, with major histocompatibility complex class II (MHC-II) as a canonical ligand. However, it remains controversial whether MHC-II is solely responsible for the inhibitory function of LAG-3. Here, we demonstrate that fibrinogen-like protein 1 (FGL1), a liver-secreted protein, is a major LAG-3 functional ligand independent from MHC-II. FGL1 inhibits antigen-specific T cell activation, and ablation of FGL1 in mice promotes T cell immunity. Blockade of the FGL1-LAG-3 interaction by monoclonal antibodies stimulates tumor immunity and is therapeutic against established mouse tumors in a receptor-ligand inter-dependent manner. FGL1 is highly produced by human cancer cells, and elevated FGL1 in the plasma of cancer patients is associated with a poor prognosis and resistance to anti-PD-1/B7-H1 therapy. Our findings reveal an immune evasion mechanism and have implications for the design of cancer immunotherapy.

Keywords: FGL1; LAG-3; cancer; immunology; immunotherapy; tumor immune-evasion mechanism.


Conflict of interest statement

Declaration of Interests:

LC is a consultant/advisory board member and receives consulting fees from Pfizer, Vcanbio, and GenomiCare; is a scientific founder of NextCure and TAYU Biotech and has sponsored research grants from Boehringer Ingelheim and NextCure. There is a patent application pending related to this work.

Figures

Figure 1.
Figure 1.. Identification of FGL1 as a binding partner of LAG3 in the GSRA system
(a) Schematic representation of the GSRA system. Individual plasmids of genes encoding both transmembrane and secreted proteins were transfected into 293T.2A cells (see methods and Table S1) in 1,536-well plates. LAG3-Ig as well as fluorescence labeled anti-Fc mAb were added into each well for rapid detection of LAG3-Ig binding. Human Fc receptors served as internal positive controls within each plate. Positive hits were confirmed by flow cytometry or Octet bio-layer interferometry. TM, transmembrane domain. (b) Image of the FGL1/LAG3 interaction in GSRA system. 293T.2A cells were transfected with human (h) or mouse (m) FGL1-TM or full-length LAG3 as indicated on the Y-axis. Human FGL2-TM was included as a negative control. The indicated fusion proteins shown on the X-axis were added to the culture to evaluate binding to the transfectants by the cellular detection system (CDS). (c) Representative flow cytometry dot plot of FGL1-Ig binding to mouse LAG3+ 293T.2A (blue) or mock cells (red). Control Ig binding to mouse LAG3+ 293T.2A is also shown (brown). (d) Representative Octet sensorgrams showing various amounts of FLAG-tagged mouse FGL1 (starting from 10ug/ml, two-fold serial dilutions) binding to immobilized mouse LAG3-Ig. (e) Schematic representation of constructs coding full-length mouse LAG3, LAG3 Y73F mutant, or LAG3 with different extracellular domain deletions (left). LAG3 full-length protein consists of four extracellular Ig domains (D1 to D4), the transmembrane domain (TM), and intracellular domain (IC) (left). Quantification of FGL1-Ig binding to 293T.2A cells transfected to express LAG3 with domain deletion/mutation (right). Data were analyzed by CDS software and presented as the mean ± SEM. *** p<0.001, **** p<0.0001, NS, not significant by Student’s t-test. (f) FGL1-Ig binding to mouse LAG3+ 293T.2A cells in the presence of control mAb (black line) or antiLAG3 (red line) by flow cytometry. Cells stained with control Ig (shadow) served as a negative control. All data are representative of at least two independent experiments.
Figure 2.
Figure 2.. FGL1 mediates LAG3-dependent T cell suppression
(a) Splenic T cells from WT or LAG3-KO mice were activated by immobilized anti-CD3 mAb for 24 hours, stained with anti-LAG3 mAb or FGL1-Ig fusion protein (blue) or control antibody/Ig (red), and analyzed by flow cytometry. (b) Splenic T cells from WT or LAG3-KO mice were activated by immobilized anti-CD3 mAb at suboptimal concentration in the presence of soluble FGL1-Ig or control-Ig (5ug/ml) for 3 days before the addition of 3H-dTR. Thymidine incorporation of proliferated T cells was analyzed 16 hours later. (c) The 3A9-LAG3 or parental 3A9 mouse T cell hybridoma cells were co-cultured with LK35.2 B cell line in CellGro serum free medium in the presence of HEL peptide and the indicated concentrations of FLAG-tagged FGL1. Shown is the normalized % of inhibition on the IL-2 levels in the supernatant at 24 hours normalized to levels with 0 ng/ml FGL1. (d) The 3A9-LAG3 mouse T cell hybridoma cells were co-cultured with LK35.2 B cell line in the presence of HEL peptide, FLAG tagged FGL1 (50ng/ml), anti-FGL1, or anti-LAG3 mAb (1ug/ml). Shown are the IL-2 levels in the supernatant at 24 hours. Data are representative of at least two independent experiments and are presented as the mean ± SEM. *p < 0.05, ** p < 0.01; *** p<0.001, NS, not significant by Student’s t-test.
Figure 3.
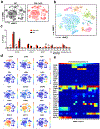
Figure 3.. Immune cell phenotyping of FGL1-KO mice
(a) Density t-SNE plots of an equal number of CD45+ compartment in the peripheral blood from WT and FGL1-KO mice (n=3). (b) t-SNE plot of CD45+ compartment overlaid with color-coded clusters. (c) Frequency of clusters grouped by indicated immune cell subsets. Data were shown as the mean ± SEM. *, p<0.05; ** p<0.01 by unpaired t-test. (d) t-SNE plot of CD45+ compartment overlaid with the expression of selected markers. (e) Heatmap displaying normalized marker expression of each immune cluster.
Figure 4.
Figure 4.. Ablation of the FGL1/LAG3 interaction inhibits tumor growth in mouse models
(a-b) FGL1-KO, LAG3-KO, or WT littermates were inoculated with MC38 cells (0.5×10⁶/mouse). The mean tumor diameters (a) and survival (b) of mice in each group (n=6) are shown. (c-d) B6 (c) or Rag1-KO (d) mice were inoculated with MC38 cells (0.5×10⁶/mouse) at day 0 and treated with anti-FGL1, anti-LAG3, or control mAbs every four days from day 6 to day 18. The mean tumor diameters in each group (n=6) are shown. (e) WT or FGL1-KO mice were inoculated with MC38 cells and were treated with anti-LAG3 or control mAb as in (c). The mean tumor diameters in each group (n=6–8) are shown. (f) LAG3-KO mice were inoculated with MC38 cells and were treated with anti-FGL1 (n=8) or control mAb (n=7) as in (c). The mean tumor diameters in each group are shown. Data were representative of at least two independent experiments and are shown as the mean ± SEM. *, p<0.05; **, p<0.01; NS, not significant. a, c-f by two-way ANOVA; b by Log-rank test.
Figure 5.
Figure 5.. Expansion of tumor infiltrating T cell populations in FGL1-KO mice
(a) Density t-SNE plots of an equal number of CD45+ MC38 tumor-infiltrating leukocytes in WT (n=4) and FGL1-KO (n=5) mice. Size of unsupervised clusters denotes the relative number of cells in that grouping. (b) t-SNE plot of tumor infiltrating leukocytes overlaid with color-coded clusters. (c) t-SNE plot of tumor infiltrating leukocytes overlaid with the expression of selected markers. (d) Frequency of clusters grouped by indicated immune cell subsets. Data were shown as the mean ± SEM. *, p<0.05 by unpaired t-test. (e) Heatmap displaying normalized marker expression of each immune cluster.
Figure 6.
Figure 6.. Upregulated FGL1 in human cancers is associated with a poor prognosis
(a) Representative immunofluorescence staining of FGL1, DAPI (for nuclear counterstain), and pancytokeratin (CK) in FGL1 positive or negative NSCLC cancer sections. (b-c) FGL1 expression as indicated by quantitative immunofluorescence (QIF) staining in NSCLC cancer tissues from cohort #1 (see also Table S3). (b) Distribution of FGL1 expression, (c) association of high or low FGL1 expression with overall survival of the patients. The QIF visual detection threshold (1010.27) was used as a cutoff as indicated by dotted line in (b). (d) The baseline plasma FGL1 levels were determined by ELISA in cohort #2 (see also Table S3) of NSCLC cancer patients (n=18) and healthy donors (n=16). Data were presented as the mean ± SEM. ***, p<0.001 by Student’s t-test. (e-f) Kaplan-Meier plots of overall survival stratified by median baseline plasma FGL1 levels in NSCLC (cut-point: 336.5 ng/ml) and melanoma (cut-point: 114 ng/ml) patients treated with single-agent antiPD-1 therapy in NSCLC (d, cohort #2, n=18) and melanoma (e, cohort #4, n=21), see also Table S3 and S4. (g-h) B6 mice were inoculated s.c. with MC38 cells (0.5×10⁶/mouse) at day 0, followed by the treatment with anti-FGL1, anti-LAG3, or control mAb (n=6 per group) every four days from day 6 to day 18. In some groups, mice were also treated with a single dose of anti-B7-H1 (10B5) at day 6. (g) Survival of the mice is shown. Survival analysis was conducted by Log-rank test, **, p<0.01; ***, p<0.001. The presented data is representative of at least two independent experiments. (h) Tumor sizes are shown as the mean tumor diameter ± SEM at day 22. **, p<0.01 by Student’s t-test.

References

    1. Anderson AC, Joller N, and Kuchroo VK (2016). Lag-3, Tim-3, and TIGIT: Co-inhibitory Receptors with Specialized Functions in Immune Regulation. Immunity 44, 989–1004. - PMC - PubMed
    1. Andrews LP, Marciscano AE, Drake CG, and Vignali DA (2017). LAG3 (CD223) as a cancer immunotherapy target. Immunol Rev 276, 80–96. - PMC - PubMed
    1. Annunziato F, Manetti R, Cosmi L, Galli G, Heusser CH, Romagnani S, and Maggi E (1997). Opposite role for interleukin-4 and interferon-gamma on CD30 and lymphocyte activation gene-3 (LAG-3) expression by activated naive T cells. Eur J Immunol 27, 2239–2244. - PubMed
    1. Annunziato F, Manetti R, Tomasevic I, Guidizi MG, Biagiotti R, Gianno V, Germano P, Mavilia C, Maggi E, and Romagnani S (1996). Expression and release of LAG-3-encoded protein by human CD4+ T cells are associated with IFN-gamma production. FASEB J 10, 769–776. - PubMed
    1. Ascierto PA, and McArthur GA (2017). Checkpoint inhibitors in melanoma and early phase development in solid tumors: what’s the future? J Transl Med 15, 173. - PMC - PubMed

Publication types

MeSH terms