. 2019 Feb:20:14-27.
doi: 10.1016/j.molmet.2018.11.009. Epub 2018 Nov 28.

A dual Ucp1 reporter mouse model for imaging and quantitation of brown and brite fat recruitment

Affiliations

A dual Ucp1 reporter mouse model for imaging and quantitation of brown and brite fat recruitment

Hui Wang et al. Mol Metab. 2019 Feb.

Abstract

Objectives: Brown adipose tissue (BAT) dissipates nutritional energy as heat through uncoupling protein 1 (UCP1). The discovery of functional BAT in healthy adult humans has promoted the search for pharmacological interventions to recruit and activate brown fat as a treatment of obesity and diabetes type II. These efforts require in vivo models to compare the efficacy of novel compounds in a relevant physiological context.

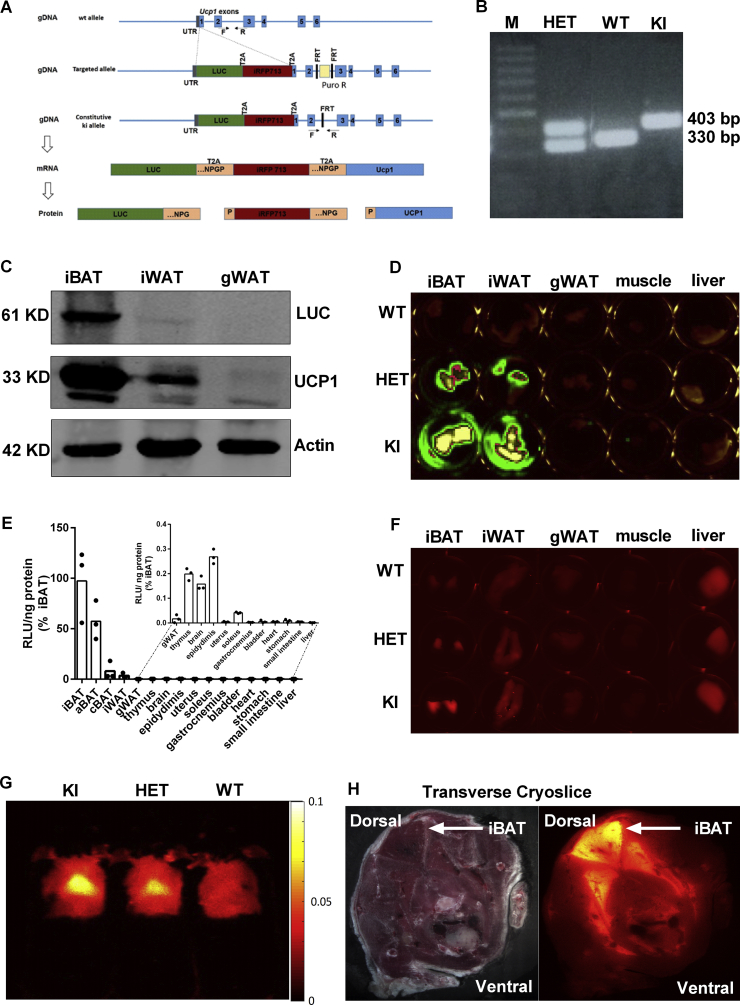
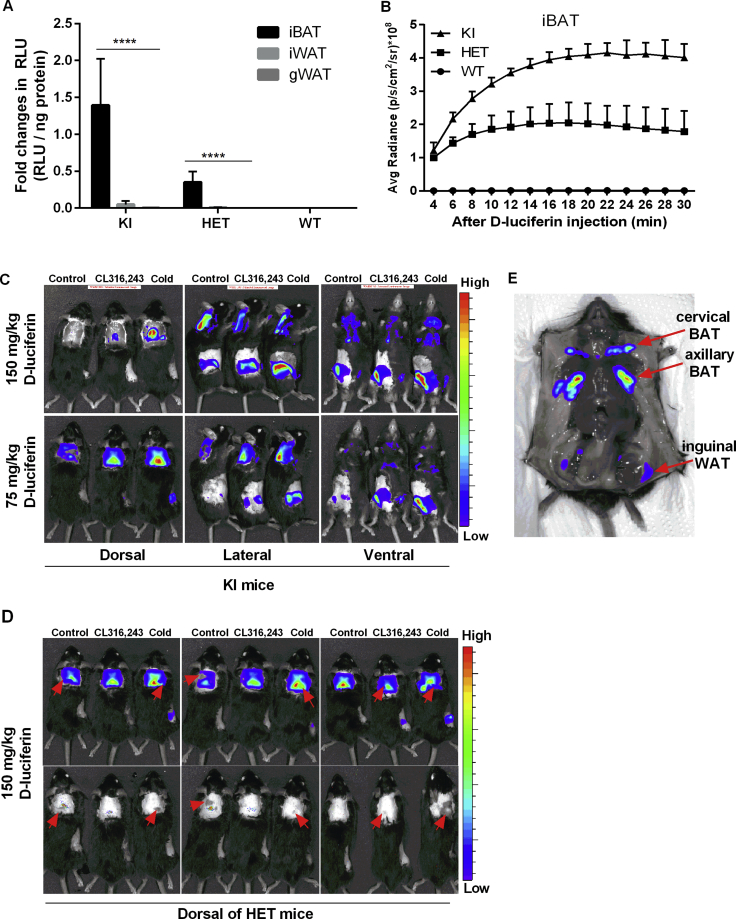
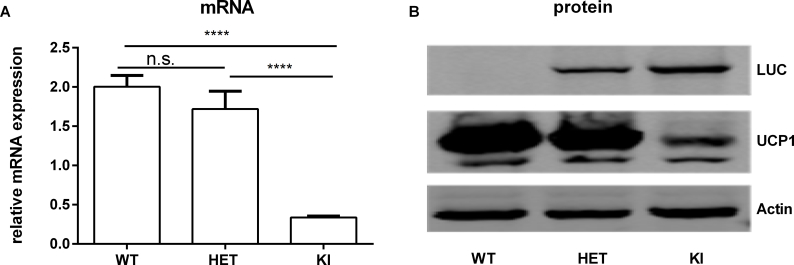
Methods: We generated a knock-in mouse line expressing firefly luciferase and near-infrared red florescent protein (iRFP713) driven by the regulatory elements of the endogenous Ucp1 gene.

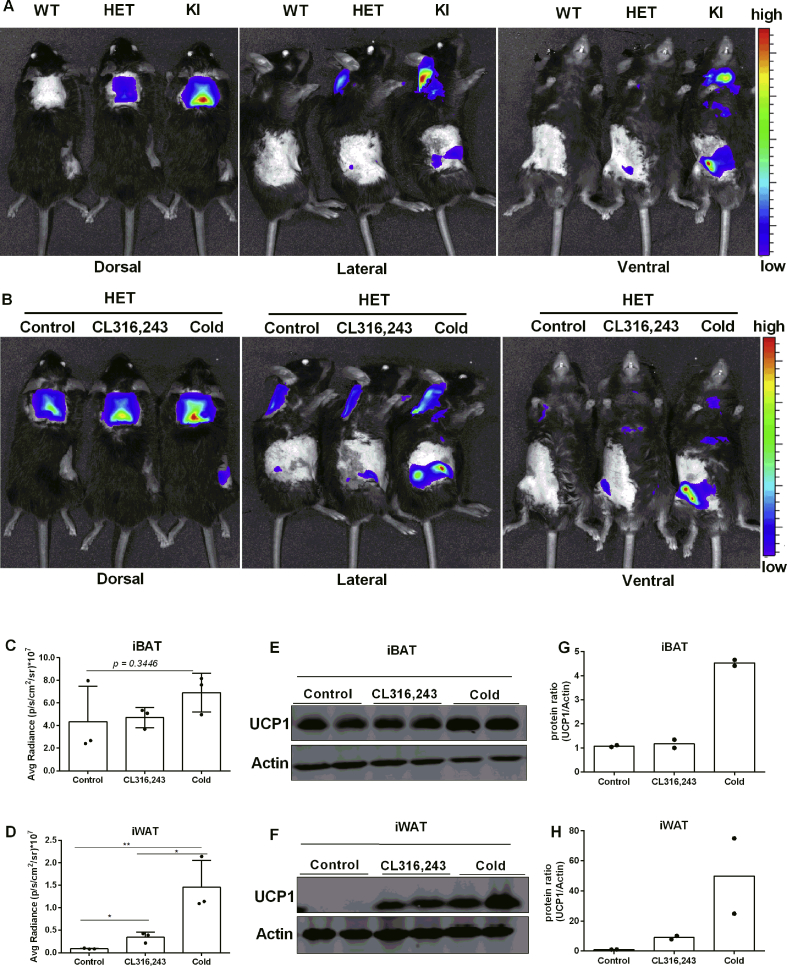
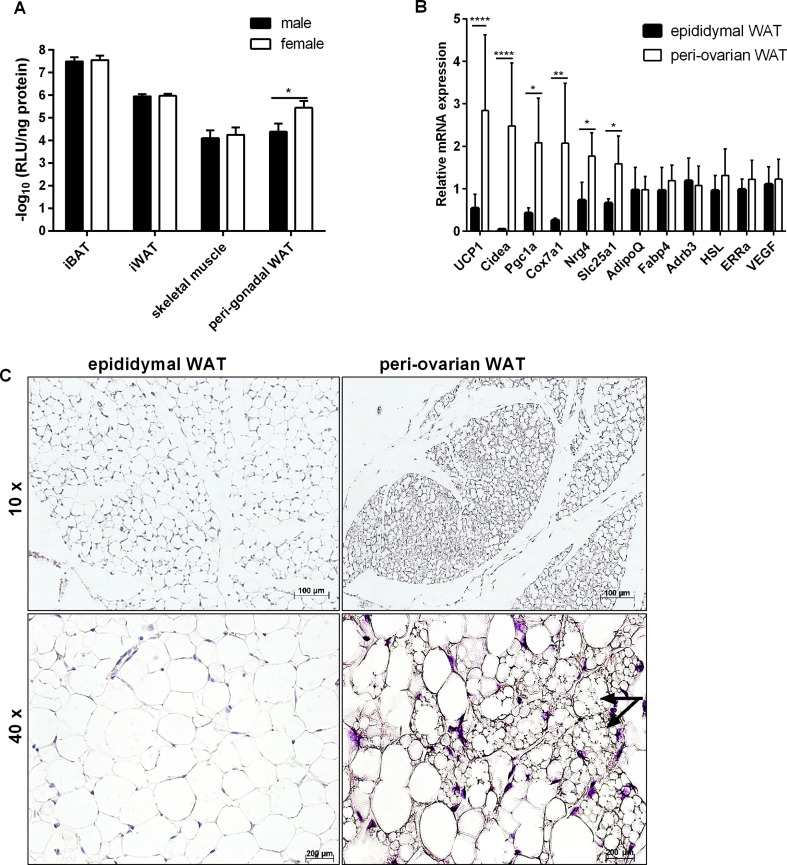
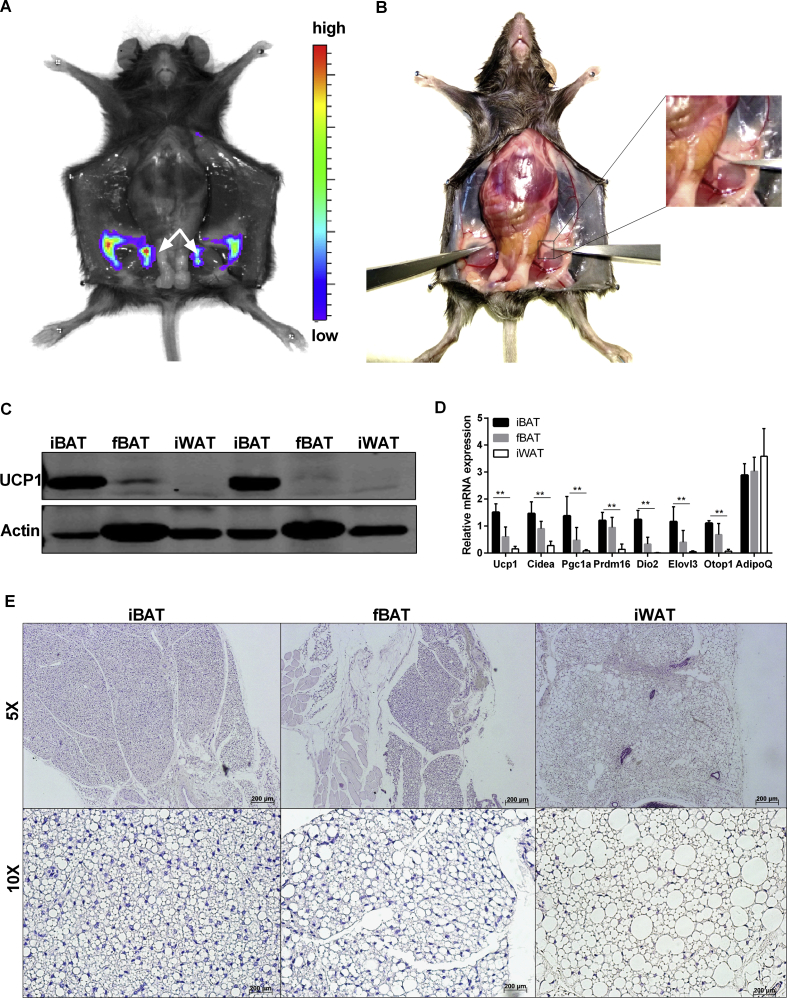
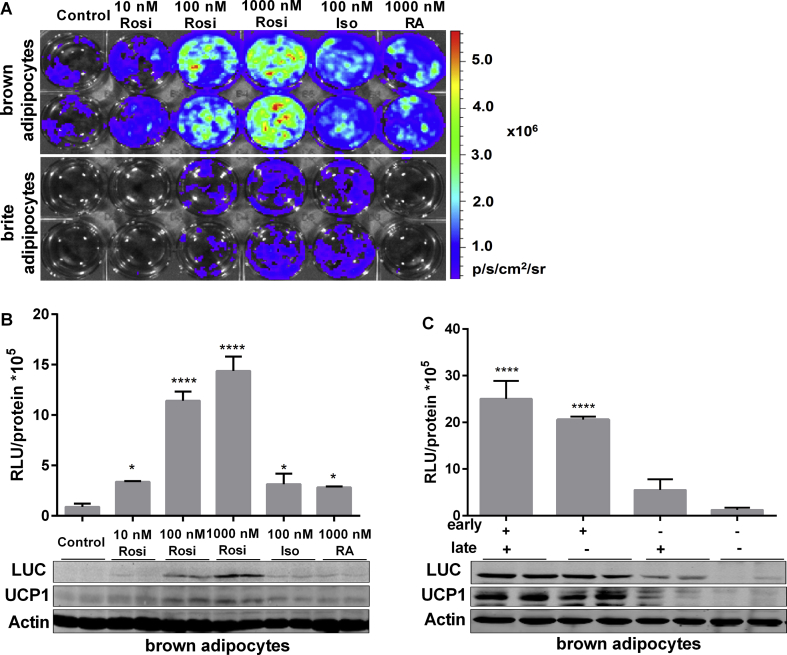
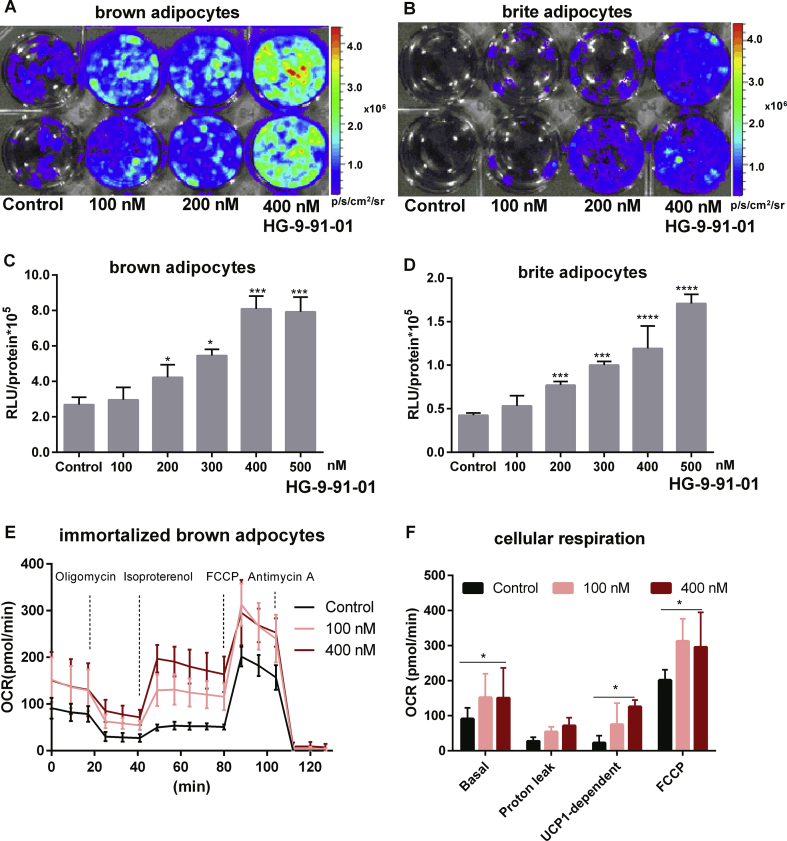
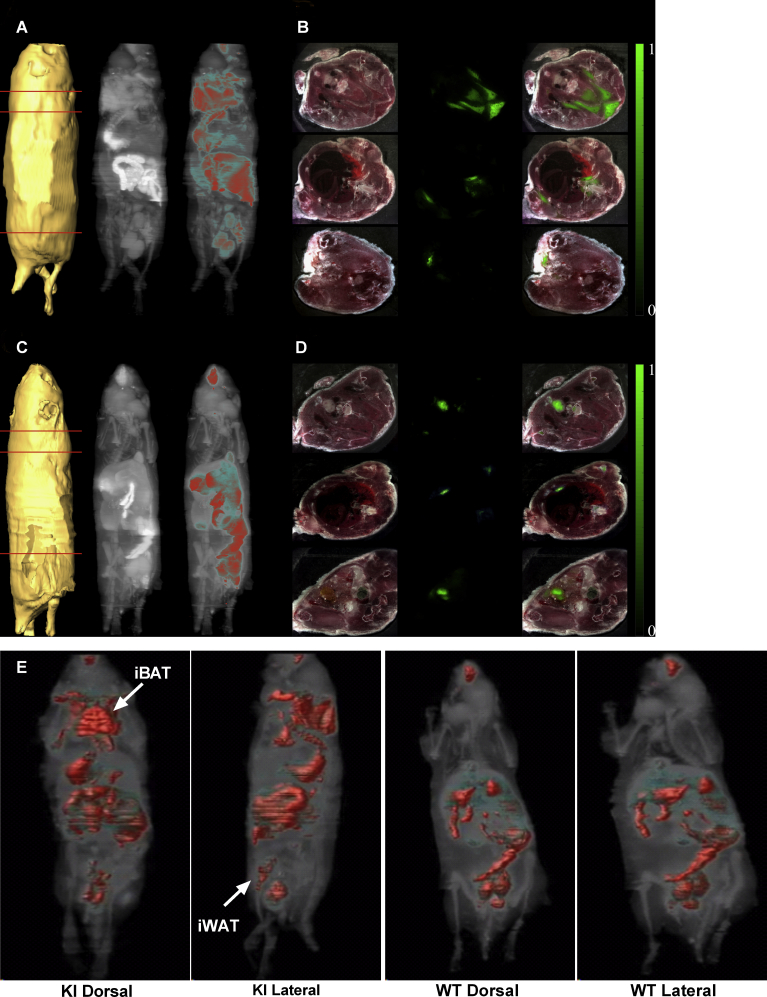
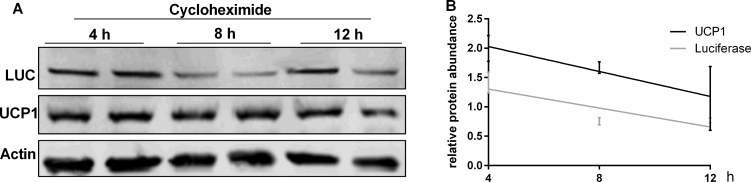
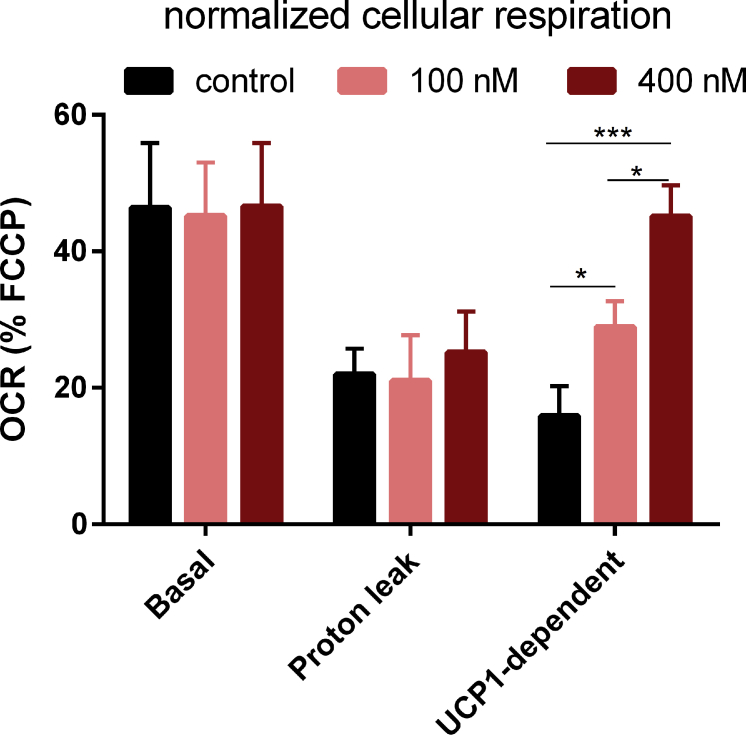
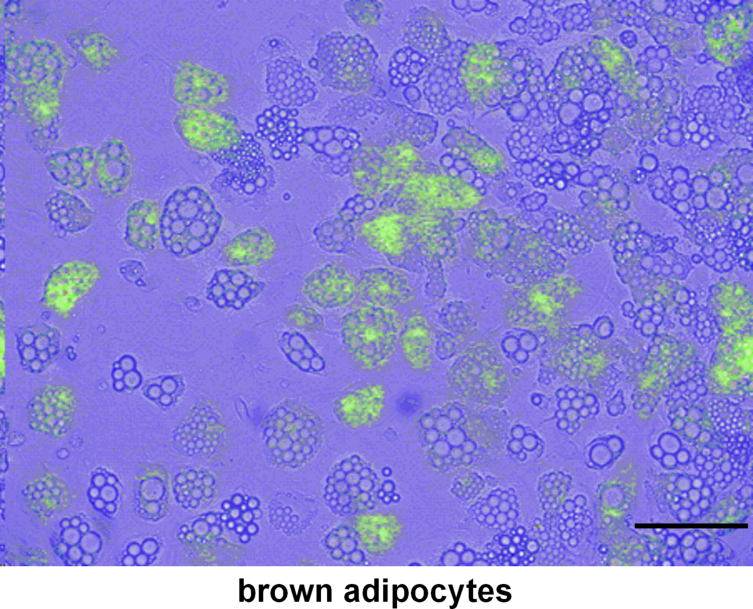
Results: Our detailed characterization revealed that firefly luciferase activity faithfully reports endogenous Ucp1 gene expression in response to physiological and pharmacological stimuli. The iRFP713 fluorescence signal was detected in the interscapular BAT region of cold-exposed reporter mice in an allele-dosage dependent manner. Using this reporter mouse model, we detected a higher browning capacity in female peri-ovarian white adipose tissue compared to male epididymal WAT, which we further corroborated by molecular and morphological features. In situ imaging detected a strong luciferase activity signal in a previously unappreciated adipose tissue depot adjunct to the femoral muscle, now adopted as femoral brown adipose tissue. In addition, screening cultured adipocytes by bioluminescence imaging identified the selective Salt-Inducible Kinase inhibitor, HG-9-91-01, to increase Ucp1 gene expression and mitochondrial respiration in brown and brite adipocytes.

Conclusions: In our mouse model, firefly luciferase activity serves as a bona fide reporter for dynamic regulation of Ucp1. In addition, by means of iRFP713 we are able to monitor Ucp1 expression in a non-invasive fashion.

Keywords: BAT; Browning; Firefly luciferase; Thermogenesis; UCP1; WAT; iRFP713.


Figures

Figure 1
Figure 1
Firefly luciferase and iRFP713 reliably report tissue-specific expression characteristics of Ucp1. A. Schematic structure of the Luciferase-T2A-iRFP713-T2A knock-in construct. This transgene was integrated into the 5′ UTR of the intrinsic Ucp1 locus, encoding for the firefly luciferase protein (LUC), the near-infrared fluorescent protein (iRFP713), and the Thosea asigna virus self-cleavage 2A peptide (T2A). Genotyping primers were designed to distinguish the wildtype (330 bp) and knock-in (410) allele. B. Identification of genotyping PCR products in WT, heterozygous (HET) and KI mice. M = molecular weight marker. C. Detection of LUC, UCP1 and Actin proteins in iBAT, iWAT and gWAT of homozygous KI mice. D.Ex vivo imaging of luciferase activity in freshly isolated iBAT, iWAT, gWAT, skeletal muscle, and liver from WT, HET, and KI mice. E. Bioluminescence quantification of multiple tissues derived from KI mice, n = 3. F. Representative ex vivo scanning of iRFP713 in iBAT, iWAT, gWAT, skeletal muscle, and liver freshly isolated from WT, HET, and KI mice. G.In vivo iRFP713 imaging of cold-acclimated WT, HET, and KI mice. H. Anatomical transverse cryoslice with fluorescence imaging of a cold-exposed KI mouse indicating iRFP713 expression by iBAT (white arrow).
Figure 2
Figure 2
In vivo bioluminescence imaging and quantification. A. Representative in vivo bioluminescence imaging of WT, HET, and KI mice after D-luciferin injection, n = 6. B. Representative in vivo bioluminescence imaging of HET mice under control condition (untreated), after 5 days of consecutive CL316,243 injection and after cold-acclimation. C-D. Quantification of the in vivo bioluminescence from the regions of interest, n = 3. Data were analyzed with One-way-ANOVA, *P < 0.05, **P < 0.01 (Mean ± SD). E-F. Immunoblotting of UCP1 and Actin in iBAT (15 μg protein) and iWAT (30 μg protein) isolated from HET mice. G-H. Quantification of relative UCP1 protein abundance shown in (E-F).
Figure 3
Figure 3
Female peri-ovarian WAT displays a higher browning propensity than male epididymal WAT. A. Bioluminescence quantification of lysates generated from iBAT, iWAT, skeletal muscle, and peri-gonadal WAT derived from 5-weeks-old male and female KI mice. Luminescence was normalized to corresponding protein concentrations, n = 6. Data were analyzed with unpaired t test, *P < 0.05 (Mean ± SD). B. Gene expression analysis of male epididymal and female peri-ovarian WAT of KI mice, n = 6. Data were analyzed with Two-way-ANOVA, *P < 0.05, **P < 0.01, ***P < 0.001 (Mean ± SD). C. Representative hematoxylin and eosin staining of epididymal and peri-ovarian WAT; black arrows indicate the multilocular adipocytes, n = 6.
Figure 4
Figure 4
Identification of femoral BAT as a novel UCP1-expressing tissue. A. Light emitting depots in the caudal body part of a KI mouse. White arrows point to femoral BAT (fBAT). B. Anatomical location of fBAT embedded in the superficial layer of femur muscle. C. Western blot analysis of UCP1 expression in iBAT, fBAT, and iWAT of KI mice. D. Gene expression analysis of iBAT, fBAT, and iWAT, n = 5. Data were analyzed with Two-way-ANOVA, **P < 0 .01 (Mean ± SD). E. Hematoxylin and eosin staining of iBAT, fBAT, and iWAT of KI mice.
Figure 5
Figure 5
Luciferase activity reflects UCP1 expression in primary adipocytes. A.In vitro bioluminescence imaging of primary brown and beige adipocytes in response to increasing concentrations of chronic Rosiglitazone (Rosi), acute isoproterenol (Iso, 100 nM), and acute retinoic acid (RA, 1000 nM) in the differentiation medium. B. Quantification of bioluminescence intensity, and corresponding detection of Luciferase, UCP1 and Actin protein levels, n = 3. Data were analyzed with one-way-ANOVA and compared to the control group, *P < 0.05, ****P < 0.0001 (Mean ± SD). C. Luciferase activity quantification and immunoblotting analysis of Rosiglitazone time-course effects during 7-day differentiation, which was divided into an early (first 4 days) and late (last 3 days) phases, n = 3. Data were analyzed with One-way-ANOVA, compared to the negative group (without Rosi), ****P < 0.001 (Mean ± SD).
Figure 6
Figure 6
Cell-based imaging identifies a novel regulator of Ucp1 expression. A-B. Bioluminescence imaging of primary brown and beige adipocytes from KI mice in response to different concentrations of the SIKs inhibitor HG-9-91-01. C-D. Quantification of bioluminescence of primary brown and beige adipocytes in response to increasing concentrations of the SIKs inhibitor HG-9-91-01, n = 3. *P < 0.05, ***P < 0.001, ****P < 0.0001, compared to the control cells (Mean ± SD). E. Oxygen consumption rate (OCR) of immortalized brown adipocytes from 129S6Sv/EvTac mice. Cell cultures were chronically treated with 100 nM or 400 nM HG-9-91-01 during differentiation, n = 3. F. Quantification of basal, proton leak (oligomycin-insensitive OCR), UCP1-dependent respiration [(isoproterenol-stimulated OCR) – (oligomycin-resistant OCR)] and maximal respiration induced by FCCP, N = 3, n = 16. *P < 0.05, ****P < 0.0001, Two-way-ANOVA, (Mean ± SD).
figs1
figs1
Imaging and quantification of bioluminescence in Ucp1-LUC-iRFP713 reporter mice in vitro and in vivo. A. Bioluminescence quantification of iBAT, iWAT, and gWAT homogenates from WT, HET, and KI mice, n = 6. Bioluminescence was normalized to corresponding protein concentrations. Data were analyzed with two-way-ANOVA ****P < 0.0001 (Mean ± SD). B. To obtain an optimal time point for iBAT imaging, mice were injected with D-luciferin (150 mg/kg, i.p.). Afterwards, dorsal images were taken by 2-min intervals, and the Average Radiance was calculated for the region of interest superior of the iBAT location. C. The administration of 150 mg/kg D-luciferin (upper row) leads to saturated luminescence signal in KI mice (16 weeks) treated with CL316,243 during 5 consecutive days or after 4 weeks of stepwise cold acclimation. To address this issue, D-luciferin injection dose was decreased to 75 mg/kg (lower). D. Three sets of heterozygous mice were used to compare the bioluminescence intensity among control, CL316,243 and cold acclimation after administration of D-Luciferin (upper row). Pointed by arrows, pigmentation was detected above the religion of brown adipose tissue. The lower row of images was taken 1 s post D-luciferin injection demonstrating the pigmentation. E. After in vivo imaging, mice were killed and dissected to track the light-emitting tissues, among which cervical BAT, axillary BAT, and inguinal WAT were identified as main sources.
figs2
figs2
Cryoslice imaging of Ucp1-Luc-Irfp713 reporter mice coupled with sensitive florescence camera. A. Isosurface reconstructed from slices acquired by the cryostat; the maximum projection intensity (MPI) of the fluorescence acquired in 730/50 nm in logarithmic scale; composite reconstruction of logarithmic MPI and fluorescence intensity at 730/50 nm (left to right). B. Representative cryo-sections at the locations indicated by the orange lines in KI mouse from A, color images are placed at the first column, fluorescence at the second and the composite image at the third column. Each slice has been normalized to its corresponding maximum value to demonstrate dynamic range of the acquired data. C. Equivalent to A reconstructions from a WT mouse. Signals within the gastrointestinal tract of WT and KI mice are due to auto-fluorescence of food in stomach and gut.D. Cryo-sections of the WT mouse at locations equivalent to the ones depicted in A, The normalized data show only autofluorescence and absolute absence of brown fat. E. Direct comparison between A and C demonstrates the difference between the two mice in UCP1 expression, in particular, in iBAT and iWAT.
figs3
figs3
Half-life of UCP1 and LUC in brown adipocytes. A. Immunoblotting analysis of UCP1 and LUC protein in brown adipocytes derived from KI mice. Preadipocytes were differentiated with chronic rosiglitazone for 7 consecutive days to induce UCP1 expression. At day 7, cell cultures were treated with 25 μg/ml cycloheximide for 4 h, 8 h, and 12 h to inhibit protein biosynthesis before harvest. B. Signals of UCP1 and LUC in A were quantified and normalized to the Actin signals in the same samples. Individual protein half-life was calculated from the initial and final protein abundance.
figs4
figs4
Normalized cellular respiration to maximal uncoupled rate. Respiration rates of basal, proton leak and UCP1-dependent were all normalized to the maximal FCCP uncoupled rate, N = 3, n = 16. *P < 0.05, ****P < 0.0001, Two-way-ANOVA, (Mean ± SD).
figs5
figs5
Homozygous KI mice display a UCP1 deficiency phenotype in iBAT. A. Relative Ucp1 mRNA expression in interscapular BAT of WT, HET and KI mice, n = 6. Data were analyzed with One-way-ANOVA, ****P < 0.0001. B. Representative immunoblotting analysis of UCP1 and LUC proteins in interscapular BAT of WT, HET, and KI mice.
figs6
figs6
Live single-cell imaging of luciferase bioluminescence in brown adipocytes. Living brown adipocytes were imaged with a CCD camera supplemented with D-luciferin. Blue signals correspond to bioluminescence (Scale bar = 50 μm).

References

    1. Smorlesi A., Frontini A., Cinti S. Stem cells in aesthetic procedures: art, science, and clinical techniques. 2001. The adipose organ: morphological perspectives of adipose tissues; pp. 123–133.
    1. Klingenspor M., Bast A., Bolze F., Li Y., Maurer S., Schweizer S. Springer; Cham: 2017. Brown adipose tissue. Adipose tissue biology; pp. 91–147.
    1. Klingenspor M. Cold-induced recruitment of brown adipose tissue thermogenesis. Experimental Physiology. 2003;88(1):141–148. - PubMed
    1. Cousin B., Cinti S., Morroni M., Raimbault S., Ricquier D., Pénicaud L. Occurrence of brown adipocytes in rat white adipose tissue : molecular and morphological characterization. Journal of Cell Science. 1992;103:931–942. - PubMed
    1. Guerra C., Koza R.A., Yamashita H., Walsh K., Kozak L.P. Emergence of brown adipocytes in white fat in mice is under genetic control effects on body weight and adiposity. The American Society for Clinical Investigation. 1998;102(2):412–420. - PMC - PubMed

Publication types