. 2019 Jan 9;25(1):113-127.e6.
doi: 10.1016/j.chom.2018.11.009. Epub 2018 Dec 20.

A Diet-Sensitive Commensal Lactobacillus Strain Mediates TLR7-Dependent Systemic Autoimmunity

Affiliations

A Diet-Sensitive Commensal Lactobacillus Strain Mediates TLR7-Dependent Systemic Autoimmunity

Daniel F Zegarra-Ruiz et al. Cell Host Microbe. .

Abstract

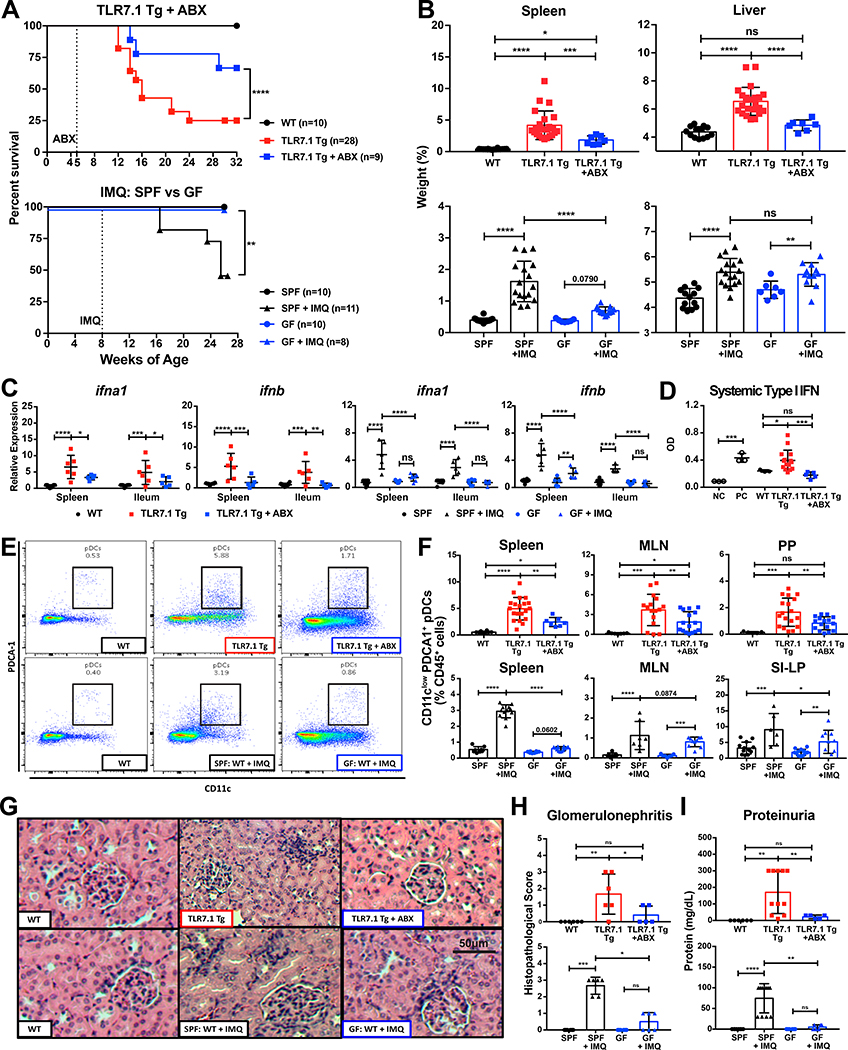
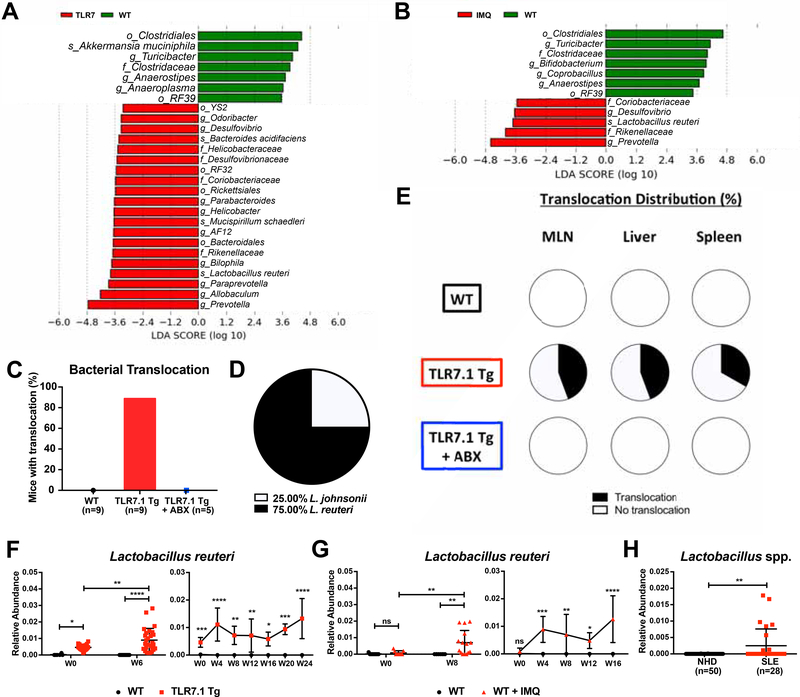
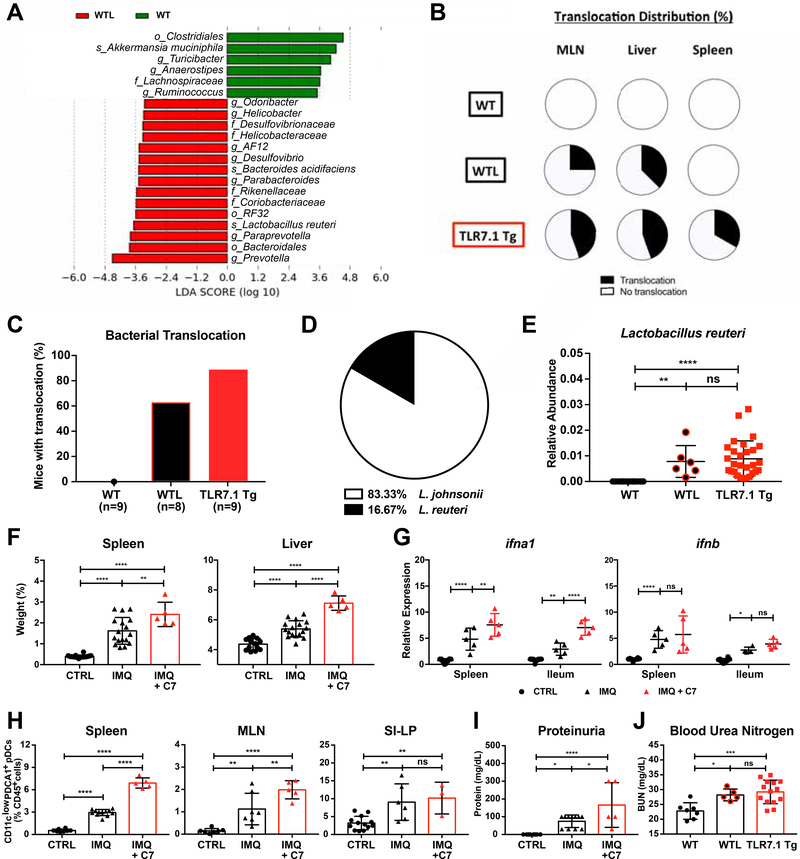
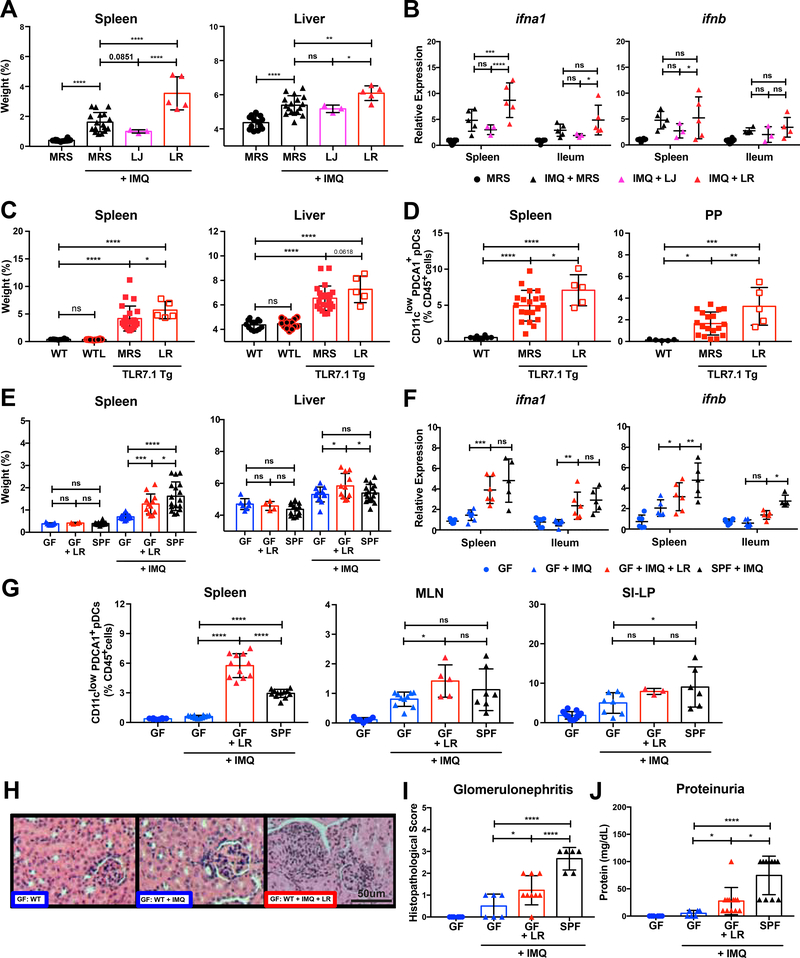
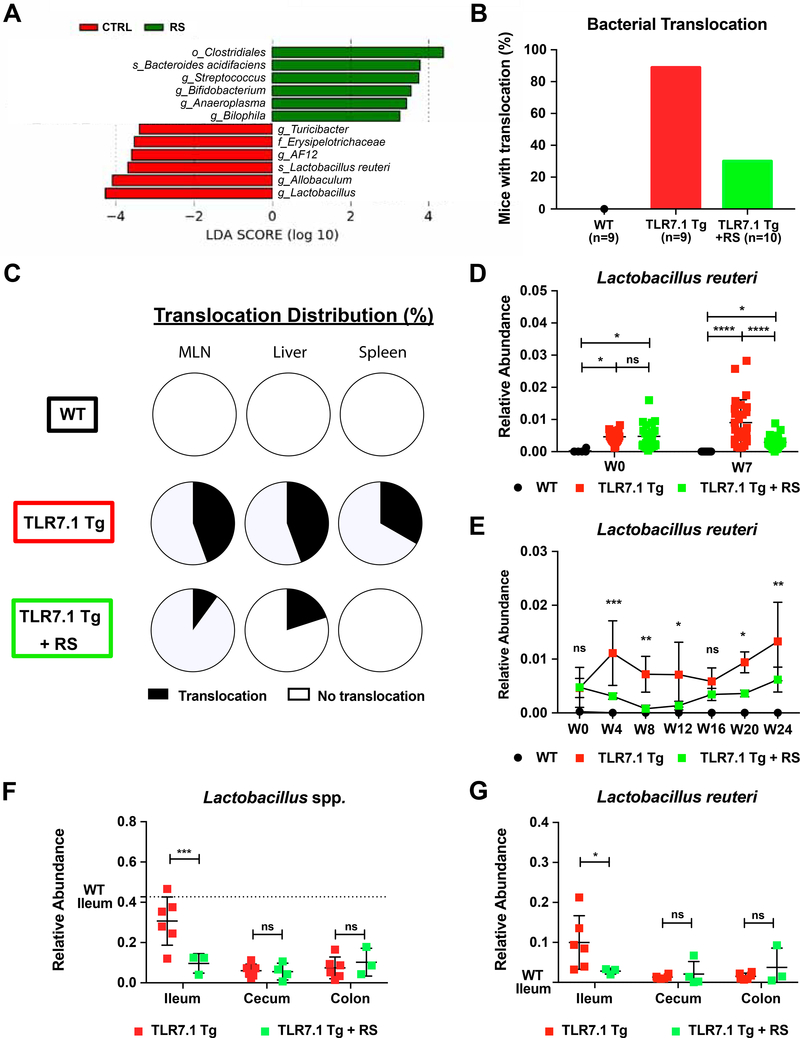
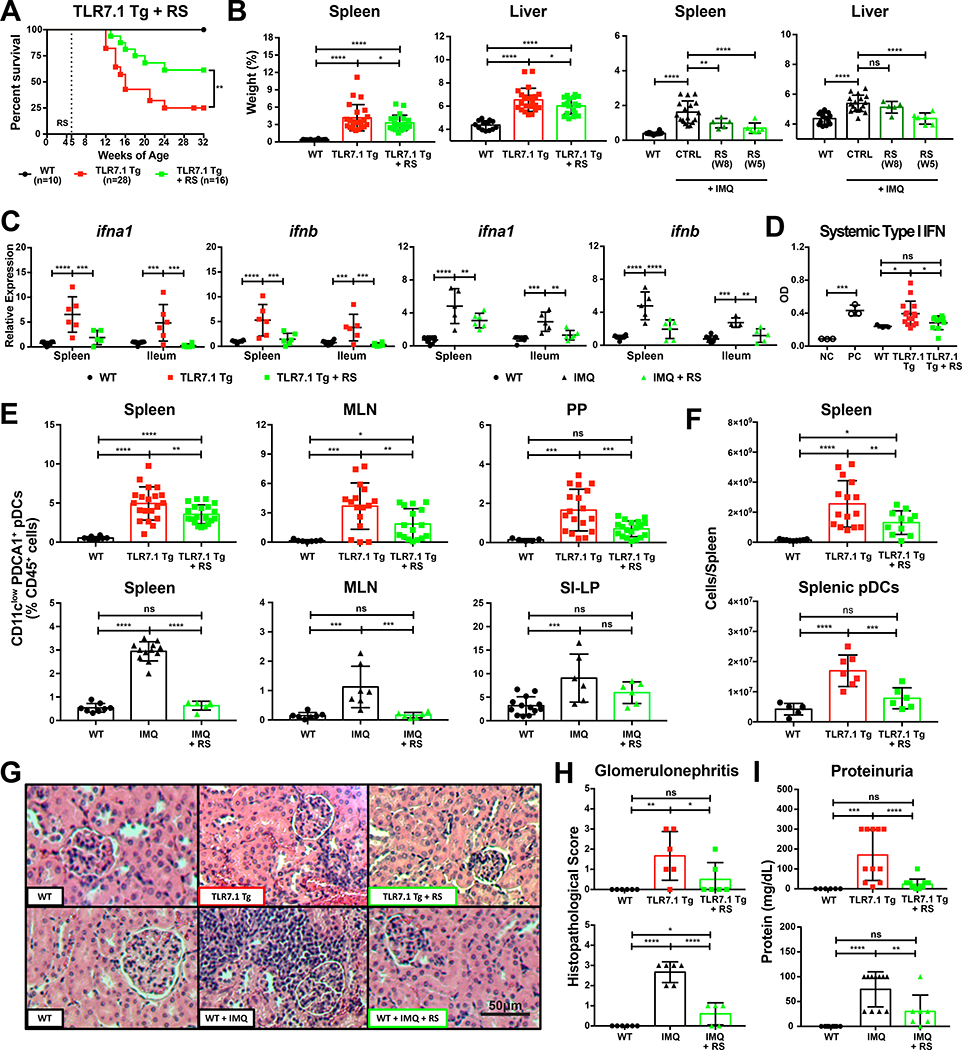
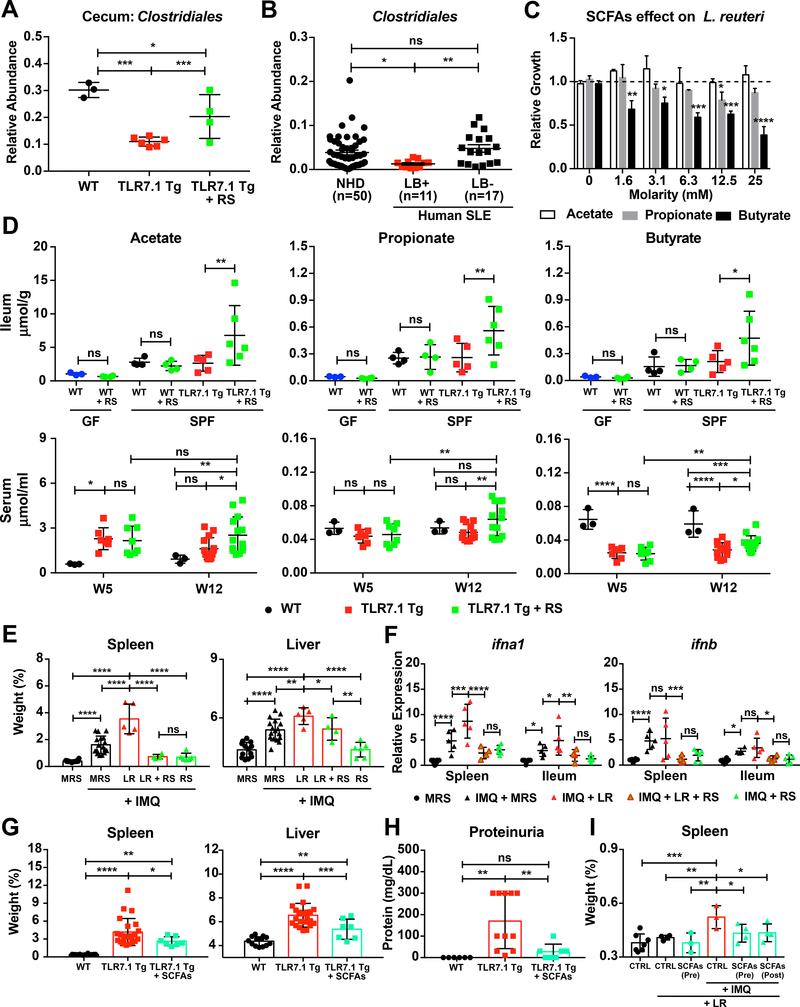
Western lifestyle is linked to autoimmune and metabolic diseases, driven by changes in diet and gut microbiota composition. Using Toll-like receptor 7 (TLR7)-dependent mouse models of systemic lupus erythematosus (SLE), we dissect dietary effects on the gut microbiota and find that Lactobacillus reuteri can drive autoimmunity but is ameliorated by dietary resistant starch (RS). Culture of internal organs and 16S rDNA sequencing revealed TLR7-dependent translocation of L. reuteri in mice and fecal enrichment of Lactobacillus in a subset of SLE patients. L. reuteri colonization worsened autoimmune manifestations under specific-pathogen-free and gnotobiotic conditions, notably increasing plasmacytoid dendritic cells (pDCs) and interferon signaling. However, RS suppressed the abundance and translocation of L. reuteri via short-chain fatty acids, which inhibited its growth. Additionally, RS decreased pDCs, interferon pathways, organ involvement, and mortality. Thus, RS exerts beneficial effects in lupus-prone hosts through suppressing a pathobiont that promotes interferon pathways implicated in the pathogenesis of human autoimmunity.

Keywords: Clostridiaceae; Clostridiales; Lactobacillus; Lactobacillus reuteri; gut microbiota; human SLE microbiome; interferon; plasmacytoid dendritic cells; resistant starch; systemic lupus erythematosus.


Conflict of interest statement

Declaration of interests

M.A.K. received salary, consulting fees, honoraria and research funds from Roche, Bristol-Meyers Squibb, AbbVie, and Cell Applications.

Figures

Figure 1.
Figure 1.. The gut microbiota exacerbates lupus-related mortality and pathogenesis.
TLR7.1 Tg lupus-prone mice were treated with broad-spectrum antibiotics (ABX). C57B1/6 (SPF vs. GF) mice were treated with topical imiquimod (IMQ) to induce a lupus-like syndrome. (A) Survival of both lupus-like models. Experimental cohorts of TLR7.1 Tg and C57B1/6 mice were sacrificed for organ weights, immunologic, and histologic analyses. (B) Weights of spleens and livers. (C) Relative mRNA expression of type I IFN in spleen and ileum. (D) Systemic type I IFN responses in serum measured with a reporter cell line. (E-F) Cells from spleen, MLN, PP, and SI-LP were isolated and analyzed by flow cytometry. (E) Representative FACS plots from splenic pDCs. (F) Frequencies of pDCs in spleen, MLN, PP, and SI-LP. (G) Representative H&E staining of kidney tissue. (H) Histopathologic scores for glomerulonephritis. (I) Quantifications of proteinuria. The results are expressed as mean ± SEM (survival cohorts n=8–28 mice per group, experimental cohorts n=3–20 mice per group). The results are representative of at least two independent experiments. *P<0.05 was considered statistically significant; **P <0.01; ***P<0.001; ****P<0.0001; ns=not significant; NC=negative control; PC=positive control. See also Figure S1.
Figure 2.
Figure 2.. Increased abundance and translocation of lactobacilli in lupus.
Fecal pellets from WT C57B1/6, TLR7.1 Tg, and C57B1/6 mice treated with IMQ were collected; bacterial DNA was isolated and sequenced. Linear Discriminant Analysis Effect Size (LDA) scores of altered taxa in (A) TLR7.1 Tg compared to WT mice and (B) C57B1/6 mice treated with or without IMQ. Shown are significantly altered taxa (increased in red, decreased in green). (C) Total percentage of bacterial translocation as determined by anaerobic and aerobic non-selective cultures. (D) Profile of translocating bacterial species. (E) Distribution of Lactobacillus spp. translocation in MLN, liver, and spleen from WT, TLR7.1 Tg, and TLR7.1 Tg mice treated with or without ABX. (F) Relative abundances of fecal L. reuteri in TLR7.1 Tg compared to WT mice and (G) C57B1/6 mice treated with or without IMQ evaluated by 16S rDNA gene sequencing. (H) Relative abundances of fecal Lactobacillus spp. in normal healthy donors (NHD) and systemic lupus erythematosus (SLE) patients. The results are expressed as mean ± SEM (n=3–20 mice and 28–50 human samples per group). Data are representative of at least three independent experiments. *P<0.05 was considered statistically significant; **P<0.01; ***P<0.001; ****P<0.0001; ns=not significant; W0=week of disease onset. See also Figure S2 and Tables S1 and S2.
Figure 3.
Figure 3.. Bacterial communities increased in TLR7-dependent lupus models are transferable and exacerbate lupus-related pathogenesis.
Fecal pellets from WT mice and WT littermates (WTL) cohoused with TLR7.1 Tg were collected; bacterial DNA was isolated and sequenced. (A) LDA scores of altered taxa in WTL compared to WT. Shown are significantly altered taxa (increased in red, decreased in green). (B) Distribution of Lactobacillus spp. translocation in MLN, liver and spleen from WT, WTL, and TLR7.1 Tg mice. (C) Total percentage of bacterial translocation as determined by culture. (D) Profile of translocating bacterial species in WTL mice. (E) Relative abundances of fecal L. reuteri (LR) in WT, WTL and TLR7.1 Tg mice evaluated by 16S rDNA gene sequencing. (F-J) SPF C57B1/6 mice were treated with IMQ and gavaged with cecal microbial content from 12-week-old TLR7.1 Tg mice (C7). Mice were sacrificed for organ weights, immunologic, and histologic analyses. (F) Weights of spleen and liver. (G) Relative mRNA expression of type I IFN in spleen and ileum. Cells from spleen, MLN, and SI-LP were isolated and analyzed by flow cytometry. (H) Frequency of pDCs in spleen, MLN, and SI-LP. (I) Quantification of proteinuria. Q) Blood urea nitrogen levels in WTL. The results are expressed as mean ± SEM (n=5–20 mice per group). The results are representative of at least two independent experiments. *P<0.05 was considered statistically significant; **P<0.01; ***P<0.001; ****p<0.0001; ns=not significant. See also Figure S3 and Table S3.
Figure 4.
Figure 4.. L. reuteri exacerbates lupus-related pathogenesis.
(A-B) SPF C57B1/6 mice were treated with IMQ and were gavaged with De Man, Rogosa and Sharpe broth (MRS), L. reuteri (LR), or L. johnsonii (LJ) primary tissue isolates harvested from TLR7.1 Tg mice. Mice were sacrificed for organ weights and immunologic analyses. (A) Weights of spleen and liver. (B) Relative mRNA expression of type I IFN in spleen and ileum. (C-D) TLR7.1 Tg mice were gavaged with MRS or LR. Mice were sacrificed for organ weights and immunologic analyses. (C) Weights of spleen and liver. Cells from spleen and PP were isolated and analyzed by flow cytometry. (D) Frequencies of pDCs in spleen and PP. (E-I) GF C57B1/6 mice were treated with IMQ and monocolonized with LR. Mice were sacrificed for organ weights, immunologic, and histologic analyses. (E) Weights of spleen and liver. (F) Relative mRNA expression of type I IFN in spleen and ileum. Cells from spleen, MLN, and SI-LP were isolated and analyzed by flow cytometry. (G) Frequencies of pDCs in spleen, MLN, and SI-LP. (H) Representative H&E staining of kidney tissue. (I) Histopathologic scoring for glomerulonephritis. Q) Quantification of proteinuria. The results are expressed as mean ± SEM (n=3–16 mice per group). The results are representative of at least two independent experiments. *P<0.05 was considered statistically significant; **P<0.01; ***P<0.001; ****p<0.0001; ns=not significant. See also Figure S4.
Figure 5.
Figure 5.. Resistant starch modulates the gut microbiome and decreases L. reuteri translocation.
Fecal pellets and gut segments from WT C57B1/6, TLR7.1 Tg, and TLR7.1 Tg mice fed with resistant starch (RS) were collected; bacterial DNA was isolated and sequenced. (A) LDA scores of altered taxa in TLR7.1 Tg mice fed with RS compared to control (CTRL) diet. Shown are significantly altered taxa (increased in green, decreased in red). (B) Total percentage of bacterial translocation as determined by culture. (C) Distribution of Lactobacillus spp. translocation in MLN, liver, and spleen from WT, TLR7.1 Tg, and TLR7.1 Tg mice fed with RS. Relative abundances of fecal L. reuteri (LR) in TLR7.1 Tg mice fed with RS compared to CTRL diet evaluated by 16S rDNA gene sequencing in (D) experimental or (E) survival cohorts. (F) Relative abundances of Lactobacillus spp. and (G) LR in gut tissues evaluated by 16S rDNA gene sequencing. The results are expressed as mean ± SEM (n=3–20 mice per group). Data are representative of at least three independent experiments. *P<0.05 was considered statistically significant; **P <0.01; ***P<0.001; ****P<0.0001; ns=not significant; W0=week RS begins. See also Figure S5 and Tables S4-S5.
Figure 6.
Figure 6.. Resistant starch suppresses lupus-related mortality and pathogenesis.
TLR7.1 Tg and C57B1/6 mice treated with IMQ were fed RS. (A) Survival analysis of TLR7.1 Tg mice fed with RS compared to CTRL diet. Experimental cohorts of TLR7.1 Tg and C57B1/6 mice were sacrificed for organ weights, immunologic, and histologic analyses. (B) Weights of spleen and liver. (C) Relative mRNA expression of type I IFN in spleen and ileum. (D) Systemic type I IFN responses in serum measured with a reporter cell line. (E-F) Cells from spleen, MLN, PP, and SI-LP were isolated and analyzed by flow cytometry. (E) Frequency of pDCs in spleen, MLN, PP, and SI-LP. (F) Total spleen and pDCs numbers. (G) Representative H&E staining of kidney tissue. (H) Histopathologic scoring for glomerulonephritis. (I) Quantification of proteinuria. The results are expressed as mean ± SEM (Survival cohorts n=8–28 mice per group, Experimental cohorts n=3–20 mice per group). The results are representative of at least two independent experiments. *P <0.05 was considered statistically significant; **P<0.01; ***P<0.001; ****P<0.0001; ns=not significant; NC=negative control; PC=positive control. See also Figure S6 and Table S6.
Figure 7.
Figure 7.. Resistant starch-induced SCFAs inhibit L. reuteri growth in vitro and L. reuteri-mediated autoimmunity in vivo.
Fecal pellets and gut segments from TLR7.1 Tg mice fed with RS were collected; bacterial DNA was isolated and sequenced. (A) Relative abundances of Clostridiales in cecal tissue evaluated by 16S rDNA gene sequencing. (B) Relative abundances of fecal Clostridiales in NHD and SLE patients separated by the presence or absence of Lactobacillus spp. (LB) determined by 16S rDNA gene sequencing. (C) Relative growth of L. reuteri (LR) cultured anaerobically with increasing doses of SCFAs acetate, propionate, and butyrate compared to MRS media alone. (D) SCFA levels measured in ileum and serum. (E-F) SPF C57B1/6 mice were treated with IMQ, fed RS, and gavaged daily with LR. Mice were sacrificed for organ weights and immunologic analyses. (E) Weights of spleen and liver. (F) Relative mRNA expression of type I IFN in spleen and ileum. (G-I) TLR7.1 Tg mice were administered SCFAs in their drinking water. Mice were sacrificed for organ weights and immunologic analyses. (G) Weights of spleen and liver. (H) Quantification of proteinuria. GF C57B1/6 mice were given SCFAs in their drinking water before (Pre) or after (Post) LR monocolonization and treated with IMQ. Mice were sacrificed for organ weights analyses. (I) Weights of spleen. The results are expressed as mean ± SEM (n=3–20 mice and 11–50 human samples per group). The results are representative of at least two independent experiments. *P<0.05 was considered statistically significant; **P<0.01; ***P<0.001; ****P<0.0001; ns=not significant. See also Figure S7 and Table S7.

Comment in

References

    1. Arpaia N, Campbell C, Fan X, Dikiy S, van der Veeken J, DeRoos P, Liu H, Cross JR, Pfeffer K, Coffer PJ, et al. (2013). Metabolites produced by commensal bacteria promote peripheral regulatory T-cell generation. Nature 504, 451–455. - PMC - PubMed
    1. Banchereau R, Hong S, Cantarel B, Baldwin N, Edens M, Cepika A, Acs P, Turner J, Vinod P, Kahn S, et al. (2016). Personalized Immunomonitoring Uncovers Molecular Networks That Stratify Lupus Patients. Cell 165, 551–565. - PMC - PubMed
    1. Bourn R, and James JA (2016). Pre-Clinical Lupus. Curr. Opin. Rheumatol 8, 444–454.
    1. Buechler MB, Teal TH, Elkon KB, and Hamerman JA (2013). Type I IFN drives emergency myelopoiesis and peripheral myeloid expansion during chronic Toll-like receptor 7 signaling. J. Immunol 190, 886–891. - PMC - PubMed
    1. Caporaso JG, Kuczynski J, Stombaugh J, Bittinger K, Bushman FD, Costello EK, Fierer N, Peña AG, Goodrich JK, Gordon JI, et al. (2010). QIIME allows analysis ofhigh- throughput community sequencing data Intensity normalization improves color calling in SOLiD sequencing. Nat. Methods 7, 335–336. - PMC - PubMed

Publication types

MeSH terms