. 2019 Jan 17;73(2):354-363.e3.
doi: 10.1016/j.molcel.2018.10.042. Epub 2018 Dec 20.

Role of Mitochondria in Ferroptosis

Affiliations

Role of Mitochondria in Ferroptosis

Minghui Gao et al. Mol Cell. .

Abstract

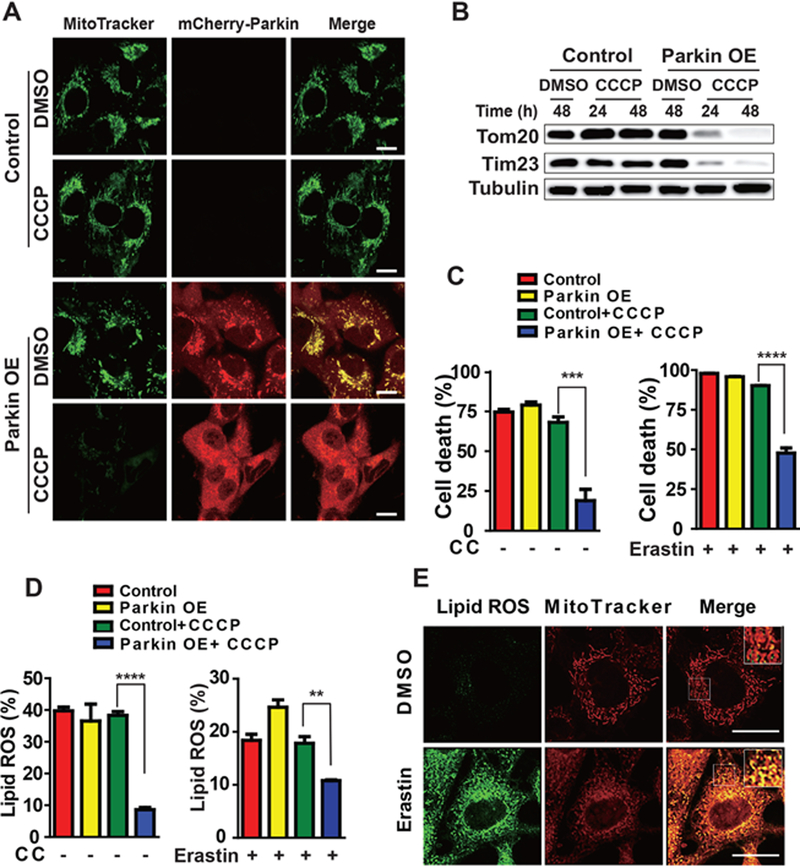
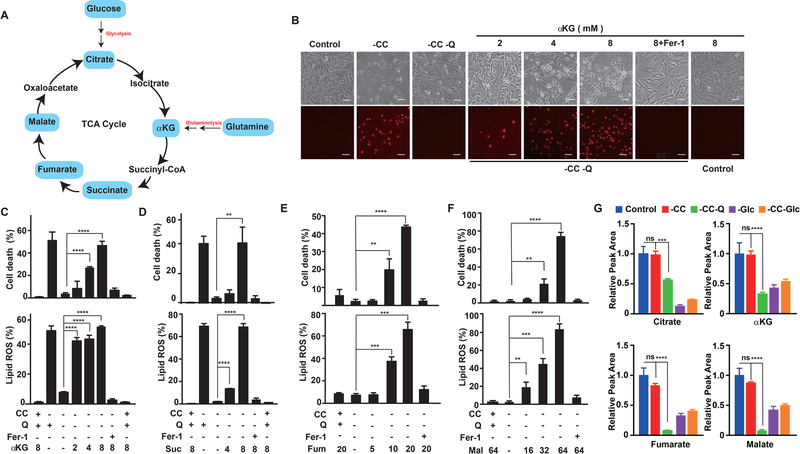
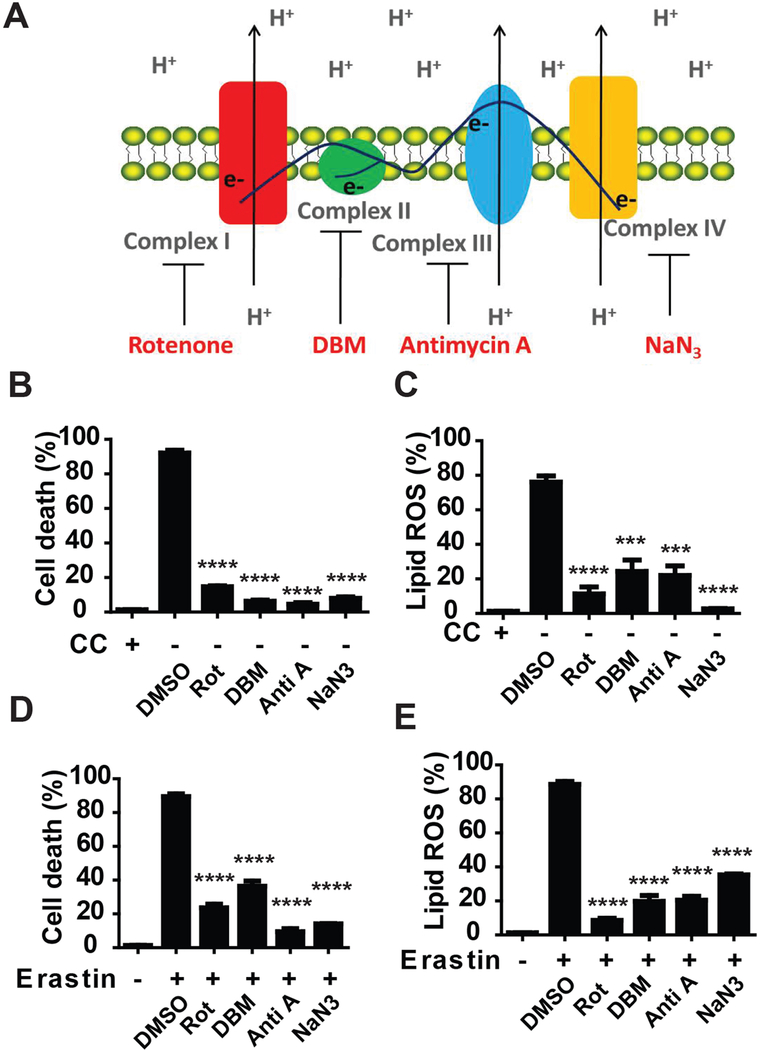
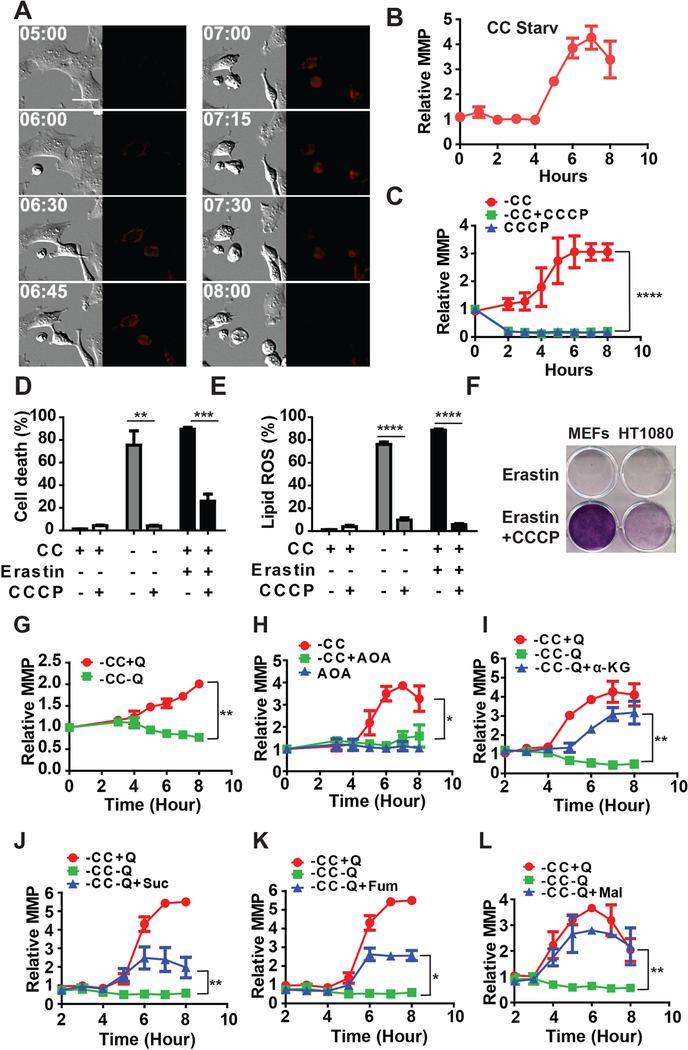
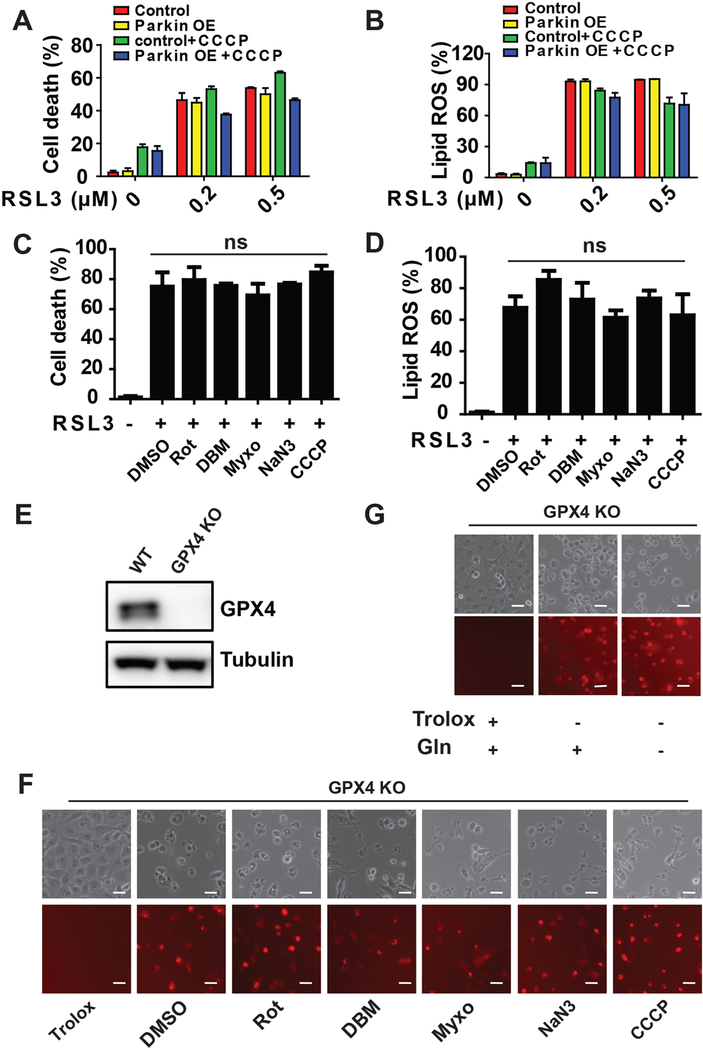
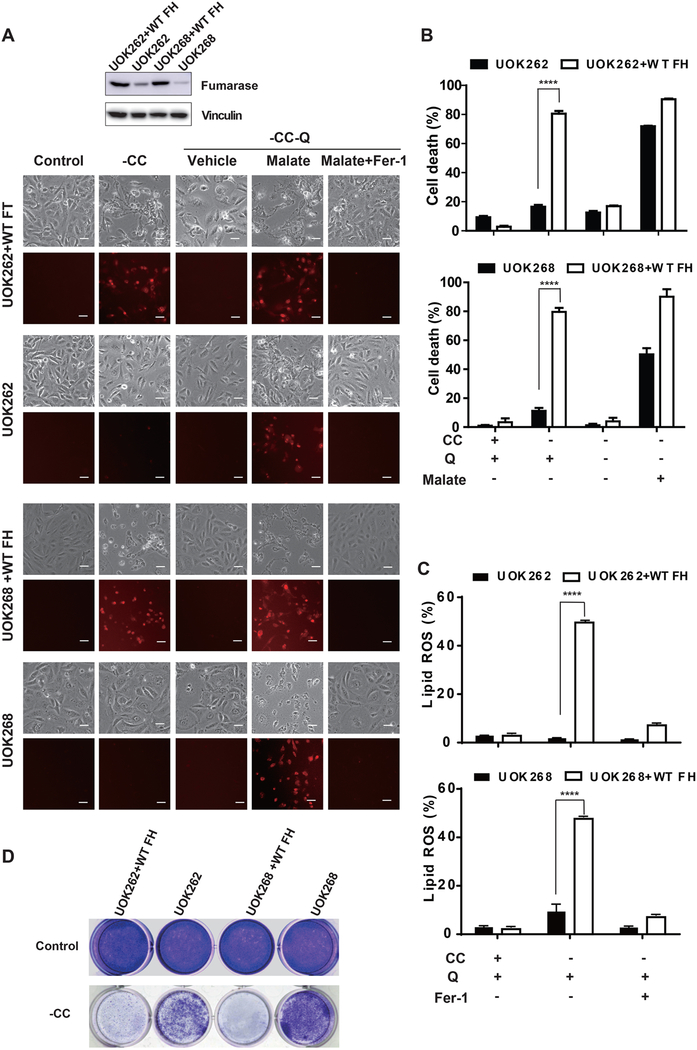
Ferroptosis is a regulated necrosis process driven by iron-dependent lipid peroxidation. Although ferroptosis and cellular metabolism interplay with one another, whether mitochondria are involved in ferroptosis is under debate. Here, we demonstrate that mitochondria play a crucial role in cysteine-deprivation-induced ferroptosis but not in that induced by inhibiting glutathione peroxidase-4 (GPX4), the most downstream component of the ferroptosis pathway. Mechanistically, cysteine deprivation leads to mitochondrial membrane potential hyperpolarization and lipid peroxide accumulation. Inhibition of mitochondrial TCA cycle or electron transfer chain (ETC) mitigated mitochondrial membrane potential hyperpolarization, lipid peroxide accumulation, and ferroptosis. Blockage of glutaminolysis had the same inhibitory effect, which was counteracted by supplying downstream TCA cycle intermediates. Importantly, loss of function of fumarate hydratase, a tumor suppressor and TCA cycle component, confers resistance to cysteine-deprivation-induced ferroptosis. Collectively, this work demonstrates the crucial role of mitochondria in cysteine-deprivation-induced ferroptosis and implicates ferroptosis in tumor suppression.


Conflict of interest statement

Declaration of Interests

The authors declare no competing interests (CBT is a founder of Agio Pharmaceuticals and a member of its scientific advisory board. Agio does not hold financial interests in the work reported in this paper).

Figures

Figure 1.
Figure 1.. Mitochondria regulate cysteine deprivation-induced ferroptosis
(A-D) Mitochondrial depletion by Parkin-mediated mitophagy inhibits cysteine deprivation-induced ferroptosis. Wild type (Control) or mCherry-Parkin overexpressing (Parkin OE) HT1080 cells were treated with 10 μM CCCP (Carbonyl cyanide m-chlorophenyl hydrazone) for 48 h, unless otherwise indicated (as in panel B, 24 or 48 h), to induce mitochondrial depletion. After recovery from CCCP treatment by incubating cells in CCCP-free normal culture medium for 24 h, the following experiments were performed: the presence of mitochondria was assessed by MitoTracker staining (Scale bar = 10 μM) (A) or by Western blot for endogenous TOM20 and TIM23 (B); Cells were treated with erastin or cystine (CC) starvation for 12 h for cell death measurement (C) or 8 h for lipid ROS measurement (D). Cell death was measured with Sytox Green staining coupled with flow cytometry. The accumulation of lipid ROS was assessed by BODIPY C11 staining coupled with flow cytometry analysis. All quantitative data in this and other figures are presented as mean ± SD from three independent experiments; and p values were calculated with unpaired t test (same for other figures. *, P<0.05; **, P<0.01; ***, p < 0.001; ****, p<0.0001). (E) Co-localization of oxidized lipid and mitochondria. MEFs were treated as indicated for 4 h, and then cells were co-stained with BODIPY C11 and MitoTracker. Oxidized BODIPY C11 (Green) indicating lipid ROS and mitochondrial signals (Red) were imaged by fluorescent microscope. Scale bar = 10 μm. See also Figure S1.
Figure 2.
Figure 2.. Mitochondrial TCA cycle promotes cysteine deprivation-induced ferroptosis
(A) An overview of mammalian Tricarboxylic Acid Cycle. (B-C) α-ketoglutarate can mimic the death-inducing activity of L-Glutamine (L-Gln). (B) Microscopy showing cell death. MEFs were treated as indicated for 10 h. Upper panel: phase-contrast; lower panel, propidium iodide (PI) staining for dead cells (Scale bar = 100 μM). (C) For cell death measurement, MEFs were subjected to the same treatment as in panel (B) and cell death was determined by PI staining coupled with flow cytometry; for lipid ROS measurement, MEFs were treated as in panel (B) for 8 h and then lipid ROS was determined by BODIPY C11 staining coupled with flow cytometry. (D-F) TCA metabolites succinate (D), fumarate (E) and Malate (F) can mimic the death inducing activity of L-Gln. (G) Glutamine is required for the maintenance of the normal level of multiple TCA cycle metabolites during ferroptosis. MEFs were treated as indicated for 8 hours, and samples were collected and measured by GC/MS metabolomic analysis as detailed in Methods. For all experiments, 10% (V/V) dialyzed FBS was used in the assay medium. Q: L-glutamine (1 mM); CC: L-cystine (0.2 mM); αKG: Dimethyl-α−2-oxoglutarate (mM); Suc: Dimethyl succinate (mM); Fum: Dimethyl fumarate (μM); Mal: Dimethyl (S)-(−)-malate (mM); Fer-1: ferrostatin-1 (1 μM). See also Figure S2.
Figure 3.
Figure 3.. ETC activity promotes cysteine deprivation-induced ferroptosis
(A) Scheme shows mitochondrial electron transport chain (ETC) complexes and their inhibitors. (B) Inhibitors of ETC can inhibit CC starvation-induced ferroptosis. MEFs were treated with CC starvation for 12 h, in the absence or presence of ETC inhibitors as indicated. Cell death was determined by PI staining coupled with flow cytometry. Complex I inhibitor rotenone (Rot), 10 μM; Complex II inhibitor diethyl butylmalonate (DBM), 2 mM; Complex III inhibitor antimycin A (Anti A), 50 μM; Complex IV inhibitor NaN3, 15 mM. (C) ETC inhibitors can inhibit CC starvation-induced lipid ROS accumulation. MEFs were treated with CC for 6 h, in the absence or presence of ETC inhibitors as indicated. Accumulation of lipid ROS was determined by BODIPY C11 staining coupled with flow cytometry. (D) ETC inhibitors can inhibit erastin-induced ferroptosis. MEFs were treated with 1 μM erastin for 12 h, in the absence or presence of ETC inhibitors as indicated. Cell death was determined by PI staining coupled with flow cytometry. (E) ETC inhibitors can inhibit erastin-induced lipid ROS accumulation. MEFs were treated with 1 μM erastin for 6 h, in the absence or presence of ETC inhibitors as indicated. Accumulation of lipid ROS was determined by BODIPY C11 coupled with flow cytometry. See also Figure S3.
Figure 4.
Figure 4.. Mitochondrial membrane potential hyperpolarization is associated with cysteine deprivation-induced lipid ROS accumulation and ferroptosis.
(A) Ferroptosis is accompanied by mitochondrial membrane potential (MMP) hyperpolarization. Representative still images from time-lapse imaging of mitochondrial membrane potential in MEFs undergoing CC starvation-induced ferroptosis. Cells were incubated with TMRE (200 nM), and subjected to CC starvation for indicated time (Scale bar = 5 μM). (B) Quantification of MMP during CC starvation-induced ferroptosis. MEFs were treated with CC starvation, and 500 nM TMRE was added 30 min before each indicated time point. MMP was measured by flow cytometry and mean fluorescence was calculated. (C) CCCP can inhibit ferroptosis-associated MMP hyperpolarization. MEFs were treated with CC starvation plus or minus 10 μM CCCP for indicated time, and 500 nM TMRE was added 30 min before each indicated time point. MMP was measured by flow cytometry and mean fluorescence was calculated. (D) CCCP can block ferroptosis induced by CC starvation or erastin. MEFs were treated as indicated for 12 h and cell death was determined by PI staining coupled with flow cytometry. (E) CCCP can block lipid ROS accumulation induced by CC starvation or erastin. MEFs were treated as indicated for 8 h and lipid ROS was measured by BODIPY C11 staining coupled with flow cytometry. (F) Cells protected by CCCP from erastin-induced ferroptosis maintain viability. MEFs and HT1080 cells were seeded at low density in 12-well dishes and treated with erastin for 16 h, in the absence or presence of CCCP as indicated. Cells were then allowed to recover in drug-free DMEM medium for 3 days and subsequently fixed and stained with crystal violet. (G-H) Glutaminolysis and TCA cycle drive ferroptosis-associated MMP hyperpolarization in MEFs.(G) Glutamine is required for CC starvation-induced MMP hyperpolarization.(H) Transaminase inhibitor AOA (Aminooxyacetic acid, 0.5 mM) can block CC starvation-induced MMP hyperpolarization. (I-L) TCA intermediates α-ketoglutarate (I) succinate (J), fumarate (K) and Malate (L) can replace the requirement of glutamine for CC starvation-induced MMP hyperpolarization. αKG: Dimethyl-α−2-oxoglutarate (8 mM); Suc: Dimethyl succinate (8 mM); Fum: Dimethyl fumarate (5 μM); Mal: Dimethyl (S)-(−)-malate (32 mM). See also Figure S4 and Movies 1–3.
Figure 5.
Figure 5.. Mitochondria are dispensable for GPX4 inhibition-induced ferroptosis
(A-B) Mitochondrial depletion by Parkin-mediated mitophagy cannot inhibit RSL3-induced ferroptosis. Mitochondria-depleted HT1080 cells were created as described in Figure 1. Cells were treated with RSL3 for 6 h for cell death measurement (A) or 4 h for lipid ROS measurement (B). Cell death was measured with DAPI staining coupled with flow cytometry. The accumulation of lipid ROS was assessed by BODIPY C11 staining coupled with flow cytometry analysis. (C-D) Mitochondrial ETC inhibitors cannot inhibit RSL3-induced ferroptosis and lipid ROS accumulation. (E) Western blotting confirmed CRISPR-Cas9 mediated knockout of GPX4 in HT1080 cells (see Methods for detail). (F) Mitochondrial ETC inhibitors cannot inhibit GPX4 Knockout-induced ferroptosis. GPX4 KO HT1080 cells were seeded and subsequently grew in DMEM medium containing 0.2 mM Trolox. Ferroptosis induction was initiated by switching cells to Trolox-free medium, in the presence or absence of indicated ETC complex inhibitors for 8 h. Complex I inhibitor rotenone (Rot), 10 μM; Complex II inhibitor Diethyl butylmalonate (DBM), 2 mM; Complex III inhibitor Myxothiazol (Myxo), 15 μM; Complex IV inhibitor NaN3, 15 mM. (G) Glutamine is dispensable for GPX4 Knockout-induced ferroptosis. GPX4 KO HT1080 cells were seeded and subsequently grew in DMEM medium containing 0.2 mM Trolox. Ferroptosis induction was initiated by switching cells to Trolox-free medium, in the presence or absence of 1 mM glutamine for 8 h. Scale bar = 100 μM. See also Figure S5.
Figure 6.
Figure 6.. Loss of function of mitochondrial tumor suppressor fumarate hydratase confers resistance to ferroptosis
(A-C) Fumarase (FH)-mutant cancer cells are more resistant to CC starvation-induced ferroptosis than isogenic cells expressing WT FH. (A) Microscopy showing cell death. Two pairs of FH-mutant cancer cells and their isogenic cells expressing WT FH were treated as indicated for 36 h (UOK262 and UOK262+WT FH) or 60 h (UOK268 and UOK268+WT FH). Upper panel: phase-contrast; lower panel, PI staining for dead cells (Scale bar = 100 μM). Western blot shows the expression level of FH in these cell lines. (B) Cell death was determined by PI staining coupled with flow cytometry. (C) lipid ROS was determined by BODIPY C11 staining coupled with flow cytometry (D) FH-mutant cancer cells recovered and proliferated after CC starvation. Cells were treated with CC starvation for 24 h (UOK262 and UOK262+WT FH) or 60 h (UOK268 and UOK268+WT FH), and then cells were incubated in full DMEM medium for 3 days. Colony formation was measured by crystal violet staining. See also Figure S6.

References

    1. Adam J, Hatipoglu E, O’Flaherty L, Ternette N, Sahgal N, Lockstone H, Baban D, Nye E, Stamp GW, Wolhuter K, et al. (2011). Renal Cyst Formation in Fh1-Deficient Mice Is Independent of the Hif/Phd Pathway: Roles for Fumarate in KEAP1 Succination and Nrf2 Signaling. Cancer cell 20, 524–537. - PMC - PubMed
    1. Alam NA, Olpin S, Rowan A, Kelsell D, Leigh IM, Tomlinson IP, and Weaver T (2005). Missense mutations in fumarate hydratase in multiple cutaneous and uterine leiomyomatosis and renal cell cancer. The Journal of molecular diagnostics : JMD 7, 437–443. - PMC - PubMed
    1. Angeli JPF, Shah R, Pratt DA, and Conrad M (2017). Ferroptosis Inhibition: Mechanisms and Opportunities. Trends in pharmacological sciences 38, 489–498. - PubMed
    1. Carey BW, Finley LW, Cross JR, Allis CD, and Thompson CB (2015). Intracellular alpha-ketoglutarate maintains the pluripotency of embryonic stem cells. Nature 518, 413–416. - PMC - PubMed
    1. Cassago A, Ferreira AP, Ferreira IM, Fornezari C, Gomes ER, Greene KS, Pereira HM, Garratt RC, Dias SM, and Ambrosio AL (2012). Mitochondrial localization and structure-based phosphate activation mechanism of Glutaminase C with implications for cancer metabolism. Proceedings of the National Academy of Sciences of the United States of America 109, 1092–1097. - PMC - PubMed

Publication types

MeSH terms